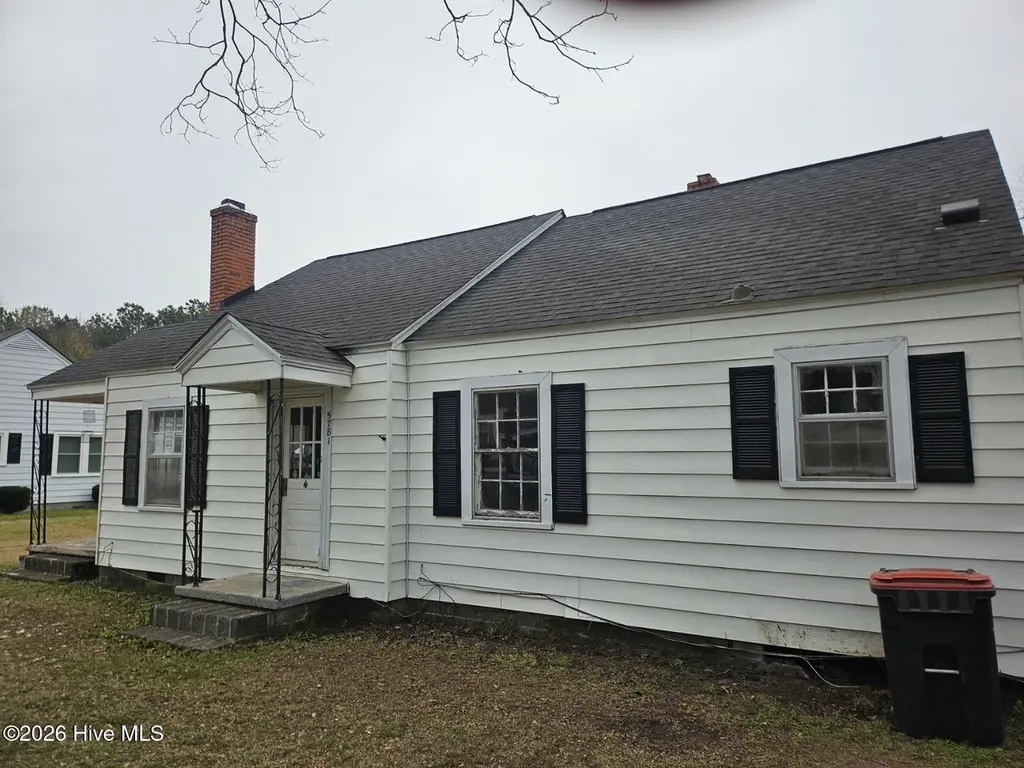
5781 Scotland Ave · Gibson, NC
Flood risk 1/10 · Minimal
- FEMA flood zone
- X (unshaded)
- Chance of flooding over 30 yrs
- 0.0%
- Est. flood insurance / yr
- $507 – $1,088
Fire risk 5/10 · Moderate
- Est. fire insurance / yr
- $906 – $1,684
Heat risk 7/10 · Major
- Hot days now (above 107°F)
- 7 days/yr
- Hot days in 30 yrs
- 16 days/yr
Wind risk 6/10 · Moderate
- Chance of severe wind over 30 yrs
- 69.0%
Air-quality risk 1/10 · Minimal
- Unhealthy air days now
- 0 days/yr
- Unhealthy air days in 30 yrs
- 0 days/yr
Risk factors via First Street. Map © Google.
Why this score? — see what drove the C grade
The composite is a weighted blend of 9 inputs, each scored 0–100. Each bar is that input's sub-score; the figure is the points it added to the 100-point composite (weight × sub-score).
- Cash flow +26.0/30.0
- DSCR +8.7/10.0
- 1% rule +6.3/10.0
- Appreciation +6.0/10.0
- Rent growth +2.5/5.0
- Livability +2.5/5.0
- Condition / age +2.5/5.0
- ARV discount +2.4/15.0
- Schools +2.1/10.0
$99,500
🖨 Deal sheet 📄 Offer letter ✓ Due diligence
Listing remarks
Small home needs a lot of work, but on a great street with other beautiful homes. Property Sold ''AS IS'' NO EXECPTIONS
Key facts
- 0.57 acre lot
- 1223 garage spots
- Built 1957
Property features AI
Finance
- Other: Zoning: RA; Lot ~0.57 acres (approx. 130 x 190); Subdivision: Gibson; Directions: Main St in Town of Gibson, turn on McColl St, then right on Scotland Ave; house will be on the left
Exterior
- Parking: Attached garage; Unpaved parking areas; 1,223 total parking spaces / garage spaces
- Utilities: Public water; Public sewer; Water and sewer available; Electric service
- Home design: Single family residence; One story
- Construction: Metal siding and frame construction; Block foundation; Shingle roof; Built as a residential single family home
- Exterior features: Covered patio/porch; Level lot; Paved road access; Has view
Interior
- Flooring: Laminate
- Bathrooms: 1 full bathroom
- Heating & cooling: Baseboard heating; Electric heating; Central air conditioning
- Interior features: Unfurnished; Electric water heater; Laminate flooring; 6 total rooms; No basement
Neighborhood map
What this means for you Summary
Snapshot
- This is a 3-bed/1.0-bath single-family listed at $100k.
Deal economics
- At list price, monthly cash flow is $246 ($3k/yr) — positive.
- The deal already cash-flows at list — no discount required.
- Meets the 1% rule at list price ($1k rent vs $100k).
- Recommended offer: $94k (6.0% below list) — sets the bar for market timing.
Location & tenants
- Location reads 50/100 on livability (#707 in NC) — a working-class tenant base; expect higher turnover. Strengths: cost of living A+; Watch: health & safety C-, crime F, amenities F.
- Scotland County Schools (town): math 23% / reading 28% proficiency, ranked #160 of 178 in NC (top 90%) — low school quality limits family demand, transient renter base, plan for 1-2y turnover; 72% free/reduced lunch — lower-income household profile, screen leases tightly.
- Zoned schools: Sycamore Lane Primary (420 students, 99% FRL); Carver Middle (math 17% / reading 26%, grade F, #422 of 475 statewide, top 89%, 659 students, 100% FRL) — zoned schools average 99% FRL vs 72% district-wide (27 pts higher); higher-poverty schools than district average — tighter screening recommended.
- Market conditions: 8 active listings in the ZIP; 70 units permitted in Scotland County in 2024 (0 in 5+ unit buildings).
Forward outlook
- In year one you build about $3k of equity ($688 loan paydown + $2k appreciation (1.9% local appreciation)).
- Scotland County population projected at -20% by 2050 — secular population decline; favor cash flow + early exit over multi-decade hold.
- At projected returns (1.9% appreciation + 3.0% rent growth), your $28k cash investment doubles in ~5 years — after that, you're playing with house money.
Negotiation context
- It's been on market 84 days — a 6% lower offer ($94k) is reasonable based on typical stale-listing flexibility.
Risks & watch-outs
- Watch-outs: built in 1957 — expect roof / HVAC / electrical / plumbing capex.
- Climate carrying-cost: major wind risk, 69% chance of damaging wind over 30y; moderate wildfire risk; extreme-heat days projected 7→16/yr by 2055 (HVAC capex compounding) — expect insurance premiums to compound above CPI over the hold.
Questions for the listing agent
- It's been on market 84 days. Have you received any prior offers? Is the seller open to a 6% concession, seller financing, or rate buy-down credit?
- Built in 1957 — when were the roof, HVAC, electrical panel, plumbing, and water heater last replaced?
- Why hasn't it sold? Are there any deal-killer items the seller is aware of (foundation, flood, title, zoning, code violations)?
- Is there a deadline driving the sale (1031 exchange, divorce, estate, relocation)? That informs how much negotiation room exists.
- Schools are F-rated, which usually means shorter tenancies and higher turnover. Who's the typical renter profile here, and what's been the actual vacancy rate?
- Crime grade is F in this area — have there been break-ins, vandalism, or insurance claims at this property in the last 3 years? What carrier currently insures it and at what premium?
- What's the average days-on-market for RENTAL listings here right now (not sales)? A rising rental-DOM trend means longer vacancies and softer asking-rent achievability than the comps imply.
- What's the recent tenant-quality profile in this submarket — average credit score on applications, eviction rate, late-payment / NSF rate, and stable-employment percentage? A property-management company in the area should have these aggregated.
- How much new for-sale + rental construction is in the pipeline within 1–3 miles? Heavy new supply typically softens prices + rents 12–24 months out; constrained supply supports both.
Investment metrics
- 1% rule
- 1.13% ✓
- Cap rate
- 9.26%
- Cash-on-cash
- 10.61%
- DSCR
- 1.47
- GRM
- 7.4
CMA / ARV
- ARV (on-the-fly)
- $89,460
- Comps found
- 1
Show comp detail 1 sale within ~0.75 mi
| Address | Dist | Beds/Ba | Sqft | Sold | Price | $/sf | Match |
|---|---|---|---|---|---|---|---|
| 4740 Main St | 0.11mi | 3/1.0 | 1,425 (+12%) | 11mo | $100,000 | $70 | 67 |
Match score weights: distance 35% · size 25% · config 20% · recency 20%. Top-matched comps best support the ARV.
Projected returns pro-forma
1.9% appreciation · 3.0% rent growth · sell at horizon
- IRR
- 14.7%
- Equity multiple
- 1.79×
- Total profit
- $22,001
- Equity at exit
- $38,719
- IRR
- 17.3%
- Equity multiple
- 3.29×
- Total profit
- $63,701
- Equity at exit
- $55,354
Cash invested: $27,860 (down + closing). Projections, not guarantees.
Landlord ↔ Tenant lean methodology
- Overall (STATE)
- 85 Strongly Landlord-Friendly
- State North Carolina
- 85 Strongly Landlord-Friendly · R+3
- County
- — inherits STATE
- City
- — inherits STATE
ZIP-level market 28343
- Home prices YoY
- 1.4%
- Active inventory
- 8
- Price-to-rent
- 7.4×
Monthly cashflow live
- Estimated rent
- $1,120 medium interval (Pro) →
- Mortgage (P&I)
- −$522
- Tax from tax record
- −$75 /mo · $899/yr
- Insurance
- −$41
- HOA
- −$0
- Vacancy / Maint / Mgmt
- −$235
- Net cashflow
- $246
Break-even live
UW: 25.0% down · 7.5% · 30yr · 1.5% tax · 5.0% vac · 8.0% maint · 8.0% mgmt
Financing live
Cash to close
- Down payment
- $24,875
- Closing costs
- $2,985
- Reserves months
- —
- Total cash needed
- —
Loan-product check · same deal, 3 products live
Conventional
25% down · 7.5% · 30yr
- Down + closing
- —
- Monthly P&I
- —
- Monthly cashflow
- —
- DSCR
- —
- Eligible?
- —
Personal DTI + credit; lowest rate.
DSCR
20% down · 8.5% · 30yr
- Down + closing
- —
- Monthly P&I
- —
- Monthly cashflow
- —
- DSCR
- —
- Eligible?
- —
No personal income docs; deal must DSCR.
Hard money
10% down · 12.0% · 12mo
- Down + closing
- —
- Monthly P&I
- —
- Monthly cashflow
- —
- DSCR
- —
- Eligible?
- —
Short-term bridge; refi at stabilization.
Listing history 18 events
-
2026-06-18days on market $99,500 Active 84 DOM
-
2026-06-17days on market $99,500 Active 83 DOM
-
2026-06-16days on market $99,500 Active 82 DOM
-
2026-06-15days on market $99,500 Active 81 DOM
-
2026-06-14days on market $99,500 Active 79 DOM
-
2026-06-13days on market $99,500 Active 78 DOM
-
2026-06-10days on market $99,500 Active 76 DOM
-
2026-06-09days on market $99,500 Active 75 DOM
-
2026-06-08days on market $99,500 Active 74 DOM
-
2026-06-07days on market $99,500 Active 73 DOM
-
2026-06-05days on market $99,500 Active 70 DOM
-
2026-06-03days on market $99,500 Active 69 DOM
-
2026-06-02days on market $99,500 Active 68 DOM
-
2026-06-01days on market $99,500 Active 67 DOM
-
2026-05-31days on market $99,500 Active 66 DOM
-
2026-05-30days on market $99,500 Active 65 DOM
-
2026-05-22price $99,500
-
2026-03-26$109,000 Active
ⓘ Source: listings_history table (triggers on properties + properties_extension) + one-shot
backfill from property_details.listing_events for pre-trigger history.
Tax reassessment forecast NC · Resets to sale price
- Current annual tax
- $899 · $75/mo
- Projected year-2 tax
- $899 · $75/mo
- Expected delta
- $0/yr ($0/mo · 0.0%)
ⓘ Screening estimate from a state-policy table — verify with the county assessor before closing.
Climate risk First Street
- Flood 1/10 Low FEMA zone X (unshaded) · 0% chance over 30 yrs
- Wildfire 5/10 Major
- Heat 7/10 Severe 7 d/yr ≥107°F today · 16 d/yr by 30 yrs out
- Wind 6/10 Major 69% chance of damaging wind over 30 yrs
- Air quality 1/10 Low 0 unhealthy d/yr today · 0 by 30 yrs out
Nearby sold comps map
Loading sold comps map…
Walkable amenities ~0.75 mi
Loading nearby amenities…
Taxation est. · year 1
- Rental income
- $13,435
- − Mortgage interest
- −$5,574
- − Property taxes
- −$899
- − Insurance
- −$498
- − Repairs & maintenance
- −$1,075
- − Management
- −$1,075
- − Depreciation
- −$2,895
- Taxable income
- $1,421
- Est. tax owed @ 24.0%
- −$341
- After-tax cash flow
- $2,615/yr
For passive investors: Depreciation is non-cash, so a rental often shows a tax loss while cash-flowing — sheltering income. Rental losses are passive: they offset passive income freely, and up to $25,000/yr can offset ordinary (W-2) income if you actively participate and your MAGI is under $100k (phasing out to $0 by $150k); unused losses carry forward. On sale, claimed depreciation is recaptured at up to 25%, and gains may owe capital-gains tax (a 1031 exchange can defer both). Figures are a year-1 estimate at your 24.0% rate — not tax advice; consult a CPA.
Schools (NCES district)
- District
- Scotland County Schools
- NCES district ID
- 3704200
- Math proficiency
- 23% ▼ -5.00%
- Reading proficiency
- 28% ▼ -3.00%
- Median HH income
- $31,203
- Composite
- 20.66/100
- National rank
- #8536
- State rank
- #160 of 178 in NC
Livability — Gibson
- Score
- 50/100
- State rank
- #707
- US rank
- #25641
Category grades
Schools grade is shown separately in the Schools card above.
Census & demographics
- Census place
- Gibson, NC
- Population (ZIP)
- 1,795
Population outlook (Scotland County) Hauer SSP2
- Today (2025)
- 33,331 people
- By 2030
- 32,017 · -3.9%
- By 2040
- 29,290 · -12.1%
- By 2050
- 26,554 · -20.3%
- By 2075
- 19,857 · -40.4%
- By 2100
- 13,851 · -58.4%
Race, ethnicity, and origin ACS 2023
- Neighborhood character
- Diverse neighborhood (Simpson 0.64)
- Race & ethnicity
- Black 50% White 33% Native American 15% Two or more races 2%
- Common ancestry
- Welsh 1% Serbian 1%
- Foreign-born
- 0%
Political lean MEDSL · Scotland
- 2024 margin
- Lean R (+6.9) · D 46.2% · R 53.1%
- 2008→2024 swing
- -22.0pp toward R · 2008: 15.1pp · 2024: -6.9pp
- All cycles
- 2024: R+6.9 2020: R+1.9 2016: D+7.8 2012: D+16.6 2008: D+15.1
Not yet ingested
- Civics
- —
Market trends
- HPI YoY
- ▲ 1.90%
- Current HPI
- 133.9663
- Rent YoY
- —
- Metro
- —
- State GDP YoY
- ▲ 3.28%
- F500 in state
- 26
Industry mix (Fortune 500 HQ in NC)
| Industry | F500 HQs | Revenue |
|---|---|---|
| Financial Services | 2 | $213B |
|
||
| Retail | 2 | $95B |
|
||
| Industrial Conglomerate | 1 | $38B |
|
||
| Metals / Steel | 1 | $35B |
|
||
| Utilities | 1 | $30B |
|
||
| Industrial Machinery | 1 | $19B |
|
||
Price history
-8.7% since first listed2 events — show timeline
- 2026-05-22 Price Changed $99,500 Hive MLS
- 2026-03-26 Listed $109,000 Hive MLS
Property tax history
-0.0%/yrLatest (2025): $899 · +0.0% YoY. Source: county tax records.
Cash-flow waterfall
monthlySold comps — $/sqft
last 12 mo · ≤1 miLoading sold comps…