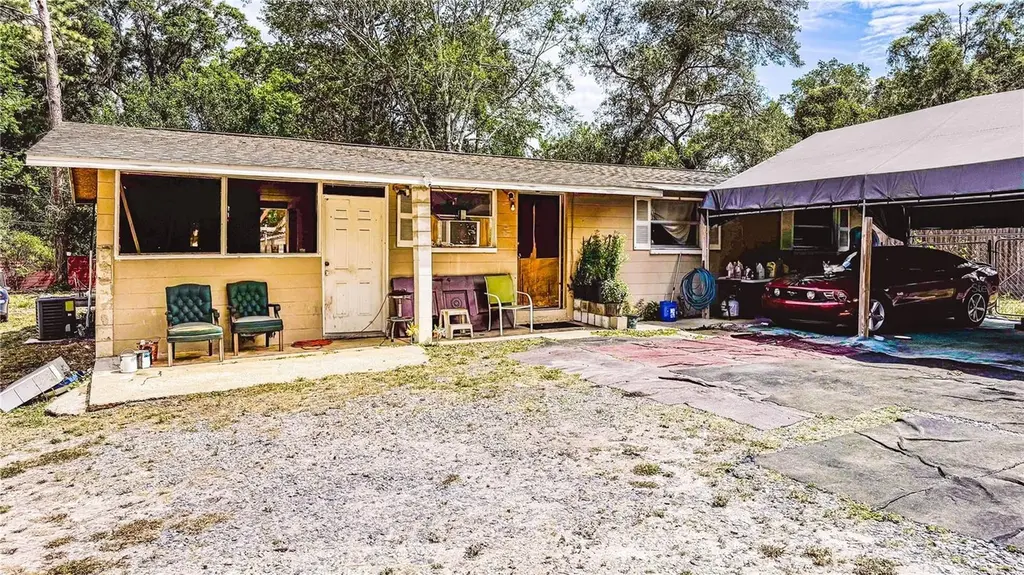
6722 SW 53rd Ave · Gainesville, FL
Flood risk 1/10 · Minimal
- FEMA flood zone
- X (unshaded)
- Chance of flooding over 30 yrs
- 0.0%
- Est. flood insurance / yr
- $507 – $1,088
Fire risk 4/10 · Minor
- Est. fire insurance / yr
- $947 – $1,759
Heat risk 8/10 · Major
- Hot days now (above 108°F)
- 7 days/yr
- Hot days in 30 yrs
- 21 days/yr
Wind risk 9/10 · Severe
- Chance of severe wind over 30 yrs
- 99.0%
Air-quality risk 3/10 · Minor
- Unhealthy air days now
- 4 days/yr
- Unhealthy air days in 30 yrs
- 4 days/yr
Risk factors via First Street. Map © Google.
Why this score? — see what drove the C+ grade
The composite is a weighted blend of 9 inputs, each scored 0–100. Each bar is that input's sub-score; the figure is the points it added to the 100-point composite (weight × sub-score).
- Cash flow +25.8/30.0
- DSCR +8.6/10.0
- ARV discount +7.5/15.0
- 1% rule +7.0/10.0
- Schools +4.3/10.0
- Livability +4.0/5.0
- Rent growth +3.2/5.0
- Condition / age +2.5/5.0
- Appreciation +0.0/10.0
$140,000
🖨 Deal sheet 📄 Offer letter ✓ Due diligence
Listing remarks
INVESTOR ALERT! CASH ONLY, SOLD AS-IS! Concrete block 2 bedroom / 1 bathroom home on . 46 acre lot. Enclosed carport with separate laundry area provides additional storage. Fully fenced yard.
Key facts
- Enclosed carport
- Fully fenced yard
- Concrete block home
Tags
Property features AI
Finance
- Other: Unfurnished
- HOA & community: No homeowners association; Located in the Arredondo Estates development
Exterior
- Utilities: Public water; Septic tank; Electricity connected; Water service connected
- Home design: Single family residence; One story; Facing south
- Construction: Block construction; Shingle roof; Slab foundation; Built with approximately 1,232 sq ft living area (public records)
- Exterior features: Paved road access; Lot approximately 0.46 acres
Interior
- Kitchen: Refrigerator
- Bedrooms: 3 bedrooms
- Flooring: Other flooring
- Bathrooms: 1 full bathroom
- Heating & cooling: Ductless heating; Wall/window air conditioning units
- Interior features: Other interior features; Refrigerator included
- Laundry & utility: Inside laundry room
Neighborhood map
What this means for you Summary
Snapshot
- This is a 2-bed/1.0-bath single-family listed at $140k.
Deal economics
- At list price, monthly cash flow is $339 ($4k/yr) — positive.
- The deal already cash-flows at list — no discount required.
- Meets the 1% rule at list price ($2k rent vs $140k).
- Recommended offer: $136k (3.0% below list) — sets the bar for market timing.
Location & tenants
- Location reads 81/100 on livability (#97 in FL, #1,480 nationally) — a professional / high-income tenant draw. Strengths: amenities A+, commute A+, cost of living A+; Watch: employment D+, crime F.
- Alachua (urban): math 49% / reading 54% proficiency, ranked #30 of 73 in FL (top 41%) — acceptable for families but not a draw, mixed tenant base, ~2y average lease.
- Market conditions: Rents rising (+2.9%/yr); 594 active listings in the ZIP; 2 comparable units currently listed for rent nearby; 1,774 units permitted in Alachua County in 2024 (984 in 5+ unit buildings).
- This rent runs 33% of the median local income ($62k/yr) — at the standard rent-burdened threshold; future hikes will face affordability resistance.
Forward outlook
- Local home prices are declining (-3.0%/yr); year-one equity from $968 of loan paydown is wiped out by about $4k of value loss. Plan a longer hold.
- Alachua County population projected at +26% by 2050 — long-run rental-demand tailwind backs the buy-and-hold thesis.
Negotiation context
- It's been on market 56 days — a 3% lower offer ($136k) is reasonable based on typical stale-listing flexibility.
- 2 sale attempts since 17y ago with the ask held roughly flat each time — persistent listings suggest the price (not the market) is what's stuck; bring a comps-based counter.
- Current owner paid $41k; list at $140k implies a 241% gain — meaningful room to come down on a strong offer.
Risks & watch-outs
- Climate carrying-cost: severe wind risk, 99% chance of damaging wind over 30y; extreme-heat days projected 7→21/yr by 2055 (HVAC capex compounding) — expect insurance premiums to compound above CPI over the hold.
Questions for the listing agent
- It's been on market 56 days. Have you received any prior offers? Is the seller open to a 3% concession, seller financing, or rate buy-down credit?
- Built in 1966 — when were the roof, HVAC, electrical panel, plumbing, and water heater last replaced?
- Is there a deadline driving the sale (1031 exchange, divorce, estate, relocation)? That informs how much negotiation room exists.
- Schools are B-rated — typically a magnet for longer-tenancy family renters. What's the average tenant stay here, and is there a school-zone premium baked into asking?
- Crime grade is F in this area — have there been break-ins, vandalism, or insurance claims at this property in the last 3 years? What carrier currently insures it and at what premium?
- What's the average days-on-market for RENTAL listings here right now (not sales)? A rising rental-DOM trend means longer vacancies and softer asking-rent achievability than the comps imply.
- What's the recent tenant-quality profile in this submarket — average credit score on applications, eviction rate, late-payment / NSF rate, and stable-employment percentage? A property-management company in the area should have these aggregated.
- How much new for-sale + rental construction is in the pipeline within 1–3 miles? Heavy new supply typically softens prices + rents 12–24 months out; constrained supply supports both.
Investment metrics
- 1% rule
- 1.20% ✓
- Cap rate
- 9.20%
- Cash-on-cash
- 10.37%
- DSCR
- 1.46
- GRM
- 6.9
CMA / ARV
No comps found within radius.
Projected returns pro-forma
-3.0% appreciation · 2.89% rent growth · sell at horizon
- IRR
- -0.8%
- Equity multiple
- 0.97×
- Total profit
- $-1,256
- Equity at exit
- $20,874
- IRR
- 8.7%
- Equity multiple
- 1.67×
- Total profit
- $26,087
- Equity at exit
- $12,105
Cash invested: $39,200 (down + closing). Projections, not guarantees.
Landlord ↔ Tenant lean methodology
- Overall (STATE)
- 87 Strongly Landlord-Friendly
- State Florida
- 87 Strongly Landlord-Friendly · R+3
- County
- — inherits STATE
- City
- — inherits STATE
ZIP-level market 32608
- Rents YoY
- 2.9%
- Active inventory
- 594
- Price-to-rent
- 6.9×
Monthly cashflow live
- Estimated rent
- $1,682 medium interval (Pro) →
- Mortgage (P&I)
- −$734
- Tax from tax record
- −$197 /mo · $2,369/yr
- Insurance
- −$58
- HOA
- −$0
- Vacancy / Maint / Mgmt
- −$353
- Net cashflow
- $339
Break-even live
UW: 25.0% down · 7.5% · 30yr · 1.5% tax · 5.0% vac · 8.0% maint · 8.0% mgmt
Financing live
Cash to close
- Down payment
- $35,000
- Closing costs
- $4,200
- Reserves months
- —
- Total cash needed
- —
Loan-product check · same deal, 3 products live
Conventional
25% down · 7.5% · 30yr
- Down + closing
- —
- Monthly P&I
- —
- Monthly cashflow
- —
- DSCR
- —
- Eligible?
- —
Personal DTI + credit; lowest rate.
DSCR
20% down · 8.5% · 30yr
- Down + closing
- —
- Monthly P&I
- —
- Monthly cashflow
- —
- DSCR
- —
- Eligible?
- —
No personal income docs; deal must DSCR.
Hard money
10% down · 12.0% · 12mo
- Down + closing
- —
- Monthly P&I
- —
- Monthly cashflow
- —
- DSCR
- —
- Eligible?
- —
Short-term bridge; refi at stabilization.
Rent comps 2 comps
| Address | Beds | Baths | Sqft | Rent | $/sqft | DOM | Units | Dist |
|---|---|---|---|---|---|---|---|---|
| 5333 SW 75th St Gainesville, FL | 2.0–3.0 | 2.0–2.5 | 1349 | $1,769 | $1.31 | 21d | 1 | 0.34mi |
| 6001 SW 75th Ter Gainesville, FL | 1.0–3.0 | 1.0–2.0 | 1119 | $1,797 | $1.61 | 13d | 17 | 0.56mi |
Listing history 21 events
-
2026-06-18days on market $140,000 Active 56 DOM
-
2026-06-17days on market $140,000 Active 55 DOM
-
2026-06-16days on market $140,000 Active 54 DOM
-
2026-06-15days on market $140,000 Active 53 DOM
-
2026-06-14days on market $140,000 Active 51 DOM
-
2026-06-13days on market $140,000 Active 50 DOM
-
2026-06-10days on market $140,000 Active 48 DOM
-
2026-06-09days on market $140,000 Active 47 DOM
-
2026-06-08days on market $140,000 Active 46 DOM
-
2026-06-07days on market $140,000 Active 45 DOM
-
2026-06-05days on market $140,000 Active 42 DOM
-
2026-06-03days on market $140,000 Active 41 DOM
-
2026-06-02days on market $140,000 Active 40 DOM
-
2026-06-01days on market $140,000 Active 39 DOM
-
2026-05-31days on market $140,000 Active 38 DOM
-
2026-05-30days on market $140,000 Active 37 DOM
-
2026-04-23$140,000 Active 191-char remark
-
2011-07-31historical
-
2009-08-06$69,000
-
1995-12-07soldstatus $41,000
-
1991-03-01soldstatus $35,000
ⓘ Source: listings_history table (triggers on properties + properties_extension) + one-shot
backfill from property_details.listing_events for pre-trigger history.
Tax reassessment forecast FL · Resets to sale price
- Current annual tax
- $2,369 · $197/mo
- Projected year-2 tax
- $2,369 · $197/mo
- Expected delta
- $0/yr ($0/mo · 0.0%)
ⓘ Screening estimate from a state-policy table — verify with the county assessor before closing.
Climate risk First Street
- Flood 1/10 Low FEMA zone X (unshaded) · 0% chance over 30 yrs
- Wildfire 4/10 Moderate
- Heat 8/10 Severe 7 d/yr ≥108°F today · 21 d/yr by 30 yrs out
- Wind 9/10 Extreme 99% chance of damaging wind over 30 yrs
- Air quality 3/10 Moderate 4 unhealthy d/yr today · 4 by 30 yrs out
Nearby sold comps map
Loading sold comps map…
Walkable amenities ~0.75 mi
Loading nearby amenities…
Taxation est. · year 1
- Rental income
- $20,183
- − Mortgage interest
- −$7,842
- − Property taxes
- −$2,369
- − Insurance
- −$700
- − Repairs & maintenance
- −$1,615
- − Management
- −$1,615
- − Depreciation
- −$4,073
- Taxable income
- $1,970
- Est. tax owed @ 24.0%
- −$473
- After-tax cash flow
- $3,593/yr
For passive investors: Depreciation is non-cash, so a rental often shows a tax loss while cash-flowing — sheltering income. Rental losses are passive: they offset passive income freely, and up to $25,000/yr can offset ordinary (W-2) income if you actively participate and your MAGI is under $100k (phasing out to $0 by $150k); unused losses carry forward. On sale, claimed depreciation is recaptured at up to 25%, and gains may owe capital-gains tax (a 1031 exchange can defer both). Figures are a year-1 estimate at your 24.0% rate — not tax advice; consult a CPA.
Schools (NCES district)
- District
- Alachua
- NCES district ID
- 1200030
- Math proficiency
- 49% ▼ -9.00%
- Reading proficiency
- 54% ▼ -3.00%
- Median HH income
- $42,683
- Composite
- 43.31/100
- National rank
- #3038
- State rank
- #30 of 73 in FL
Livability — Gainesville
- Score
- 81/100
- State rank
- #97
- US rank
- #1480
Category grades
Schools grade is shown separately in the Schools card above.
Census & demographics
- County
- Alachua County · 218,005 people
- City population
- 188,348
- Metro
- Gainesville, FL
- Population (ZIP)
- 54,566
- Household income
- $61,588
- Rent vs Own
- Severe rent burden
- 4709.0
Population outlook (Alachua County) Hauer SSP2
- Today (2025)
- 289,834 people
- By 2030
- 305,873 · +5.5%
- By 2040
- 335,246 · +15.7%
- By 2050
- 364,719 · +25.8%
- By 2075
- 436,665 · +50.7%
- By 2100
- 482,920 · +66.6%
Race, ethnicity, and origin ACS 2023
- Neighborhood character
- Diverse neighborhood (Simpson 0.64)
- Race & ethnicity
- White 55% Hispanic / Latino 16% Black 13% Asian 12% Two or more races 11%
- Hispanic origin (detail)
- Mexican 2% Puerto Rican 4% Cuban 4%
- Common ancestry
- Slovak 2% Italian 2% Romanian 2%
- Foreign-born
- 19% · Canada, China, South Korea
- Languages at home
- 75% English-only · Spanish 10% Other Indo-European 5% Chinese 3%
Political lean MEDSL · Alachua
- 2024 margin
- Strong D (+21.0) · D 59.7% · R 38.8% · Other 1.5%
- 2008→2024 swing
- -0.6pp no change · 2008: 21.6pp · 2024: 21.0pp
- All cycles
- 2024: D+21.0 2020: D+27.2 2016: D+22.5 2012: D+17.3 2008: D+21.6
Not yet ingested
- Civics
- —
Market trends
- HPI YoY
- ▼ -150.91%
- Current HPI
- 253.0629
- Rent YoY
- ▲ 2.89%
- Metro
- Gainesville, FL
- State GDP YoY
- ▲ 3.28%
- F500 in state
- 36
Industry mix (Fortune 500 HQ in FL)
| Industry | F500 HQs | Revenue |
|---|---|---|
| Industrial Technology | 2 | $29B |
|
||
| Insurance | 2 | $17B |
|
||
| Retail | 1 | $60B |
|
||
| Technology Distribution | 1 | $58B |
|
||
| Homebuilding | 1 | $35B |
|
||
| Technology Manufacturing | 1 | $35B |
|
||
Price history
+300.0% since first listed5 events — show timeline
- 2026-04-23 Listed $140,000 Stellar MLS as Distributed by MLS Grid
- 2011-07-31 Listing Removed — Stellar MLS as Distributed by MLS Grid
- 2009-08-06 Listed $69,000 Stellar MLS as Distributed by MLS Grid
- 1995-12-07 Sold (Public Records) $41,000 Public Records
- 1991-03-01 Sold (Public Records) $35,000 Public Records
Property tax history
+6.8%/yrLatest (2025): $2,369 · +5.3% YoY. Source: county tax records.
Cash-flow waterfall
monthlySold comps — $/sqft
last 12 mo · ≤1 miLoading sold comps…