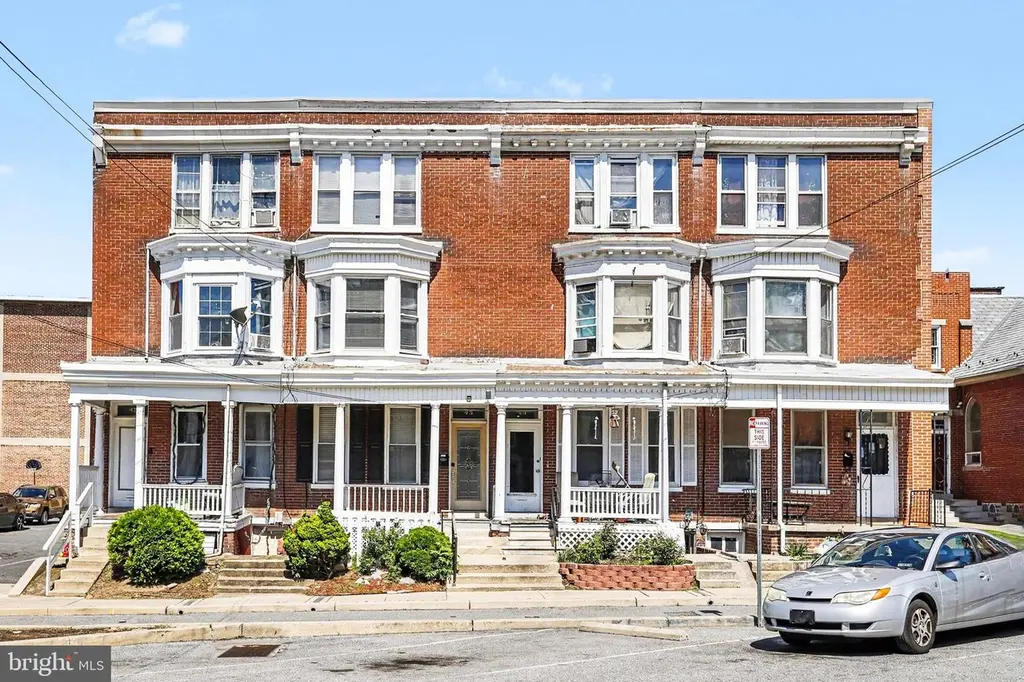
45 N Broad St · York, PA
Flood risk 9/10 · Severe
- FEMA flood zone
- X (unshaded)
- Chance of flooding over 30 yrs
- 0.99%
- Est. flood insurance / yr
- $473 – $860
Fire risk 1/10 · Minimal
- Est. fire insurance / yr
- $511 – $949
Heat risk 6/10 · Moderate
- Hot days now (above 102°F)
- 7 days/yr
- Hot days in 30 yrs
- 15 days/yr
Wind risk 4/10 · Minor
- Chance of severe wind over 30 yrs
- 10.0%
Air-quality risk 3/10 · Minor
- Unhealthy air days now
- 3 days/yr
- Unhealthy air days in 30 yrs
- 5 days/yr
Risk factors via First Street. Map © Google.
Why this score? — see what drove the B- grade
The composite is a weighted blend of 9 inputs, each scored 0–100. Each bar is that input's sub-score; the figure is the points it added to the 100-point composite (weight × sub-score).
- Cash flow +25.8/30.0
- ARV discount +15.0/15.0
- DSCR +8.6/10.0
- 1% rule +7.5/10.0
- Livability +3.8/5.0
- Rent growth +3.6/5.0
- Condition / age +2.5/5.0
- Schools +0.8/10.0
- Appreciation +0.0/10.0
$139,900
🖨 Deal sheet (PDF) 📄 Offer letter ✓ Due diligence
Listing remarks MLS
Large updated townhome with 5 bedrooms and 1.5 bathrooms. Located right down the street from elementary school. This home boast new roof, gutters, siding, front porch, exterior doors, privacy fence, balcony, windows, paint, weatherproofed house and lots more. Move in ready and extremely updated house with remodeled kitchen and bathrooms. See attached document for a list of work done on this home.
Key facts
- Large living area
- Full upstairs bath
- Minutes from parks
Tags
Property features AI
Exterior
- Parking: On-street parking; Off-street parking
- Utilities: Public water; Public sewer; Natural gas hot water
- Home design: Interior townhouse/rowhouse; Fee simple ownership; Estimated year built; Above-grade finished living area (estimated)
- Construction: Stick built with brick exterior; Foundation: Other; Other structures above and below grade; Basement: Walkout level, partial, exterior entrance, interior access
- Exterior features: Privacy fencing; Level, cleared lot; Not in a federal flood zone
Interior
- Kitchen: Dishwasher; Microwave; Refrigerator; Stainless steel appliances; Gas oven/range; Breakfast area; Pantry
- Bedrooms: 5 bedrooms on the first upper level; Rooms include: Living Room, Dining Room, Family Room, Foyer, Kitchen, Bedroom 1, Bedroom 2, Bedroom 3, Bedroom 4, Bedroom 5
- Flooring: Hardwood; Carpet; Wood floors
- Bathrooms: 1 full bathroom (all upper levels); 1 full bathroom on the first upper level; 1 half bathroom on the main level; Total: 1 full, 1 half
- Heating & cooling: Forced air heating; Natural gas heating fuel; Window cooling units (electric)
- Interior features: Breakfast area; Built-ins; Ceiling fan(s); Dining area; Formal separate dining room; Pantry; Recessed lighting; Walk-in closet(s); Wood floors
- Laundry & utility: Washer; Dryer
Neighborhood map
What this means for you Summary
Snapshot
- This is a 5-bed/1.5-bath townhouse listed at $140k.
Deal economics
- At list price, monthly cash flow is $283 ($3k/yr) — positive.
- The deal already cash-flows at list — no discount required.
- Meets the 1% rule at list price ($2k rent vs $140k).
- Cap rate 9.2% vs local median 5.0% in York — top-decile yield for the area; either an underpriced asset or a hidden risk that comps aren't pricing in. Stress-test before assuming the spread holds.
Location & tenants
- Location reads 75/100 on livability (#427 in PA, #3,987 nationally) — a middle-class / working-renter tenant base. Strengths: cost of living A+, health & safety A+, housing A; Watch: amenities D+, crime F, employment F.
- York City SD (urban): math 4% / reading 16% proficiency, ranked #534 of 539 in PA (top 99%) — low school quality limits family demand, transient renter base, plan for 1-2y turnover; 72% free/reduced lunch — lower-income household profile, screen leases tightly.
- Market conditions: Rents rising fast (+4.4%/yr); 213 active listings in the ZIP; 9 comparable units currently listed for rent nearby; rentals at typical pace (median 22d on market — plan ~3-4 weeks tenant-placement turnaround); solid renter incomes; 1,328 units permitted in York County in 2024 (338 in 5+ unit buildings).
Forward outlook
- Local home prices are declining (-3.0%/yr); year-one equity from $967 of loan paydown is wiped out by about $4k of value loss. Plan a longer hold.
- At projected returns (-3.0% appreciation + 4.4% rent growth), your $39k cash investment doubles in ~10 years — after that, you're playing with house money.
Negotiation context
- Only 3 days on market — expect competitive offers; lowballing is unlikely to land.
- 7 sale attempts since 27y ago with the ask held roughly flat each time — persistent listings suggest the price (not the market) is what's stuck; bring a comps-based counter.
Risks & watch-outs
- Watch-outs: flood insurance adds $56/mo; built in 1900 — expect roof / HVAC / electrical / plumbing capex.
- Climate carrying-cost: severe flood risk; extreme-heat days projected 7→15/yr by 2055 (HVAC capex compounding) — expect insurance premiums to compound above CPI over the hold.
Questions for the listing agent
- Built in 1900 — when were the roof, HVAC, electrical panel, plumbing, and water heater last replaced?
- What's the actual annual flood-insurance premium (NFIP or private), and is the property in a SFHA with mandatory coverage?
- Is there a deadline driving the sale (1031 exchange, divorce, estate, relocation)? That informs how much negotiation room exists.
- Crime grade is F in this area — have there been break-ins, vandalism, or insurance claims at this property in the last 3 years? What carrier currently insures it and at what premium?
- What's the average days-on-market for RENTAL listings here right now (not sales)? A rising rental-DOM trend means longer vacancies and softer asking-rent achievability than the comps imply.
- What's the recent tenant-quality profile in this submarket — average credit score on applications, eviction rate, late-payment / NSF rate, and stable-employment percentage? A property-management company in the area should have these aggregated.
- How much new for-sale + rental construction is in the pipeline within 1–3 miles? Heavy new supply typically softens prices + rents 12–24 months out; constrained supply supports both.
Investment metrics
- 1% rule
- 1.25% ✓
- Cap rate
- 9.20%
- Cash-on-cash
- 10.37%
- DSCR
- 1.46
- GRM
- 6.7
CMA / ARV
- ARV (on-the-fly)
- $190,896
- Comps found
- 12
Show comp detail 12 sales within ~0.75 mi
| Address | Dist | Beds/Ba | Sqft | Sold | Price | $/sf | Match |
|---|---|---|---|---|---|---|---|
| 117 S Pine St | 0.27mi | 5/1.0 | 2,040 (+4%) | 2mo | $174,000 | $85 | 78 |
| 442 E Prospect St | 0.41mi | 5/1.5 | 1,926 (-2%) | 0mo | $189,000 | $98 | 77 |
| 830 E Philadelphia St | 0.50mi | 5/1.0 | 1,924 (-2%) | 2mo | $150,000 | $78 | 69 |
| 802 Chestnut St | 0.44mi | 5/1.0 | 1,860 (-6%) | 1mo | $145,000 | $78 | 68 |
| 41 W Philadelphia St | 0.58mi | 5/2.0 | 1,992 (+1%) | 3mo | $300,000 | $151 | 67 |
| 350 E Poplar St | 0.26mi | 5/1.0 | 1,740 (-12%) | 2mo | $125,000 | $72 | 65 |
| 628 Chestnut St | 0.30mi | 5/2.0 | 1,740 (-12%) | 3mo | $153,500 | $88 | 62 |
| 249 E Princess St | 0.34mi | 4/1.5 (-1) | 1,741 (-12%) | 0mo | $189,900 | $109 | 60 |
| 345 E Princess St | 0.29mi | 4/1.0 (-1) | 1,696 (-14%) | 3mo | $145,000 | $85 | 54 |
| 23 N Albemarle St | 0.67mi | 5/1.0 | 1,836 (-7%) | 3mo | $182,000 | $99 | 53 |
| 702 York St | 0.41mi | 4/1.0 (-1) | 1,696 (-14%) | 1mo | $165,000 | $97 | 50 |
| 707 York St | 0.42mi | 4/1.0 (-1) | 1,696 (-14%) | 1mo | $165,000 | $97 | 49 |
Match score weights: distance 35% · size 25% · config 20% · recency 20%. Top-matched comps best support the ARV.
Projected returns pro-forma
-3.0% appreciation · 4.43% rent growth · sell at horizon
- IRR
- -1.3%
- Equity multiple
- 0.95×
- Total profit
- $-1,991
- Equity at exit
- $20,860
- IRR
- 10.0%
- Equity multiple
- 1.83×
- Total profit
- $32,673
- Equity at exit
- $12,096
Cash invested: $39,172 (down + closing). Projections, not guarantees.
Landlord ↔ Tenant lean methodology
- Overall (STATE)
- 62 Landlord-Friendly
- State Pennsylvania
- 62 Landlord-Friendly · EVEN
- County
- — inherits STATE
- City
- — inherits STATE
ZIP-level market 17403
- Home prices YoY
- -26.9%
- Rents YoY
- 4.4%
- Active inventory
- 213
- Price-to-rent
- 6.7×
Monthly cashflow live
- Estimated rent
- $1,746 high interval (Pro) →
- Mortgage (P&I)
- −$734
- Tax from tax record
- −$249 /mo · $2,989/yr
- Insurance
- −$58
- Flood insurance flood zone
- −$56 /mo · $666/yr
- HOA
- −$0
- Vacancy / Maint / Mgmt
- −$367
- Net cashflow
- $283
Break-even live
Sensitivity live
| Price | -10% $362 | -5% $323 | +0% $283 | +5% $243 | +10% $204 |
|---|---|---|---|---|---|
| Rent | -10% $145 | -5% $214 | +0% $283 | +5% $352 | +10% $421 |
| Rate | -1.0pp $353 | -0.5pp $319 | base $283 | +0.5pp $247 | +1.0pp $210 |
UW: 25.0% down · 7.5% · 30yr · 1.5% tax · 5.0% vac · 8.0% maint · 8.0% mgmt
Financing live
Cash to close
- Down payment
- $34,975
- Closing costs
- $4,197
- Reserves months
- —
- Total cash needed
- —
Loan-product check · same deal, 3 products live
Conventional
25% down · 7.5% · 30yr
- Down + closing
- —
- Monthly P&I
- —
- Monthly cashflow
- —
- DSCR
- —
- Eligible?
- —
Personal DTI + credit; lowest rate.
DSCR
20% down · 8.5% · 30yr
- Down + closing
- —
- Monthly P&I
- —
- Monthly cashflow
- —
- DSCR
- —
- Eligible?
- —
No personal income docs; deal must DSCR.
Hard money
10% down · 12.0% · 12mo
- Down + closing
- —
- Monthly P&I
- —
- Monthly cashflow
- —
- DSCR
- —
- Eligible?
- —
Short-term bridge; refi at stabilization.
Rent comps 9 comps
| Address | Beds | Baths | Sqft | Rent | $/sqft | DOM | Units | Dist |
|---|---|---|---|---|---|---|---|---|
| 339 E Market St Unit 1 York, PA | 4.0 | 1.5 | 1600 | $1,650 | $1.03 | 21d | 1 | 0.12mi |
| 631 Wallace St Unit 631 York, PA | 4.0 | 1.0 | 1545 | $1,325 | $0.86 | 14d | 1 | 0.28mi |
| 720 Chestnut St Apt 2 York, PA | 4.0 | 1.0 | 1400 | $1,300 | $0.93 | 14d | 1 | 0.40mi |
| 289 Union St York, PA | 4.0 | 1.0 | 1450 | $1,600 | $1.10 | 44d | 1 | 0.93mi |
| 330 Smyser St York, PA | 5.0 | 1.0 | 1634 | $1,425 | $0.87 | 44d | 1 | 0.98mi |
| 213 Kurtz Ave York, PA | 5.0 | 1.0 | 1921 | $1,850 | $0.96 | 14d | 1 | 0.99mi |
| 119 W Jackson St York, PA | 4.0 | 1.0 | 1800 | $1,395 | $0.78 | 44d | 1 | 1.04mi |
| 26 N West St York, PA | 6.0 | 2.0 | 2100 | $2,200 | $1.05 | 21d | 1 | 1.41mi |
| 132 N West St York, PA | 4.0 | 1.0 | 1560 | $1,600 | $1.03 | 14d | 1 | 1.42mi |
Listing history 26 events
-
2026-05-15status Pending
-
2026-05-12$139,900 Active
-
2025-01-29status Pending
-
2025-01-29historical
-
2025-01-25$135,000 Active
-
2021-10-25soldstatus $135,000
-
2021-10-19soldstatus $140,000 Closed 399-char remark
Show marketing remark (399 chars)
Large updated townhome with 5 bedrooms and 1.5 bathrooms. Located right down the street from elementary school. This home boast new roof, gutters, siding, front porch, exterior doors, privacy fence, balcony, windows, paint, weatherproofed house and lots more. Move in ready and extremely updated house with remodeled kitchen and bathrooms. See attached document for a list of work done on this home.
-
2021-09-15status Pending 399-char remark
Show marketing remark (399 chars)
Large updated townhome with 5 bedrooms and 1.5 bathrooms. Located right down the street from elementary school. This home boast new roof, gutters, siding, front porch, exterior doors, privacy fence, balcony, windows, paint, weatherproofed house and lots more. Move in ready and extremely updated house with remodeled kitchen and bathrooms. See attached document for a list of work done on this home.
-
2021-09-01$135,000 Active 399-char remark
Show marketing remark (399 chars)
Large updated townhome with 5 bedrooms and 1.5 bathrooms. Located right down the street from elementary school. This home boast new roof, gutters, siding, front porch, exterior doors, privacy fence, balcony, windows, paint, weatherproofed house and lots more. Move in ready and extremely updated house with remodeled kitchen and bathrooms. See attached document for a list of work done on this home.
-
2016-09-28soldstatus $18,000
-
2011-11-11soldstatus $16,000
-
2011-10-22historical
-
2011-08-25$32,000
-
2006-06-07soldstatus $25,000
-
2006-06-06soldstatus $25,000
-
2006-04-10historical
-
2006-03-31$27,000
-
2000-09-06soldstatus $40,000
-
2000-08-30soldstatus $40,000
-
2000-08-11historical
-
2000-06-23$44,900
-
2000-04-04soldstatus $25,000
-
2000-03-30soldstatus $25,000
-
2000-03-10historical
-
1999-11-04$25,000
-
1987-08-01soldstatus $34,000
ⓘ Source: listings_history table (triggers on properties + properties_extension) + one-shot
backfill from property_details.listing_events for pre-trigger history.
Tax reassessment forecast PA · Partial reset (capped growth)
- Current annual tax
- $2,989 · $249/mo
- Projected year-2 tax
- $2,989 · $249/mo
- Expected delta
- $0/yr ($0/mo · 0.0%)
ⓘ Screening estimate from a state-policy table — verify with the county assessor before closing.
Climate risk First Street
- Flood 9/10 Extreme FEMA zone X (unshaded) · 99% chance over 30 yrs
- Wildfire 1/10 Low
- Heat 6/10 Major 7 d/yr ≥102°F today · 15 d/yr by 30 yrs out
- Wind 4/10 Moderate 10% chance of damaging wind over 30 yrs
- Air quality 3/10 Moderate 3 unhealthy d/yr today · 5 by 30 yrs out
Nearby sold comps map
Loading sold comps map…
Walkable amenities ~0.75 mi
Loading nearby amenities…
Taxation est. · year 1
- Rental income
- $20,955
- − Mortgage interest
- −$7,837
- − Property taxes
- −$2,989
- − Insurance
- −$1,366
- − Repairs & maintenance
- −$1,676
- − Management
- −$1,676
- − Depreciation
- −$4,070
- Taxable income
- $1,341
- Est. tax owed @ 24.0%
- −$322
- After-tax cash flow
- $3,074/yr
For passive investors: Depreciation is non-cash, so a rental often shows a tax loss while cash-flowing — sheltering income. Rental losses are passive: they offset passive income freely, and up to $25,000/yr can offset ordinary (W-2) income if you actively participate and your MAGI is under $100k (phasing out to $0 by $150k); unused losses carry forward. On sale, claimed depreciation is recaptured at up to 25%, and gains may owe capital-gains tax (a 1031 exchange can defer both). Figures are a year-1 estimate at your 24.0% rate — not tax advice; consult a CPA.
Schools (NCES district)
- District
- York City SD
- NCES district ID
- 4226820
- Math proficiency
- 4% ▼ -7.00%
- Reading proficiency
- 16% ▼ -9.00%
- Median HH income
- $29,470
- Composite
- 7.61/100
- National rank
- #9943
- State rank
- #534 of 539 in PA
Livability — York
- Score
- 75/100
- State rank
- #427
- US rank
- #3987
Category grades
Schools grade is shown separately in the Schools card above.
Census & demographics
- Census place
- York, PA
- County
- York County · 278,806 people
- City population
- 184,764
- Metro
- York-Hanover, PA
- Population (ZIP)
- 40,287
- Household income
- $75,384
- Rent vs Own
- Severe rent burden
- 1305.0
Population outlook (York County) Hauer SSP2
- Today (2025)
- 454,205 people
- By 2030
- 457,407 · +0.7%
- By 2040
- 457,529 · +0.7%
- By 2050
- 448,261 · -1.3%
- By 2075
- 427,388 · -5.9%
- By 2100
- 384,218 · -15.4%
Race, ethnicity, and origin ACS 2023
- Neighborhood character
- Diverse neighborhood (Simpson 0.58)
- Race & ethnicity
- White 60% Hispanic / Latino 20% Black 12% Two or more races 9% Asian 3%
- Hispanic origin (detail)
- Mexican 3% Puerto Rican 10% Dominican 3%
- Common ancestry
- Romanian 3% Lithuanian 1% Slovak 1%
- Foreign-born
- 10% · Canada, Vietnam, Jamaica
- Languages at home
- 81% English-only · Spanish 14% Other Indo-European 1% Arabic 1%
Political lean MEDSL · York
- 2024 margin
- Strong R (+25.3) · D 36.9% · R 62.1%
- 2008→2024 swing
- -11.7pp toward R · 2008: -13.6pp · 2024: -25.3pp
- All cycles
- 2024: R+25.3 2020: R+24.6 2016: R+29.3 2012: R+21.2 2008: R+13.6
Not yet ingested
- Civics
- —
Market trends
- HPI YoY
- ▼ -104.51%
- Current HPI
- 284.0731
- Rent YoY
- ▲ 4.43%
- Metro
- York-Hanover, PA
- State GDP YoY
- ▲ 1.68%
- F500 in state
- 34
Industry mix (Fortune 500 HQ in PA)
| Industry | F500 HQs | Revenue |
|---|---|---|
| Healthcare | 2 | $309B |
|
||
| Insurance | 2 | $27B |
|
||
| Telecommunications / Media | 1 | $124B |
|
||
| Industrial Distribution | 1 | $22B |
|
||
| Financial Services | 1 | $20B |
|
||
| Chemicals / Materials | 1 | $18B |
|
||
Price history
+311.5% since first listed26 events — show timeline
- 2026-05-15 Pending — BRIGHT MLS
- 2026-05-12 Listed $139,900 BRIGHT MLS
- 2025-01-29 Pending — BRIGHT MLS
- 2025-01-29 Listing Removed — BRIGHT MLS
- 2025-01-25 Listed $135,000 BRIGHT MLS
- 2021-10-25 Sold (Public Records) $135,000 Public Records
- 2021-10-19 Sold (MLS) $140,000 BRIGHT MLS
- 2021-09-15 Pending — BRIGHT MLS
- 2021-09-01 Listed $135,000 BRIGHT MLS
- 2016-09-28 Sold (Public Records) $18,000 Public Records
- 2011-11-11 Sold (MLS) $16,000 BRIGHT MLS
- 2011-10-22 Listing Removed — BRIGHT MLS
- 2011-08-25 Listed $32,000 BRIGHT MLS
- 2006-06-07 Sold (Public Records) $25,000 Public Records
- 2006-06-06 Sold (MLS) $25,000 BRIGHT MLS
- 2006-04-10 Listing Removed — BRIGHT MLS
- 2006-03-31 Listed $27,000 BRIGHT MLS
- 2000-09-06 Sold (Public Records) $40,000 Public Records
- 2000-08-30 Sold (MLS) $40,000 BRIGHT MLS
- 2000-08-11 Listing Removed — BRIGHT MLS
- 2000-06-23 Listed $44,900 BRIGHT MLS
- 2000-04-04 Sold (Public Records) $25,000 Public Records
- 2000-03-30 Sold (MLS) $25,000 BRIGHT MLS
- 2000-03-10 Listing Removed — BRIGHT MLS
- 1999-11-04 Listed $25,000 BRIGHT MLS
- 1987-08-01 Sold (Public Records) $34,000 Public Records
Property tax history
+0.7%/yrLatest (2025): $2,989 · +0.9% YoY. Source: county tax records.
Cash-flow waterfall
monthlySold comps — $/sqft
last 12 mo · ≤1 miLoading sold comps…