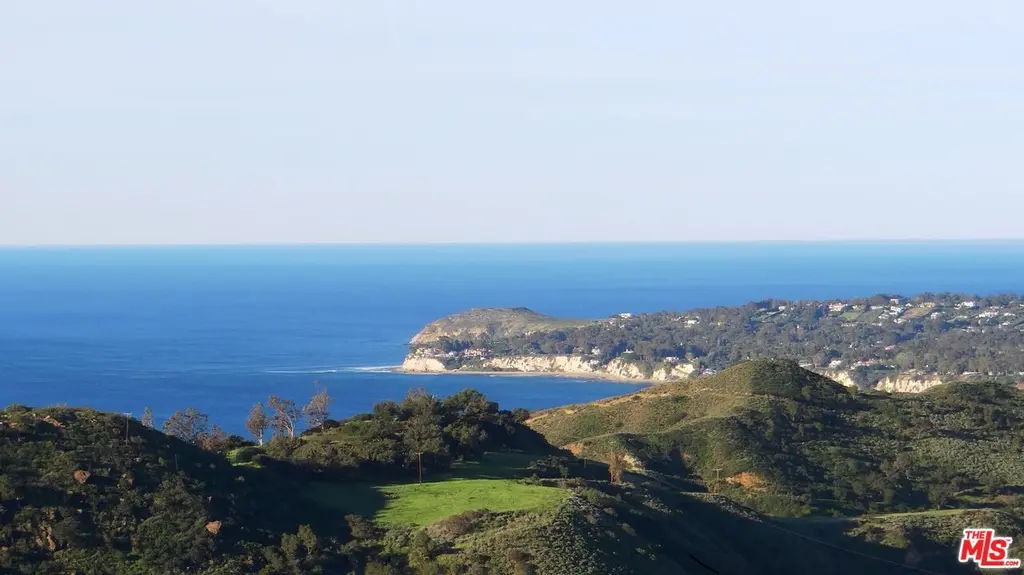
2965 Seabreeze Dr · Malibu, CA
Flood risk 1/10 · Minimal
- FEMA flood zone
- X (unshaded)
- Chance of flooding over 30 yrs
- 0.0%
- Est. flood insurance / yr
- $507 – $1,088
Fire risk 5/10 · Moderate
- Est. fire insurance / yr
- $659 – $1,223
Heat risk 4/10 · Minor
- Hot days now (above 83°F)
- 7 days/yr
- Hot days in 30 yrs
- 20 days/yr
Wind risk 1/10 · Minimal
- Chance of severe wind over 30 yrs
- —
Air-quality risk 5/10 · Moderate
- Unhealthy air days now
- 6 days/yr
- Unhealthy air days in 30 yrs
- 8 days/yr
Risk factors via First Street. Map © Google.
Why this score? — see what drove the D+ grade
The composite is a weighted blend of 9 inputs, each scored 0–100. Each bar is that input's sub-score; the figure is the points it added to the 100-point composite (weight × sub-score).
- ARV discount +14.4/15.0
- Cash flow +9.5/30.0
- Schools +6.2/10.0
- Appreciation +5.3/10.0
- DSCR +2.7/10.0
- Livability +2.7/5.0
- Condition / age +2.5/5.0
- 1% rule +1.7/10.0
- Rent growth +1.7/5.0
$1,695,000
🖨 Deal sheet (PDF) 📄 Offer letter ✓ Due diligence
Listing remarks
Panoramic Ocean Views!! Experience iconic California coastal living in this dramatic Malibu whitewater ocean-view residence, offering sweeping unobstructed vistas of the Pacific Ocean and surrounding canyons from nearly every room. Welcome to "Casa de la Nueva Vida", a stunning coastal retreat perched above the Pacific, where breathtaking sunsets, refreshing ocean breezes, and a seamless indoor-outdoor lifestyle define everyday living in one of Malibu's most sought-after neighborhoods. This light-filled, open-concept home is thoughtfully designed for both relaxed living and elegant entertainment. The spacious, updated kitchen offers a center island, bar seating, and abundant stora
Key facts
- Expansive windows
- Updated kitchen
- Granite countertops
Tags
Property features AI
Finance
- Other: Property is fee land; Located in a coastal commission special zoning area
- HOA & community: No HOA amenities
Exterior
- Parking: Total of 5 parking spaces; 2 covered spaces; 2 carport spaces (detached carport); 3 additional open spaces; Driveway; Assigned parking; Built-in storage
- Security: Gated community / gated entry; Other security features
- Utilities: Septic system; Water available in street
- Home design: Detached single-family residence; Multi-level home (three or more levels); Faces south; Entry at first floor; Gated
- Construction: Stucco exterior
- Exterior features: Decks and attached living room deck; Covered porch; Patio home / hillside / canyon lot location; Back yard; Street paved; Fenced yard; Chain link fence; Sprinkler system; Panoramic coastline, ocean, white water, water, canyon and mountain views
Interior
- Kitchen: Electric cooking; Double oven; Microwave; Range/oven; Hood fan; Kitchen island; Dishwasher; Garbage disposal; Built-in refrigerator/freezer and ice maker (appliances included)
- Bedrooms: All bedrooms on the ground floor; Walk-in closet
- Flooring: Ceramic tile; Laminate; Mixed flooring types
- Bathrooms: Two full bathrooms (remodeled) with shower and tub
- Heating & cooling: Central electric heat; A/C
- Interior features: Main-level entry; Window blinds; Sliding glass doors; Living room fireplace
- Laundry & utility: Indoor laundry room with washer and dryer; Freezer included
Neighborhood map
What this means for you Summary
Snapshot
- This is a 3-bed/3.0-bath single-family listed at $1.70M.
Deal economics
- At list price, monthly cash flow is $-1k ($-14k/yr) — negative.
- To cash-flow at today's rent, offer at most $1.49M (12.4% below list).
- To meet the 1% rule (rent ≥ 1% of price), the offer needs to be $1.14M (32.9% below list).
- Recommended offer: $1.14M (32.9% below list) — sets the bar for 1% rule.
- Cap rate 5.5% vs local median 0.8% in Malibu — top-decile yield for the area; either an underpriced asset or a hidden risk that comps aren't pricing in. Stress-test before assuming the spread holds.
Location & tenants
- Location reads 53/100 on livability (#979 in CA) — a working-class tenant base; expect higher turnover. Strengths: employment A+, schools B; Watch: housing C-, crime F, amenities F.
- Santa Monica-Malibu Unified (urban): math 61% / reading 74% proficiency, ranked #123 of 1,400 in CA (top 9%) — acceptable for families but not a draw, mixed tenant base, ~2y average lease.
- Market conditions: Rents falling (-3.4%/yr); 636 active listings in the ZIP; 7 comparable units currently listed for rent nearby; rentals lingering (median 45d on market — plan ~5-8 weeks vacancy on turnover, expect pricing pressure); 57% of comp listings sitting > 30 days — soft ceiling on asking rent; high-income renter base; 19,697 units permitted in Los Angeles County in 2024 (9,426 in 5+ unit buildings).
- At $11,376/mo this rent would consume 69% of the median local household income ($197k/yr) (locally 420% of renters already pay >50% of income on rent) — very limited rent-growth headroom before tenants either downsize or default.
Forward outlook
- In year one you build about $22k of equity ($12k loan paydown + $10k appreciation (0.6% local appreciation)).
- Los Angeles County population projected at +9% by 2050 — modest demand growth; plan on rents tracking national, not racing it.
- By year 5, paydown + projected appreciation supports a ~$108k cash-out refi (75% LTV) — recoverable capital for the next deal without selling this one.
Negotiation context
- It's been on market 26 days — a 2% lower offer ($1.67M) is reasonable based on typical stale-listing flexibility.
- 4 sale attempts since 3y ago with the ask held roughly flat each time — persistent listings suggest the price (not the market) is what's stuck; bring a comps-based counter.
- Current owner paid $240k; list at $1.70M implies a 606% gain — meaningful room to come down on a strong offer.
Risks & watch-outs
- Climate carrying-cost: moderate wildfire risk — expect insurance premiums to compound above CPI over the hold.
Questions for the listing agent
- What do current leases actually rent for vs. the listed asking? Can we see a recent rent roll and the last 12 months of T-12 income?
- Built in 1979 — when were the roof, HVAC, electrical panel, plumbing, and water heater last replaced?
- Is there a deadline driving the sale (1031 exchange, divorce, estate, relocation)? That informs how much negotiation room exists.
- Schools are B-rated — typically a magnet for longer-tenancy family renters. What's the average tenant stay here, and is there a school-zone premium baked into asking?
- Crime grade is F in this area — have there been break-ins, vandalism, or insurance claims at this property in the last 3 years? What carrier currently insures it and at what premium?
- The area grade is low — what's the realistic commute time and amenity access for the typical tenant pool here? Any planned neighborhood developments (good or bad) we should know about?
- What's the average days-on-market for RENTAL listings here right now (not sales)? A rising rental-DOM trend means longer vacancies and softer asking-rent achievability than the comps imply.
- What's the recent tenant-quality profile in this submarket — average credit score on applications, eviction rate, late-payment / NSF rate, and stable-employment percentage? A property-management company in the area should have these aggregated.
- How much new for-sale + rental construction is in the pipeline within 1–3 miles? Heavy new supply typically softens prices + rents 12–24 months out; constrained supply supports both.
Investment metrics
- 1% rule
- 0.67% ✗
- Cap rate
- 5.45%
- Cash-on-cash
- -3.00%
- DSCR
- 0.87
- GRM
- 12.4
CMA / ARV
- ARV (on-the-fly)
- $2,003,994
- Comps found
- 2
Show comp detail 2 sales within ~0.75 mi
| Address | Dist | Beds/Ba | Sqft | Sold | Price | $/sf | Match |
|---|---|---|---|---|---|---|---|
| 2909 Searidge St | 0.08mi | 3/2.0 | 1,800 (-10%) | 3mo | $1,255,000 | $697 | 74 |
| 2903 Valmere Dr | 0.14mi | 3/2.0 | 1,804 (-10%) | 17mo | $1,810,000 | $1,003 | 59 |
Match score weights: distance 35% · size 25% · config 20% · recency 20%. Top-matched comps best support the ARV.
Projected returns pro-forma
0.62% appreciation · 0.0% rent growth · sell at horizon
- IRR
- -4.8%
- Equity multiple
- 0.77×
- Total profit
- $-109,504
- Equity at exit
- $545,194
- IRR
- -0.8%
- Equity multiple
- 0.91×
- Total profit
- $-44,544
- Equity at exit
- $699,313
Cash invested: $474,600 (down + closing). Projections, not guarantees.
Landlord ↔ Tenant lean methodology
- Overall (STATE)
- 18 Strongly Tenant-Friendly
- State California
- 18 Strongly Tenant-Friendly · D+13
- County
- — inherits STATE
- City
- — inherits STATE
ZIP-level market 90265
- Home prices YoY
- 0.1%
- Rents YoY
- -3.4%
- Active inventory
- 636
- Price-to-rent
- 12.4×
Monthly cashflow live
- Estimated rent
- $11,376 medium interval (Pro) →
- Mortgage (P&I)
- −$8,889
- Tax from tax record
- −$580 /mo · $6,960/yr
- Insurance
- −$706
- HOA
- −$0
- Vacancy / Maint / Mgmt
- −$2,389
- Net cashflow
- $-1,188
Break-even live
Sensitivity live
| Price | -10% $-228 | -5% $-708 | +0% $-1,188 | +5% $-1,667 | +10% $-2,147 |
|---|---|---|---|---|---|
| Rent | -10% $-2,086 | -5% $-1,637 | +0% $-1,188 | +5% $-738 | +10% $-289 |
| Rate | -1.0pp $-334 | -0.5pp $-757 | base $-1,188 | +0.5pp $-1,627 | +1.0pp $-2,074 |
UW: 25.0% down · 7.5% · 30yr · 1.5% tax · 5.0% vac · 8.0% maint · 8.0% mgmt
Financing live
Cash to close
- Down payment
- $423,750
- Closing costs
- $50,850
- Reserves months
- —
- Total cash needed
- —
Loan-product check · same deal, 3 products live
Conventional
25% down · 7.5% · 30yr
- Down + closing
- —
- Monthly P&I
- —
- Monthly cashflow
- —
- DSCR
- —
- Eligible?
- —
Personal DTI + credit; lowest rate.
DSCR
20% down · 8.5% · 30yr
- Down + closing
- —
- Monthly P&I
- —
- Monthly cashflow
- —
- DSCR
- —
- Eligible?
- —
No personal income docs; deal must DSCR.
Hard money
10% down · 12.0% · 12mo
- Down + closing
- —
- Monthly P&I
- —
- Monthly cashflow
- —
- DSCR
- —
- Eligible?
- —
Short-term bridge; refi at stabilization.
Rent comps 7 comps
| Address | Beds | Baths | Sqft | Rent | $/sqft | DOM | Units | Dist |
|---|---|---|---|---|---|---|---|---|
| 26044 Pacific Coast Hwy Malibu, CA | 4.0 | 4.0 | 2389 | $27,500 | $11.51 | 45d | 1 | 0.72mi |
| 3775 Puerco Canyon Rd Malibu, CA | 2.0 | 2.0 | 1610 | $15,000 | $9.32 | 25d | 1 | 1.08mi |
| 25216 Malibu Rd Malibu, CA | 2.0 | 2.0 | 2000 | $18,500 | $9.25 | 45d | 1 | 1.18mi |
| 26237 Fairside Rd Malibu, CA | 4.0 | 4.0 | 2082 | $13,000 | $6.24 | 18d | 1 | 1.26mi |
| 26863 Via Linda St Malibu, CA | 3.0 | 2.0 | 2112 | $10,000 | $4.73 | 25d | 1 | 1.31mi |
| 26349 Fairside Rd Malibu, CA | 3.0 | 3.0 | 1876 | $7,500 | $4.00 | 45d | 1 | 1.32mi |
| 24942 Malibu Rd Malibu, CA | 4.0 | 3.0 | 1600 | $35,000 | $21.88 | 45d | 1 | 1.45mi |
Listing history 24 events
-
2026-06-21days on market $1,695,000 Active 26 DOM
-
2026-06-18days on market $1,695,000 Active 23 DOM
-
2026-06-17days on market $1,695,000 Active 22 DOM
-
2026-06-16days on market $1,695,000 Active 21 DOM
-
2026-06-15days on market $1,695,000 Active 20 DOM
-
2026-06-13days on market $1,695,000 Active 18 DOM
-
2026-06-13days on market $1,695,000 Active 17 DOM
-
2026-06-09days on market $1,695,000 Active 14 DOM
-
2026-06-08days on market $1,695,000 Active 13 DOM
-
2026-06-07days on market $1,695,000 Active 12 DOM
-
2026-06-04days on market $1,695,000 Active 9 DOM
-
2026-06-03days on market $1,695,000 Active 8 DOM
-
2026-06-02days on market $1,695,000 Active 7 DOM
-
2026-06-01days on market $1,695,000 Active 6 DOM
-
2026-05-31days on market $1,695,000 Active 5 DOM
-
2026-05-15price $1,695,000 2362-char remark
-
2026-05-11status Active 2362-char remark
-
2026-04-14$1,875,000 Active 2362-char remark
-
2024-05-20historical $7,000
-
2024-03-04price $7,000
-
2024-02-19price $11,000
-
2024-01-03price $7,000
-
2023-12-19$8,000
-
1985-08-06soldstatus $240,000
ⓘ Source: listings_history table (triggers on properties + properties_extension) + one-shot
backfill from property_details.listing_events for pre-trigger history.
Tax reassessment forecast CA · Resets to sale price
- Current annual tax
- $6,960 · $580/mo
- Projected year-2 tax
- $12,882 · $1,074/mo
- Expected delta
- +$5,922/yr (+$493/mo · 85.1%)
ⓘ Screening estimate from a state-policy table — verify with the county assessor before closing.
Climate risk First Street
- Flood 1/10 Low FEMA zone X (unshaded) · 0% chance over 30 yrs
- Wildfire 5/10 Major
- Heat 4/10 Moderate 7 d/yr ≥83°F today · 20 d/yr by 30 yrs out
- Wind 1/10 Low
- Air quality 5/10 Major 6 unhealthy d/yr today · 8 by 30 yrs out
Nearby sold comps map
Loading sold comps map…
Walkable amenities ~0.75 mi
Loading nearby amenities…
Taxation est. · year 1
- Rental income
- $136,517
- − Mortgage interest
- −$94,946
- − Property taxes
- −$6,960
- − Insurance
- −$8,475
- − Repairs & maintenance
- −$10,921
- − Management
- −$10,921
- − Depreciation
- −$49,309
- Taxable loss
- −$45,017
- Est. tax savings @ 24.0%
- +$10,804
- After-tax cash flow
- $-3,448/yr
For passive investors: Depreciation is non-cash, so a rental often shows a tax loss while cash-flowing — sheltering income. Rental losses are passive: they offset passive income freely, and up to $25,000/yr can offset ordinary (W-2) income if you actively participate and your MAGI is under $100k (phasing out to $0 by $150k); unused losses carry forward. On sale, claimed depreciation is recaptured at up to 25%, and gains may owe capital-gains tax (a 1031 exchange can defer both). Figures are a year-1 estimate at your 24.0% rate — not tax advice; consult a CPA.
Schools (NCES district)
- District
- Santa Monica-Malibu Unified
- NCES district ID
- 0635700
- Math proficiency
- 61% ▬ 0.00%
- Reading proficiency
- 74% ▬ 0.00%
- Median HH income
- $81,489
- Composite
- 61.58/100
- National rank
- #1535
- State rank
- #123 of 1400 in CA
Livability — Malibu
- Score
- 53/100
- State rank
- #979
- US rank
- #24630
Category grades
Schools grade is shown separately in the Schools card above.
Census & demographics
- County
- Los Angeles County · 9,444,647 people
- City population
- 15,918
- Metro
- Los Angeles-Long Beach-Anaheim, CA
- Population (ZIP)
- 15,918
- Household income
- $196,742
- Rent vs Own
- Severe rent burden
- 420.0
Population outlook (Los Angeles County) Hauer SSP2
- Today (2025)
- 10,940,515 people
- By 2030
- 11,256,481 · +2.9%
- By 2040
- 11,729,929 · +7.2%
- By 2050
- 11,948,407 · +9.2%
- By 2075
- 11,818,114 · +8.0%
- By 2100
- 10,842,928 · -0.9%
Race, ethnicity, and origin ACS 2023
- Neighborhood character
- Predominantly White (77%)
- Race & ethnicity
- White 77% Two or more races 10% Hispanic / Latino 9% Asian 5% Black 1%
- Hispanic origin (detail)
- Mexican 6%
- Common ancestry
- Italian 8% Scotch-Irish 3% Romanian 3%
- Foreign-born
- 16% · Canada, South Korea, China
- Languages at home
- 82% English-only · Spanish 6% Other Indo-European 6% French/Haitian/Cajun 2%
Political lean MEDSL · Los Angeles
- 2024 margin
- Solid D (+32.9) · D 64.8% · R 31.9% · Other 3.3%
- 2008→2024 swing
- -7.4pp toward R · 2008: 40.4pp · 2024: 32.9pp
- All cycles
- 2024: D+32.9 2020: D+44.2 2016: D+48.0 2012: D+40.0 2008: D+40.4
Not yet ingested
- Civics
- —
Market trends
- HPI YoY
- ▲ 0.62%
- Current HPI
- 498.5117
- Rent YoY
- ▼ -3.39%
- Metro
- Los Angeles-Long Beach-Anaheim, CA
- State GDP YoY
- ▲ 3.21%
- F500 in state
- 116
Industry mix (Fortune 500 HQ in CA)
| Industry | F500 HQs | Revenue |
|---|---|---|
| Technology | 27 | $1,492B |
|
||
| Financial Services | 3 | $174B |
|
||
| Retail | 3 | $44B |
|
||
| Insurance | 3 | $26B |
|
||
| Media / Entertainment | 2 | $115B |
|
||
| Pharmaceuticals / Biotech | 2 | $62B |
|
||
Price history
+606.2% since first listed10 events — show timeline
- 2026-05-26 Listed $1,695,000 TheMLS
- 2026-05-15 Price Changed — TheMLS
- 2026-05-11 Relisted — TheMLS
- 2026-04-14 Listed — TheMLS
- 2024-05-20 Rental Removed $7,000 CLAW
- 2024-03-04 Price Changed $7,000 CLAW
- 2024-02-19 Price Changed $11,000 CLAW
- 2024-01-03 Price Changed $7,000 CLAW
- 2023-12-19 Listed for Rent $8,000 CLAW
- 1985-08-06 Sold (Public Records) $240,000 Public Records
Property tax history
+2.5%/yrLatest (2025): $6,960 · +9.9% YoY. Source: county tax records.
Cash-flow waterfall
monthlySold comps — $/sqft
last 12 mo · ≤1 miLoading sold comps…