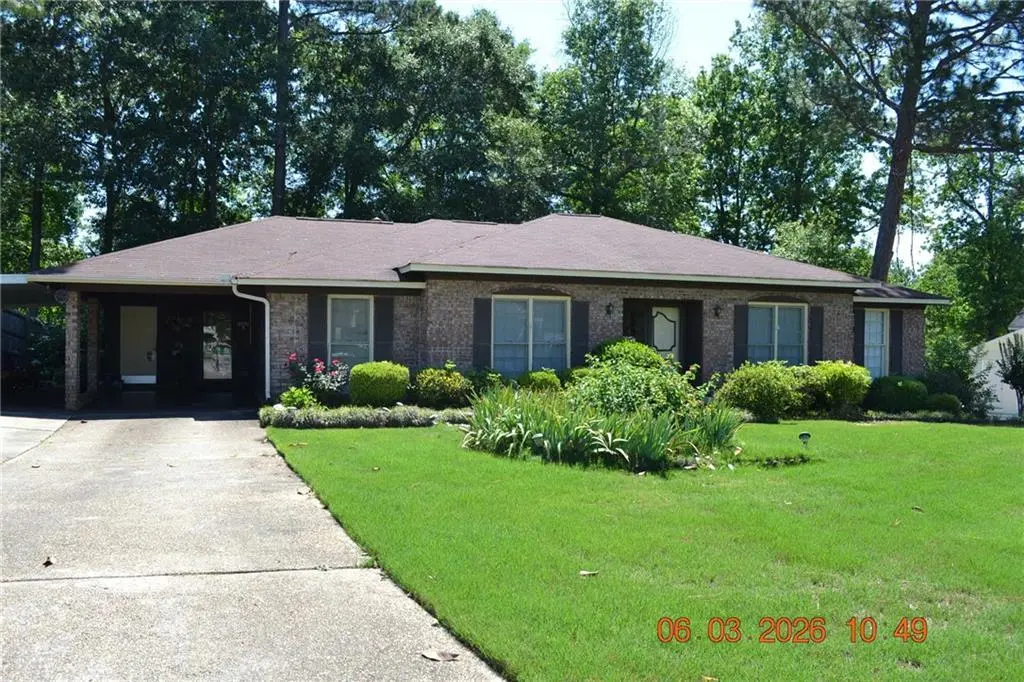
4304 Bridgewater Dr · Phenix City, AL
Flood risk 1/10 · Minimal
- FEMA flood zone
- X (unshaded)
- Chance of flooding over 30 yrs
- 0.0%
- Est. flood insurance / yr
- $507 – $1,088
Fire risk 3/10 · Minor
- Est. fire insurance / yr
- $916 – $1,700
Heat risk 7/10 · Major
- Hot days now (above 107°F)
- 7 days/yr
- Hot days in 30 yrs
- 19 days/yr
Wind risk 8/10 · Major
- Chance of severe wind over 30 yrs
- 80.0%
Air-quality risk 5/10 · Moderate
- Unhealthy air days now
- 7 days/yr
- Unhealthy air days in 30 yrs
- 8 days/yr
Risk factors via First Street. Map © Google.
Why this score? — see what drove the C+ grade
The composite is a weighted blend of 9 inputs, each scored 0–100. Each bar is that input's sub-score; the figure is the points it added to the 100-point composite (weight × sub-score).
- Cash flow +23.4/30.0
- ARV discount +15.0/15.0
- DSCR +7.5/10.0
- 1% rule +5.1/10.0
- Rent growth +3.8/5.0
- Livability +3.0/5.0
- Schools +2.7/10.0
- Condition / age +2.5/5.0
- Appreciation +0.0/10.0
$189,000
🖨 Deal sheet 📄 Offer letter ✓ Due diligence
Listing remarks
CARPORT & CARPORT AWNING, STORAGE OFF CARPORT, BREAKFAST AREA WITH BAY WINDOW, DEN WITH FIREPLACE, SPECIAL CEILINGS, GREENHOUSE, TWO (2) STORAGE BUILDINGS, HUGE COVERED DECK, FIREPLACE INSERT. THREE (3) FULL BATHS! LIVING ROOM, DINING ROOM AND DEN. GREAT LOCATION NEAR LAKEWOOD PARK AND GOLF COURSE.
Key facts
- Special ceilings
- Storage off carport
- Carport
Tags
Property features AI
Finance
- HOA & community: No community features listed
Exterior
- Parking: Two covered spaces; Two-car carport
- Utilities: Public water; Public sewer; Electricity available; Cable available; Phone available
- Home design: Single-family residence; One story; Fixer condition; Brick construction
- Construction: Brick exterior; Composition shingle roof
- Exterior features: Covered deck/patio; Back yard and front yard; Level to sloped lot; City street frontage; Storage (outbuilding); Has a view
Interior
- Kitchen: Dishwasher; Electric range; Range hood
- Bedrooms: Three main-level bedrooms
- Flooring: Carpet; Laminate; Other
- Bathrooms: Three full bathrooms, all on the main level
- Heating & cooling: Central heating and forced air; Fireplace insert; Central air conditioning
- Interior features: Entrance foyer; Vaulted ceilings; Wood window frames; One fireplace with insert in the family room; Private entrance; Storage
- Laundry & utility: Main-level laundry room
Neighborhood map
What this means for you Summary
Snapshot
- This is a 3-bed/2.0-bath single-family listed at $189k.
Deal economics
- At list price, monthly cash flow is $349 ($4k/yr) — positive.
- The deal already cash-flows at list — no discount required.
- Meets the 1% rule at list price ($2k rent vs $189k).
- Cap rate 8.5% vs local median 5.0% in Phenix City — top-decile yield for the area; either an underpriced asset or a hidden risk that comps aren't pricing in. Stress-test before assuming the spread holds.
Location & tenants
- Location reads 60/100 on livability (#297 in AL) — a middle-class / working-renter tenant base. Strengths: cost of living A+, housing A+; Watch: schools D+, crime F, amenities F.
- Phenix City (suburban): math 22% / reading 44% proficiency, ranked #59 of 129 in AL (top 46%) — families likely to look elsewhere, expect single-tenant / working-renter base with shorter leases; 64% free/reduced lunch — lower-income household profile, screen leases tightly.
- Market conditions: Rents rising fast (+5.3%/yr); 217 active listings in the ZIP; 4 comparable units currently listed for rent nearby; rentals at typical pace (median 21d on market — plan ~3-4 weeks tenant-placement turnaround); 183 units permitted in Russell County in 2024 (0 in 5+ unit buildings).
- At $1,900/mo this rent would consume 47% of the median local household income ($48k/yr) (locally 1399% of renters already pay >50% of income on rent) — very limited rent-growth headroom before tenants either downsize or default.
Forward outlook
- Local home prices are declining (-3.0%/yr); year-one equity from $1k of loan paydown is wiped out by about $6k of value loss. Plan a longer hold.
- Russell County population projected at +42% by 2050 — long-run rental-demand tailwind backs the buy-and-hold thesis.
- At projected returns (-3.0% appreciation + 5.3% rent growth), your $53k cash investment doubles in ~10 years — after that, you're playing with house money.
Negotiation context
- Only 9 days on market — expect competitive offers; lowballing is unlikely to land.
- Current owner paid $157k; 20% above their basis — modest negotiation headroom, anchor on the comps not their cost.
Risks & watch-outs
- Climate carrying-cost: severe wind risk, 80% chance of damaging wind over 30y; extreme-heat days projected 7→19/yr by 2055 (HVAC capex compounding) — expect insurance premiums to compound above CPI over the hold.
Questions for the listing agent
- Built in 1974 — when were the roof, HVAC, electrical panel, plumbing, and water heater last replaced?
- Is there a deadline driving the sale (1031 exchange, divorce, estate, relocation)? That informs how much negotiation room exists.
- Schools are D-rated, which usually means shorter tenancies and higher turnover. Who's the typical renter profile here, and what's been the actual vacancy rate?
- Crime grade is F in this area — have there been break-ins, vandalism, or insurance claims at this property in the last 3 years? What carrier currently insures it and at what premium?
- What's the average days-on-market for RENTAL listings here right now (not sales)? A rising rental-DOM trend means longer vacancies and softer asking-rent achievability than the comps imply.
- What's the recent tenant-quality profile in this submarket — average credit score on applications, eviction rate, late-payment / NSF rate, and stable-employment percentage? A property-management company in the area should have these aggregated.
- How much new for-sale + rental construction is in the pipeline within 1–3 miles? Heavy new supply typically softens prices + rents 12–24 months out; constrained supply supports both.
Investment metrics
- 1% rule
- 1.01% ✓
- Cap rate
- 8.51%
- Cash-on-cash
- 7.92%
- DSCR
- 1.35
- GRM
- 8.3
CMA / ARV
- ARV (on-the-fly)
- $286,516
- Comps found
- 12
Show comp detail 12 sales within ~0.75 mi
| Address | Dist | Beds/Ba | Sqft | Sold | Price | $/sf | Match |
|---|---|---|---|---|---|---|---|
| 3403 Bridgewater Ct | 0.05mi | 3/2.0 | 1,833 (+6%) | 10mo | $259,900 | $142 | 79 |
| 4515 Silver Lake Dr | 0.44mi | 3/2.0 | 1,739 (+1%) | 1mo | $293,000 | $168 | 78 |
| 3209 Silver Lake Dr | 0.39mi | 3/2.0 | 1,705 (-1%) | 13mo | $269,900 | $158 | 69 |
| 27 Lakewood Pl | 0.63mi | 3/2.0 | 1,727 (+0%) | 4mo | $190,000 | $110 | 67 |
| 4204 Silver Terrace Ct | 0.23mi | 3/2.0 | 1,488 (-14%) | 10mo | $230,000 | $155 | 58 |
| 28 Lakewood Pl | 0.63mi | 3/2.5 | 1,722 (-0%) | 13mo | $225,000 | $131 | 58 |
| 3022 Thornberry Cir | 0.71mi | 3/2.0 | 1,633 (-5%) | 11mo | $295,000 | $181 | 49 |
| 5206 Best Dr | 0.66mi | 3/2.0 | 1,865 (+8%) | 9mo | $327,500 | $176 | 48 |
| 2901 Creekstone Ln | 0.73mi | 3/2.0 | 1,961 (+14%) | 0mo | $325,000 | $166 | 43 |
| 2749 Sawgrass Ln | 0.71mi | 4/2.0 (+1) | 1,939 (+12%) | 7mo | $305,000 | $157 | 36 |
| 5101 Pierce Point Dr | 0.71mi | 3/2.0 | 1,470 (-15%) | 11mo | $266,000 | $181 | 33 |
| 5105 Pierce Point Drive Dr | 0.74mi | 3/2.0 | 1,470 (-15%) | 14mo | $246,600 | $168 | 29 |
Match score weights: distance 35% · size 25% · config 20% · recency 20%. Top-matched comps best support the ARV.
Projected returns pro-forma
-3.0% appreciation · 5.33% rent growth · sell at horizon
- IRR
- -1.9%
- Equity multiple
- 0.93×
- Total profit
- $-3,883
- Equity at exit
- $28,181
- IRR
- 9.9%
- Equity multiple
- 1.84×
- Total profit
- $44,622
- Equity at exit
- $16,341
Cash invested: $52,920 (down + closing). Projections, not guarantees.
Landlord ↔ Tenant lean methodology
- Overall (STATE)
- 90 Strongly Landlord-Friendly
- State Alabama
- 90 Strongly Landlord-Friendly · R+15
- County
- — inherits STATE
- City
- — inherits STATE
ZIP-level market 36867
- Home prices YoY
- -30.1%
- Rents YoY
- 5.3%
- Active inventory
- 217
- Price-to-rent
- 8.3×
Monthly cashflow live
- Estimated rent
- $1,900 medium interval (Pro) →
- Mortgage (P&I)
- −$991
- Tax from tax record
- −$82 /mo · $983/yr
- Insurance
- −$79
- HOA
- −$0
- Vacancy / Maint / Mgmt
- −$399
- Net cashflow
- $349
Break-even live
UW: 25.0% down · 7.5% · 30yr · 1.5% tax · 5.0% vac · 8.0% maint · 8.0% mgmt
Financing live
Cash to close
- Down payment
- $47,250
- Closing costs
- $5,670
- Reserves months
- —
- Total cash needed
- —
Loan-product check · same deal, 3 products live
Conventional
25% down · 7.5% · 30yr
- Down + closing
- —
- Monthly P&I
- —
- Monthly cashflow
- —
- DSCR
- —
- Eligible?
- —
Personal DTI + credit; lowest rate.
DSCR
20% down · 8.5% · 30yr
- Down + closing
- —
- Monthly P&I
- —
- Monthly cashflow
- —
- DSCR
- —
- Eligible?
- —
No personal income docs; deal must DSCR.
Hard money
10% down · 12.0% · 12mo
- Down + closing
- —
- Monthly P&I
- —
- Monthly cashflow
- —
- DSCR
- —
- Eligible?
- —
Short-term bridge; refi at stabilization.
Rent comps 4 comps
| Address | Beds | Baths | Sqft | Rent | $/sqft | DOM | Units | Dist |
|---|---|---|---|---|---|---|---|---|
| 4404 Bridgewater Dr Phenix City, AL | 3.0 | 2.0 | 1894 | $2,100 | $1.11 | 21d | 1 | 0.09mi |
| 3622 S Railroad St Phenix City, AL | 1.0–3.0 | 1.0–2.5 | 1141 | $1,792 | $1.57 | 13d | 10 | 0.37mi |
| 15 Windsweep Ct Phenix City, AL | 2.0 | 2.0 | 1209 | $1,025 | $0.85 | 13d | 1 | 0.60mi |
| 1914 Tranquil Ln Phenix City, AL | 2.0 | 2.5 | 1581 | $1,700 | $1.08 | 21d | 1 | 0.97mi |
Listing history 9 events
-
2026-06-17status $189,000 Pending 9 DOM
-
2026-06-17days on market $189,000 Active 9 DOM
-
2026-06-16days on market $189,000 Active 8 DOM
-
2026-06-15days on market $189,000 Active 7 DOM
-
2026-06-14days on market $189,000 Active 5 DOM
-
2026-06-13days on market $189,000 Active 4 DOM
-
2026-06-10days on market $189,000 Active 2 DOM
-
2026-06-09remarks 302-char remark
-
2026-06-09$189,000 Active 1 DOM
ⓘ Source: listings_history table (triggers on properties + properties_extension) + one-shot
backfill from property_details.listing_events for pre-trigger history.
Tax reassessment forecast AL · Resets to sale price
- Current annual tax
- $983 · $82/mo
- Projected year-2 tax
- $983 · $82/mo
- Expected delta
- $0/yr ($0/mo · 0.0%)
ⓘ Screening estimate from a state-policy table — verify with the county assessor before closing.
Climate risk First Street
- Flood 1/10 Low FEMA zone X (unshaded) · 0% chance over 30 yrs
- Wildfire 3/10 Moderate
- Heat 7/10 Severe 7 d/yr ≥107°F today · 19 d/yr by 30 yrs out
- Wind 8/10 Severe 80% chance of damaging wind over 30 yrs
- Air quality 5/10 Major 7 unhealthy d/yr today · 8 by 30 yrs out
Nearby sold comps map
Loading sold comps map…
Walkable amenities ~0.75 mi
Loading nearby amenities…
Taxation est. · year 1
- Rental income
- $22,803
- − Mortgage interest
- −$10,587
- − Property taxes
- −$983
- − Insurance
- −$945
- − Repairs & maintenance
- −$1,824
- − Management
- −$1,824
- − Depreciation
- −$5,498
- Taxable income
- $1,141
- Est. tax owed @ 24.0%
- −$274
- After-tax cash flow
- $3,919/yr
For passive investors: Depreciation is non-cash, so a rental often shows a tax loss while cash-flowing — sheltering income. Rental losses are passive: they offset passive income freely, and up to $25,000/yr can offset ordinary (W-2) income if you actively participate and your MAGI is under $100k (phasing out to $0 by $150k); unused losses carry forward. On sale, claimed depreciation is recaptured at up to 25%, and gains may owe capital-gains tax (a 1031 exchange can defer both). Figures are a year-1 estimate at your 24.0% rate — not tax advice; consult a CPA.
Schools (NCES district)
- District
- Phenix City
- NCES district ID
- 0102700
- Math proficiency
- 22% ▼ -24.00%
- Reading proficiency
- 44% ▼ -1.00%
- Median HH income
- $36,228
- Composite
- 27.29/100
- National rank
- #7001
- State rank
- #59 of 129 in AL
Livability — Phenix City
- Score
- 60/100
- State rank
- #297
- US rank
- #19037
Category grades
Schools grade is shown separately in the Schools card above.
Census & demographics
- Census place
- Phenix City, AL
- County
- Russell County · 53,055 people
- City population
- 62,290
- Metro
- Columbus, GA-AL
- Population (ZIP)
- 22,821
- Household income
- $48,026
- Rent vs Own
- Severe rent burden
- 1399.0
Population outlook (Russell County) Hauer SSP2
- Today (2025)
- 70,137 people
- By 2030
- 75,826 · +8.1%
- By 2040
- 87,858 · +25.3%
- By 2050
- 99,721 · +42.2%
- By 2075
- 128,009 · +82.5%
- By 2100
- 149,251 · +112.8%
Race, ethnicity, and origin ACS 2023
- Neighborhood character
- Diverse neighborhood (Simpson 0.60)
- Race & ethnicity
- White 53% Black 34% Hispanic / Latino 7% Two or more races 7% Asian 2%
- Hispanic origin (detail)
- Mexican 1% Puerto Rican 2% Cuban 2%
- Common ancestry
- Romanian 2% Italian 2% Slovak 1%
- Foreign-born
- 4% · Canada, China, South Korea
- Languages at home
- 94% English-only · Spanish 4% Tagalog/Filipino 1%
Political lean MEDSL · Russell
- 2024 margin
- Toss-up / Even · D 50.4% · R 48.7%
- 2008→2024 swing
- -5.6pp toward R · 2008: 7.3pp · 2024: 1.7pp
- All cycles
- 2024: D+1.7 2020: D+6.4 2016: D+1.9 2012: D+11.8 2008: D+7.3
Not yet ingested
- Civics
- —
Market trends
- HPI YoY
- ▼ -74.10%
- Current HPI
- 171.8426
- Rent YoY
- ▲ 5.33%
- Metro
- Columbus, GA-AL
- State GDP YoY
- ▲ 2.94%
- F500 in state
- 4
Industry mix (Fortune 500 HQ in AL)
| Industry | F500 HQs | Revenue |
|---|---|---|
| Financial Services | 1 | $8B |
|
||
| Healthcare | 1 | $5B |
|
||
Price history
+20.1% since first listed2 events — show timeline
- 2026-06-07 Listed $189,000 EABOR
- 1974-12-13 Sold (Public Records) $157,308 Public Records
Property tax history
+3.8%/yrLatest (2025): $983 · +6.8% YoY. Source: county tax records.
Cash-flow waterfall
monthlySold comps — $/sqft
last 12 mo · ≤1 miLoading sold comps…