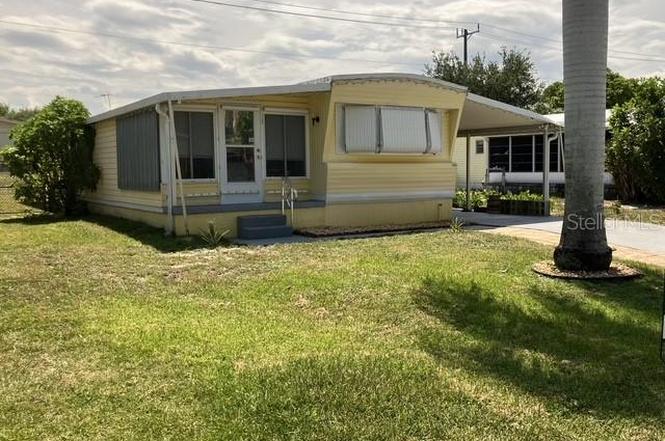
7388 SE Swan Ave · Hobe Sound, FL
Flood risk 1/10 · Minimal
- FEMA flood zone
- X (unshaded)
- Chance of flooding over 30 yrs
- 0.0%
- Est. flood insurance / yr
- $507 – $1,088
Fire risk 3/10 · Minor
- Est. fire insurance / yr
- $947 – $1,759
Heat risk 10/10 · Severe
- Hot days now (above 106°F)
- 7 days/yr
- Hot days in 30 yrs
- 25 days/yr
Wind risk 10/10 · Severe
- Chance of severe wind over 30 yrs
- 99.0%
Air-quality risk 2/10 · Minimal
- Unhealthy air days now
- 1 days/yr
- Unhealthy air days in 30 yrs
- 1 days/yr
Risk factors via First Street. Map © Google.
Why this score? — see what drove the B- grade
The composite is a weighted blend of 9 inputs, each scored 0–100. Each bar is that input's sub-score; the figure is the points it added to the 100-point composite (weight × sub-score).
- Cash flow +30.0/30.0
- DSCR +10.0/10.0
- 1% rule +7.9/10.0
- ARV discount +6.8/15.0
- Schools +4.5/10.0
- Livability +3.5/5.0
- Rent growth +3.0/5.0
- Condition / age +2.5/5.0
- Appreciation +0.0/10.0
$174,900
🖨 Deal sheet 📄 Offer letter ✓ Due diligence
Listing remarks MLS
Charming 2 Bedrm/ 2 Bath Singlewide in Ridgway, all ages park in Hobe Sound. 1020 sq ft under a/c. Convenient SPLIT PLAN w bedrms on either end of home. The Master Bedrm has a double closet & built-in bureau. The Master Bath has been updated in 2022 w new granite topped vanity, shower surround & chair height toilet. The Kitchen is light & bright w new glass top range in 2021 & new counter top. The side Florida Room is where the owners hang out w a large opening to the LR & Kitchen. A/C new in 2020. New Aluminum Roof-over 2002. Driveway painted & sealed 2022, new front steps 2022, new flooring in Kitchen & Hallway 2020. 200 Amp Service 2018, new hot water heater 2019. Ridgeway is mins to ocean beaches, ICW Boat Ramp, shopping & restaurants. YOU OWN THE LAND - ALL PETS WELCOME! NO HOA FEE.
Key facts
- Swimming pool
- Pristine beaches
- 6,098 sq ft lot
Tags
Property features AI
Finance
- Other: Homestead exemption; Zoning: RT
- Financial info: No lease restrictions
- HOA & community: No association fees; Pool; Golf carts allowed; Pets allowed (cats and dogs)
Exterior
- Parking: Carport with 2 spaces
- Security: Hurricane shutters; Smoke detector(s)
- Utilities: Public water; Public sewer; Electricity connected; Water connected; Sewer connected; Cable available; BB/HS internet available; Sprinkler well
- Home design: Manufactured home (single wide); One story; East facing entry
- Construction: Metal siding; Roof over; Block foundation and crawlspace; Completed condition
- Exterior features: Covered, enclosed and screened porches (front, rear and side); Awning(s); Dog run / kennel; Storage; Workshop; Chain link fencing; Irrigation equipment; Cleared, landscaped and level lot; Paved road access (asphalt)
Interior
- Kitchen: Range; Microwave; Refrigerator; Electric water heater; Eat-in kitchen
- Bedrooms: 2 bedrooms
- Flooring: Carpet; Concrete; Linoleum
- Bathrooms: 2 full bathrooms
- Heating & cooling: Central heating; Central air
- Interior features: Ceiling fans; Eat-in kitchen; Split bedroom layout; Thermostat; Blinds; Smoke detector(s)
- Laundry & utility: Washer hookup; Dryer hookup; Laundry room; Washer; Dryer
Neighborhood map
What this means for you Summary
Snapshot
- This is a 2-bed/2.0-bath manufactured listed at $175k.
Deal economics
- At list price, monthly cash flow is $729 ($9k/yr) — positive.
- The deal already cash-flows at list — no discount required.
- Meets the 1% rule at list price ($2k rent vs $175k).
- Cap rate 11.3% vs local median 3.5% in Hobe Sound — top-decile yield for the area; either an underpriced asset or a hidden risk that comps aren't pricing in. Stress-test before assuming the spread holds.
Location & tenants
- Location reads 69/100 on livability (#497 in FL) — a middle-class / working-renter tenant base. Strengths: housing A+, crime A, cost of living A; Watch: employment C-, amenities F, commute F.
- Martin (suburban): math 52% / reading 53% proficiency, ranked #24 of 73 in FL (top 33%) — acceptable for families but not a draw, mixed tenant base, ~2y average lease.
- Market conditions: Rents rising (+1.8%/yr); 279 active listings in the ZIP; 2 comparable units currently listed for rent nearby; 737 units permitted in Martin County in 2024 (167 in 5+ unit buildings).
- This rent runs 39% of the median local income ($70k/yr) — at the standard rent-burdened threshold; future hikes will face affordability resistance.
Forward outlook
- Local home prices are declining (-3.0%/yr); year-one equity from $1k of loan paydown is wiped out by about $5k of value loss. Plan a longer hold.
- Martin County population projected at +19% by 2050 — long-run rental-demand tailwind backs the buy-and-hold thesis.
- At projected returns (-3.0% appreciation + 1.8% rent growth), your $49k cash investment doubles in ~8 years — after that, you're playing with house money.
Negotiation context
- Only 7 days on market — expect competitive offers; lowballing is unlikely to land.
- 2 sale attempts since 4y ago with the ask held roughly flat each time — persistent listings suggest the price (not the market) is what's stuck; bring a comps-based counter.
Risks & watch-outs
- Climate carrying-cost: severe wind risk, 99% chance of damaging wind over 30y; extreme-heat days projected 7→25/yr by 2055 (HVAC capex compounding) — expect insurance premiums to compound above CPI over the hold.
Questions for the listing agent
- Built in 1977 — when were the roof, HVAC, electrical panel, plumbing, and water heater last replaced?
- Is there a deadline driving the sale (1031 exchange, divorce, estate, relocation)? That informs how much negotiation room exists.
- What's the average days-on-market for RENTAL listings here right now (not sales)? A rising rental-DOM trend means longer vacancies and softer asking-rent achievability than the comps imply.
- What's the recent tenant-quality profile in this submarket — average credit score on applications, eviction rate, late-payment / NSF rate, and stable-employment percentage? A property-management company in the area should have these aggregated.
- How much new for-sale + rental construction is in the pipeline within 1–3 miles? Heavy new supply typically softens prices + rents 12–24 months out; constrained supply supports both.
Investment metrics
- 1% rule
- 1.29% ✓
- Cap rate
- 11.29%
- Cash-on-cash
- 17.86%
- DSCR
- 1.79
- GRM
- 6.4
CMA / ARV
- ARV (on-the-fly)
- $172,080
- Comps found
- 9
Show comp detail 9 sales within ~0.75 mi
| Address | Dist | Beds/Ba | Sqft | Sold | Price | $/sf | Match |
|---|---|---|---|---|---|---|---|
| 7438 SE Swan Ave | 0.05mi | 2/2.0 | 728 (+1%) | 14mo | $158,000 | $217 | 84 |
| 7437 SE Swan Ave | 0.06mi | 2/2.0 | 744 (+3%) | 18mo | $177,500 | $239 | 76 |
| 8008 SE Swan Ave | 0.56mi | 2/2.0 | 720 (0%) | 2mo | $145,000 | $201 | 73 |
| 7289 SE Eagle Ave | 0.09mi | 3/2.0 (+1) | 810 (+12%) | 10mo | $190,000 | $235 | 61 |
| 7836 SE Wren Ave | 0.46mi | 2/2.0 | 672 (-7%) | 8mo | $185,000 | $275 | 61 |
| 8130 SE Eagle Ave | 0.69mi | 2/2.0 | 672 (-7%) | 3mo | $110,000 | $164 | 54 |
| 7816 SE Wren Ave | 0.44mi | 2/1.0 | 672 (-7%) | 12mo | $175,000 | $260 | 54 |
| 8121 SE Skylark Ave | 0.74mi | 2/1.5 | 672 (-7%) | 2mo | $165,000 | $246 | 51 |
| 8126 SE Wren Ave | 0.71mi | 2/2.0 | 740 (+3%) | 23mo | $190,000 | $257 | 43 |
Match score weights: distance 35% · size 25% · config 20% · recency 20%. Top-matched comps best support the ARV.
Projected returns pro-forma
-3.0% appreciation · 1.8% rent growth · sell at horizon
- IRR
- 8.1%
- Equity multiple
- 1.31×
- Total profit
- $15,325
- Equity at exit
- $26,078
- IRR
- 16.4%
- Equity multiple
- 2.27×
- Total profit
- $62,070
- Equity at exit
- $15,122
Cash invested: $48,972 (down + closing). Projections, not guarantees.
Landlord ↔ Tenant lean methodology
- Overall (STATE)
- 87 Strongly Landlord-Friendly
- State Florida
- 87 Strongly Landlord-Friendly · R+3
- County
- — inherits STATE
- City
- — inherits STATE
ZIP-level market 33455
- Rents YoY
- 1.8%
- Active inventory
- 279
- Price-to-rent
- 6.4×
Monthly cashflow live
- Estimated rent
- $2,264 medium interval (Pro) →
- Mortgage (P&I)
- −$917
- Tax from tax record
- −$69 /mo · $834/yr
- Insurance
- −$73
- HOA
- −$0
- Vacancy / Maint / Mgmt
- −$475
- Net cashflow
- $729
Break-even live
UW: 25.0% down · 7.5% · 30yr · 1.5% tax · 5.0% vac · 8.0% maint · 8.0% mgmt
Financing live
Cash to close
- Down payment
- $43,725
- Closing costs
- $5,247
- Reserves months
- —
- Total cash needed
- —
Loan-product check · same deal, 3 products live
Conventional
25% down · 7.5% · 30yr
- Down + closing
- —
- Monthly P&I
- —
- Monthly cashflow
- —
- DSCR
- —
- Eligible?
- —
Personal DTI + credit; lowest rate.
DSCR
20% down · 8.5% · 30yr
- Down + closing
- —
- Monthly P&I
- —
- Monthly cashflow
- —
- DSCR
- —
- Eligible?
- —
No personal income docs; deal must DSCR.
Hard money
10% down · 12.0% · 12mo
- Down + closing
- —
- Monthly P&I
- —
- Monthly cashflow
- —
- DSCR
- —
- Eligible?
- —
Short-term bridge; refi at stabilization.
Rent comps 2 comps
| Address | Beds | Baths | Sqft | Rent | $/sqft | DOM | Units | Dist |
|---|---|---|---|---|---|---|---|---|
| 8160 SE Eagle Ave Hobe Sound, FL | 2.0 | 1.0 | 672 | $1,600 | $2.38 | 23d | 1 | 0.70mi |
| 7109 SE Ridgeway Ter Hobe Sound, FL | 2.0 | 1.0 | 624 | $1,600 | $2.56 | 21d | 1 | 0.84mi |
Listing history 7 events
-
2026-06-18days on market $174,900 Active 7 DOM
-
2026-06-17days on market $174,900 Active 6 DOM
-
2026-06-16days on market $174,900 Active 5 DOM
-
2026-06-15days on market $174,900 Active 4 DOM
-
2026-06-14days on market $174,900 Active 2 DOM
-
2026-06-13remarks 699-char remark
-
2026-06-13$174,900 Active 1 DOM
ⓘ Source: listings_history table (triggers on properties + properties_extension) + one-shot
backfill from property_details.listing_events for pre-trigger history.
Tax reassessment forecast FL · Resets to sale price
- Current annual tax
- $834 · $69/mo
- Projected year-2 tax
- $1,452 · $121/mo
- Expected delta
- +$618/yr (+$51/mo · 74.1%)
ⓘ Screening estimate from a state-policy table — verify with the county assessor before closing.
Climate risk First Street
- Flood 1/10 Low FEMA zone X (unshaded) · 0% chance over 30 yrs
- Wildfire 3/10 Moderate
- Heat 10/10 Extreme 7 d/yr ≥106°F today · 25 d/yr by 30 yrs out
- Wind 10/10 Extreme 99% chance of damaging wind over 30 yrs
- Air quality 2/10 Low 1 unhealthy d/yr today · 1 by 30 yrs out
Nearby sold comps map
Loading sold comps map…
Walkable amenities ~0.75 mi
Loading nearby amenities…
Taxation est. · year 1
- Rental income
- $27,167
- − Mortgage interest
- −$9,797
- − Property taxes
- −$834
- − Insurance
- −$874
- − Repairs & maintenance
- −$2,173
- − Management
- −$2,173
- − Depreciation
- −$5,088
- Taxable income
- $6,226
- Est. tax owed @ 24.0%
- −$1,494
- After-tax cash flow
- $7,253/yr
For passive investors: Depreciation is non-cash, so a rental often shows a tax loss while cash-flowing — sheltering income. Rental losses are passive: they offset passive income freely, and up to $25,000/yr can offset ordinary (W-2) income if you actively participate and your MAGI is under $100k (phasing out to $0 by $150k); unused losses carry forward. On sale, claimed depreciation is recaptured at up to 25%, and gains may owe capital-gains tax (a 1031 exchange can defer both). Figures are a year-1 estimate at your 24.0% rate — not tax advice; consult a CPA.
Schools (NCES district)
- District
- Martin
- NCES district ID
- 1201290
- Math proficiency
- 52% ▼ -14.00%
- Reading proficiency
- 53% ▼ -4.00%
- Median HH income
- $52,482
- Composite
- 45.1/100
- National rank
- #2690
- State rank
- #24 of 73 in FL
Livability — Hobe Sound
- Score
- 69/100
- State rank
- #497
- US rank
- #8763
Category grades
Schools grade is shown separately in the Schools card above.
Census & demographics
- Census place
- Hobe Sound, FL
- County
- Martin County · 165,223 people
- City population
- 20,018
- Metro
- Port St. Lucie, FL
- Population (ZIP)
- 20,018
- Household income
- $70,389
- Rent vs Own
- Severe rent burden
- 317.0
Population outlook (Martin County) Hauer SSP2
- Today (2025)
- 172,383 people
- By 2030
- 180,192 · +4.5%
- By 2040
- 194,114 · +12.6%
- By 2050
- 204,992 · +18.9%
- By 2075
- 229,641 · +33.2%
- By 2100
- 232,146 · +34.7%
Race, ethnicity, and origin ACS 2023
- Neighborhood character
- Predominantly White (84%)
- Race & ethnicity
- White 84% Hispanic / Latino 8% Two or more races 6% Black 5% Asian 1%
- Hispanic origin (detail)
- Mexican 3% Dominican 1%
- Common ancestry
- Romanian 5% Italian 2% Slovak 2%
- Foreign-born
- 8% · Canada
- Languages at home
- 91% English-only · Spanish 6% Other Indo-European 1%
Political lean MEDSL · Martin
- 2024 margin
- Solid R (+31.1) · D 34.1% · R 65.2%
- 2008→2024 swing
- -17.5pp toward R · 2008: -13.6pp · 2024: -31.1pp
- All cycles
- 2024: R+31.1 2020: R+24.6 2016: R+26.9 2012: R+22.9 2008: R+13.6
Not yet ingested
- Civics
- —
Market trends
- HPI YoY
- ▼ -287.05%
- Current HPI
- 356.7273
- Rent YoY
- ▲ 1.80%
- Metro
- Port St. Lucie, FL
- State GDP YoY
- ▲ 3.28%
- F500 in state
- 36
Industry mix (Fortune 500 HQ in FL)
| Industry | F500 HQs | Revenue |
|---|---|---|
| Industrial Technology | 2 | $29B |
|
||
| Insurance | 2 | $17B |
|
||
| Retail | 1 | $60B |
|
||
| Technology Distribution | 1 | $58B |
|
||
| Homebuilding | 1 | $35B |
|
||
| Technology Manufacturing | 1 | $35B |
|
||
Price history
+284.3% since first listed7 events — show timeline
- 2026-06-11 Listed $174,900 Stellar MLS as Distributed by MLS Grid
- 2022-12-30 Sold (Public Records) $160,000 Public Records
- 2022-12-30 Sold (MLS) $160,000 Beaches MLS
- 2022-12-04 Pending — Beaches MLS
- 2022-11-30 Listed $160,000 Beaches MLS
- 1989-12-28 Sold (Public Records) $49,900 Public Records
- 1988-11-23 Sold (Public Records) $45,507 Public Records
Property tax history
-0.8%/yrLatest (2025): $834 · +3.3% YoY. Source: county tax records.
Cash-flow waterfall
monthlySold comps — $/sqft
last 12 mo · ≤1 miLoading sold comps…