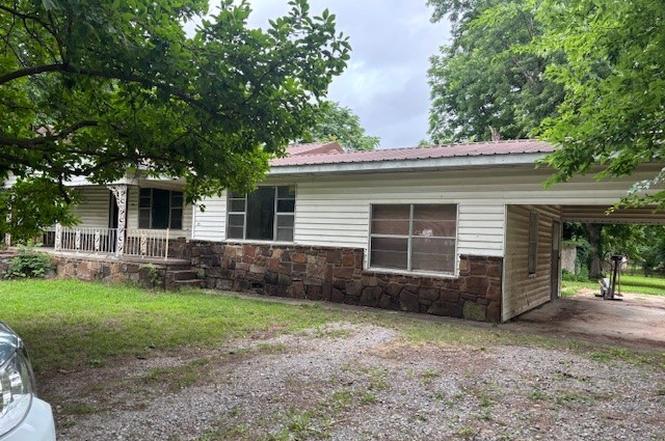
106 S Stand Watie Blvd · Webbers Falls, OK
Flood risk 1/10 · Minimal
- FEMA flood zone
- X (shaded)
- Chance of flooding over 30 yrs
- 0.0%
- Est. flood insurance / yr
- $507 – $1,088
Fire risk 2/10 · Minimal
- Est. fire insurance / yr
- $2,463 – $4,575
Heat risk 6/10 · Moderate
- Hot days now (above 112°F)
- 7 days/yr
- Hot days in 30 yrs
- 19 days/yr
Wind risk 3/10 · Minor
- Chance of severe wind over 30 yrs
- 6.0%
Air-quality risk 2/10 · Minimal
- Unhealthy air days now
- 1 days/yr
- Unhealthy air days in 30 yrs
- 2 days/yr
Risk factors via First Street. Map © Google.
Why this score? — see what drove the B grade
The composite is a weighted blend of 9 inputs, each scored 0–100. Each bar is that input's sub-score; the figure is the points it added to the 100-point composite (weight × sub-score).
- Cash flow +30.0/30.0
- DSCR +10.0/10.0
- 1% rule +9.6/10.0
- ARV discount +7.5/15.0
- Appreciation +7.5/10.0
- Livability +3.1/5.0
- Rent growth +2.5/5.0
- Condition / age +2.5/5.0
- Schools +1.8/10.0
$74,900
🖨 Deal sheet (PDF) 📄 Offer letter ✓ Due diligence
Listing remarks
Great Investment property to be sold as a bundle with 4 other properties in same vicinity, MLS#2621931, MLS#2621941, MLS#2621937, MLS#
Key facts
- 0.33 acre lot
- Garage
- Built 1984
Property features AI
Exterior
- Parking: One-car garage; Carport
- Security: No safety shelter
- Utilities: Electricity available; Natural gas available; Public water; Public sewer
- Home design: Single-story home; Faces east; Crawlspace foundation
- Construction: Stone, vinyl siding, and wood frame construction; Metal roof; Built (year per public records)
- Exterior features: Covered porch; Dirt driveway; Storage structure; Mature trees; Boat ramp/lift access to Arkansas River
Interior
- Kitchen: Electric oven; Range; Stove; Refrigerator
- Flooring: Carpet; Tile
- Bathrooms: Two full bathrooms
- Heating & cooling: Gas heating; Radiant heating; Window cooling unit(s)
- Interior features: Aluminum-framed windows; Accessible doors; Laminate counters; Ceiling fan(s); Electric oven and range connections
- Laundry & utility: Washer hookup; Electric dryer hookup; Washer; Dryer; Electric water heater
Neighborhood map
What this means for you Summary
Snapshot
- This is a 3-bed/2.0-bath single-family listed at $75k.
Deal economics
- At list price, monthly cash flow is $407 ($5k/yr) — positive.
- The deal already cash-flows at list — no discount required.
- Meets the 1% rule at list price ($1k rent vs $75k).
Location & tenants
- Location reads 62/100 on livability (#269 in OK) — a middle-class / working-renter tenant base. Strengths: cost of living A+, housing A+, crime A-; Watch: health & safety C-, amenities F, commute F.
- Webbers Falls (rural): math 15% / reading 20% proficiency, ranked #444 of 513 in OK (top 86%) — low school quality limits family demand, transient renter base, plan for 1-2y turnover; 74% free/reduced lunch — lower-income household profile, screen leases tightly.
- Zoned schools: Webbers Falls Es (math 8% / reading 12%, grade F, #711 of 845 statewide, top 87%, 199 students, 0% FRL); Webbers Falls Hs (math 10% / reading 10%, grade F, #361 of 447 statewide, top 94%, 108 students, 0% FRL) — zoned schools average 0% FRL vs 74% district-wide (74 pts lower); this property's tenant base skews higher-income than the district average.
- Market conditions: 19 active listings in the ZIP; 58 units permitted in Muskogee County in 2024 (0 in 5+ unit buildings).
Forward outlook
- In year one you build about $4k of equity ($518 loan paydown + $4k appreciation (5.1% local appreciation)).
- Muskogee County population projected at -15% by 2050 — secular population decline; favor cash flow + early exit over multi-decade hold.
- At projected returns (5.1% appreciation + 3.0% rent growth), your $21k cash investment doubles in ~3 years — after that, you're playing with house money.
- By year 8, paydown + projected appreciation supports a ~$33k cash-out refi (75% LTV) — recoverable capital for the next deal without selling this one.
Negotiation context
- Only 6 days on market — expect competitive offers; lowballing is unlikely to land.
- Current owner paid $38k; list at $75k implies a 97% gain — meaningful room to come down on a strong offer.
Risks & watch-outs
- Climate carrying-cost: extreme-heat days projected 7→19/yr by 2055 (HVAC capex compounding) — expect insurance premiums to compound above CPI over the hold.
Questions for the listing agent
- Is there a deadline driving the sale (1031 exchange, divorce, estate, relocation)? That informs how much negotiation room exists.
- Schools are F-rated, which usually means shorter tenancies and higher turnover. Who's the typical renter profile here, and what's been the actual vacancy rate?
- What's the average days-on-market for RENTAL listings here right now (not sales)? A rising rental-DOM trend means longer vacancies and softer asking-rent achievability than the comps imply.
- What's the recent tenant-quality profile in this submarket — average credit score on applications, eviction rate, late-payment / NSF rate, and stable-employment percentage? A property-management company in the area should have these aggregated.
- How much new for-sale + rental construction is in the pipeline within 1–3 miles? Heavy new supply typically softens prices + rents 12–24 months out; constrained supply supports both.
Investment metrics
- 1% rule
- 1.46% ✓
- Cap rate
- 12.82%
- Cash-on-cash
- 23.30%
- DSCR
- 2.04
- GRM
- 5.7
CMA / ARV
No comps found within radius.
Projected returns pro-forma
5.07% appreciation · 3.0% rent growth · sell at horizon
- IRR
- 33.3%
- Equity multiple
- 3.07×
- Total profit
- $43,464
- Equity at exit
- $42,748
- IRR
- 31.7%
- Equity multiple
- 6.19×
- Total profit
- $108,812
- Equity at exit
- $74,029
Cash invested: $20,972 (down + closing). Projections, not guarantees.
Landlord ↔ Tenant lean methodology
- Overall (STATE)
- 83 Strongly Landlord-Friendly
- State Oklahoma
- 83 Strongly Landlord-Friendly · R+20
- County
- — inherits STATE
- City
- — inherits STATE
ZIP-level market 74470
- Home prices YoY
- 1.8%
- Active inventory
- 19
- Price-to-rent
- 5.7×
Monthly cashflow live
- Estimated rent
- $1,095 medium interval (Pro) →
- Mortgage (P&I)
- −$393
- Tax from tax record
- −$34 /mo · $407/yr
- Insurance
- −$31
- HOA
- −$0
- Vacancy / Maint / Mgmt
- −$230
- Net cashflow
- $407
Break-even live
Sensitivity live
| Price | -10% $450 | -5% $428 | +0% $407 | +5% $386 | +10% $365 |
|---|---|---|---|---|---|
| Rent | -10% $321 | -5% $364 | +0% $407 | +5% $450 | +10% $494 |
| Rate | -1.0pp $445 | -0.5pp $426 | base $407 | +0.5pp $388 | +1.0pp $368 |
UW: 25.0% down · 7.5% · 30yr · 1.5% tax · 5.0% vac · 8.0% maint · 8.0% mgmt
Financing live
Cash to close
- Down payment
- $18,725
- Closing costs
- $2,247
- Reserves months
- —
- Total cash needed
- —
Loan-product check · same deal, 3 products live
Conventional
25% down · 7.5% · 30yr
- Down + closing
- —
- Monthly P&I
- —
- Monthly cashflow
- —
- DSCR
- —
- Eligible?
- —
Personal DTI + credit; lowest rate.
DSCR
20% down · 8.5% · 30yr
- Down + closing
- —
- Monthly P&I
- —
- Monthly cashflow
- —
- DSCR
- —
- Eligible?
- —
No personal income docs; deal must DSCR.
Hard money
10% down · 12.0% · 12mo
- Down + closing
- —
- Monthly P&I
- —
- Monthly cashflow
- —
- DSCR
- —
- Eligible?
- —
Short-term bridge; refi at stabilization.
Listing history 6 events
-
2026-06-21days on market $74,900 Active 6 DOM
-
2026-06-19days on market $74,900 Active 4 DOM
-
2026-06-18days on market $74,900 Active 3 DOM
-
2026-06-17days on market $74,900 Active 2 DOM
-
2026-06-16remarks 134-char remark
-
2026-06-16$74,900 Active 1 DOM
ⓘ Source: listings_history table (triggers on properties + properties_extension) + one-shot
backfill from property_details.listing_events for pre-trigger history.
Tax reassessment forecast OK · Resets to sale price
- Current annual tax
- $407 · $34/mo
- Projected year-2 tax
- $674 · $56/mo
- Expected delta
- +$267/yr (+$22/mo · 65.6%)
ⓘ Screening estimate from a state-policy table — verify with the county assessor before closing.
Climate risk First Street
- Flood 1/10 Low FEMA zone X (shaded) · 0% chance over 30 yrs
- Wildfire 2/10 Low
- Heat 6/10 Major 7 d/yr ≥112°F today · 19 d/yr by 30 yrs out
- Wind 3/10 Moderate 6% chance of damaging wind over 30 yrs
- Air quality 2/10 Low 1 unhealthy d/yr today · 2 by 30 yrs out
Nearby sold comps map
Loading sold comps map…
Walkable amenities ~0.75 mi
Loading nearby amenities…
Taxation est. · year 1
- Rental income
- $13,141
- − Mortgage interest
- −$4,196
- − Property taxes
- −$407
- − Insurance
- −$374
- − Repairs & maintenance
- −$1,051
- − Management
- −$1,051
- − Depreciation
- −$2,179
- Taxable income
- $3,883
- Est. tax owed @ 24.0%
- −$932
- After-tax cash flow
- $3,955/yr
For passive investors: Depreciation is non-cash, so a rental often shows a tax loss while cash-flowing — sheltering income. Rental losses are passive: they offset passive income freely, and up to $25,000/yr can offset ordinary (W-2) income if you actively participate and your MAGI is under $100k (phasing out to $0 by $150k); unused losses carry forward. On sale, claimed depreciation is recaptured at up to 25%, and gains may owe capital-gains tax (a 1031 exchange can defer both). Figures are a year-1 estimate at your 24.0% rate — not tax advice; consult a CPA.
Schools (NCES district)
- District
- Webbers Falls
- NCES district ID
- 4032130
- Math proficiency
- 15% ▲ 5.00%
- Reading proficiency
- 20% ▬ 0.00%
- Median HH income
- $37,908
- Composite
- 18.02/100
- National rank
- #14093
- State rank
- #444 of 513 in OK
Livability — Webbers Falls
- Score
- 62/100
- State rank
- #269
- US rank
- #17101
Category grades
Schools grade is shown separately in the Schools card above.
Census & demographics
- Census place
- Webbers Falls, OK
- Population (ZIP)
- 1,362
Population outlook (Muskogee County) Hauer SSP2
- Today (2025)
- 66,842 people
- By 2030
- 64,969 · -2.8%
- By 2040
- 60,920 · -8.9%
- By 2050
- 56,978 · -14.8%
- By 2075
- 47,160 · -29.4%
- By 2100
- 35,336 · -47.1%
Race, ethnicity, and origin ACS 2023
- Neighborhood character
- Diverse neighborhood (Simpson 0.62)
- Race & ethnicity
- White 61% Two or more races 20% Native American 17% Asian 1%
- Common ancestry
- Italian 5% Slovak 1% Serbian 1%
- Foreign-born
- 1% · China, Vietnam
- Languages at home
- 98% English-only · Spanish 1% Chinese 1%
Political lean MEDSL · Muskogee
- 2024 margin
- Solid R (+37.6) · D 30.4% · R 68.0% · Other 1.7%
- 2008→2024 swing
- -22.6pp toward R · 2008: -15.0pp · 2024: -37.6pp
- All cycles
- 2024: R+37.6 2020: R+33.9 2016: R+29.2 2012: R+14.8 2008: R+15.0
Not yet ingested
- Civics
- —
Market trends
- HPI YoY
- ▲ 5.07%
- Current HPI
- 283.3825
- Rent YoY
- —
- Metro
- —
- State GDP YoY
- ▲ 1.55%
- F500 in state
- 6
Industry mix (Fortune 500 HQ in OK)
| Industry | F500 HQs | Revenue |
|---|---|---|
| Energy | 3 | $48B |
|
||
Price history
+97.1% since first listed2 events — show timeline
- 2026-06-15 Listed $74,900 MLS Technology, Inc.
- 2002-08-30 Sold (Public Records) $38,000 Public Records
Property tax history
+5.4%/yrLatest (2025): $407 · +5.4% YoY. Source: county tax records.
Cash-flow waterfall
monthlySold comps — $/sqft
last 12 mo · ≤1 miLoading sold comps…