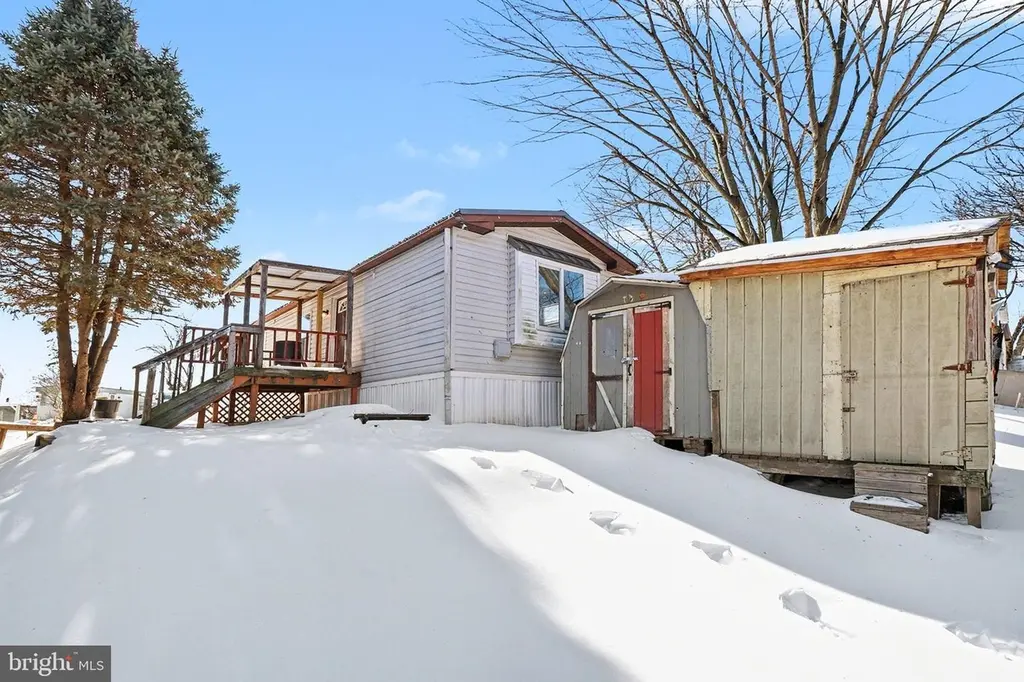
14 Laura Ct · East Drumore, PA
Flood risk 1/10 · Minimal
- FEMA flood zone
- X (unshaded)
- Chance of flooding over 30 yrs
- 0.0%
- Est. flood insurance / yr
- $507 – $1,088
Fire risk 2/10 · Minimal
- Est. fire insurance / yr
- $511 – $949
Heat risk 5/10 · Moderate
- Hot days now (above 103°F)
- 7 days/yr
- Hot days in 30 yrs
- 15 days/yr
Wind risk 6/10 · Moderate
- Chance of severe wind over 30 yrs
- 27.0%
Air-quality risk 3/10 · Minor
- Unhealthy air days now
- 2 days/yr
- Unhealthy air days in 30 yrs
- 4 days/yr
Risk factors via First Street. Map © Google.
Why this score? — see what drove the B- grade
The composite is a weighted blend of 9 inputs, each scored 0–100. Each bar is that input's sub-score; the figure is the points it added to the 100-point composite (weight × sub-score).
- Cash flow +30.0/30.0
- 1% rule +10.0/10.0
- DSCR +10.0/10.0
- ARV discount +7.5/15.0
- Schools +3.8/10.0
- Rent growth +2.5/5.0
- Livability +2.5/5.0
- Condition / age +2.5/5.0
- Appreciation +0.0/10.0
$70,000
🖨 Deal sheet 📄 Offer letter ✓ Due diligence
Listing remarks MLS
This beautifully renovated mobile home offers three spacious bedrooms and modern upgrades throughout. The bright, open layout creates a welcoming atmosphere perfect for everyday living. Enjoy the convenience of a private driveway with ample parking. Nestled in a small, quiet community, this home provides both comfort and privacy in an ideal setting.
Key facts
- Private driveway
- Quiet community
- Built 1988
Tags
Neighborhood map
What this means for you Summary
Snapshot
- This is a 3-bed/1.0-bath manufactured listed at $70k.
Deal economics
- At list price, monthly cash flow is $873 ($10k/yr) — positive.
- The deal already cash-flows at list — no discount required.
- Meets the 1% rule at list price ($2k rent vs $70k).
- Recommended offer: $62k (12.0% below list) — sets the bar for market timing.
Location & tenants
- Location reads: area grade B — affects rentability + tenant quality, not the cash-flow math above.
- Solanco SD (rural): math 31% / reading 57% proficiency, ranked #272 of 539 in PA (top 50%) — families likely to look elsewhere, expect single-tenant / working-renter base with shorter leases.
- Market conditions: 50 active listings in the ZIP; 1,093 units permitted in Lancaster County in 2024 (201 in 5+ unit buildings).
Forward outlook
- Local home prices are declining (-3.0%/yr); year-one equity from $484 of loan paydown is wiped out by about $2k of value loss. Plan a longer hold.
- Lancaster County population projected at +5% by 2050 — modest demand growth; plan on rents tracking national, not racing it.
- At projected returns (-3.0% appreciation + 3.0% rent growth), your $20k cash investment doubles in ~3 years — after that, you're playing with house money.
Negotiation context
- It's been on market 128 days — a 12% lower offer ($62k) is reasonable based on typical stale-listing flexibility.
Risks & watch-outs
- Climate carrying-cost: major wind risk, 27% chance of damaging wind over 30y; extreme-heat days projected 7→15/yr by 2055 (HVAC capex compounding) — expect insurance premiums to compound above CPI over the hold.
Questions for the listing agent
- It's been on market 128 days. Have you received any prior offers? Is the seller open to a 12% concession, seller financing, or rate buy-down credit?
- Why hasn't it sold? Are there any deal-killer items the seller is aware of (foundation, flood, title, zoning, code violations)?
- Is there a deadline driving the sale (1031 exchange, divorce, estate, relocation)? That informs how much negotiation room exists.
- What's the average days-on-market for RENTAL listings here right now (not sales)? A rising rental-DOM trend means longer vacancies and softer asking-rent achievability than the comps imply.
- What's the recent tenant-quality profile in this submarket — average credit score on applications, eviction rate, late-payment / NSF rate, and stable-employment percentage? A property-management company in the area should have these aggregated.
- How much new for-sale + rental construction is in the pipeline within 1–3 miles? Heavy new supply typically softens prices + rents 12–24 months out; constrained supply supports both.
Investment metrics
- 1% rule
- 2.45% ✓
- Cap rate
- 21.25%
- Cash-on-cash
- 53.43%
- DSCR
- 3.38
- GRM
- 3.4
CMA / ARV
- ARV (median comp)
- $304,915
- List price
- $70,000
- Delta
- -77.04%
- Verdict
- UNDERPRICED
- Comps
- 4 within 2.0 mi
Projected returns pro-forma
-3.0% appreciation · 3.0% rent growth · sell at horizon
- IRR
- 51.5%
- Equity multiple
- 3.26×
- Total profit
- $44,268
- Equity at exit
- $10,437
- IRR
- 56.9%
- Equity multiple
- 6.62×
- Total profit
- $110,228
- Equity at exit
- $6,052
Cash invested: $19,600 (down + closing). Projections, not guarantees.
Landlord ↔ Tenant lean methodology
- Overall (STATE)
- 62 Landlord-Friendly
- State Pennsylvania
- 62 Landlord-Friendly · EVEN
- County
- — inherits STATE
- City
- — inherits STATE
ZIP-level market 17566
- Active inventory
- 50
- Price-to-rent
- 3.4×
Monthly cashflow live
- Estimated rent
- $1,717 medium interval (Pro) →
- Mortgage (P&I)
- −$367
- Tax est. 1.5%
- −$88 /mo · $1,050/yr
- Insurance
- −$29
- HOA
- −$0
- Vacancy / Maint / Mgmt
- −$361
- Net cashflow
- $873
Break-even live
UW: 25.0% down · 7.5% · 30yr · 1.5% tax · 5.0% vac · 8.0% maint · 8.0% mgmt
Financing live
Cash to close
- Down payment
- $17,500
- Closing costs
- $2,100
- Reserves months
- —
- Total cash needed
- —
Loan-product check · same deal, 3 products live
Conventional
25% down · 7.5% · 30yr
- Down + closing
- —
- Monthly P&I
- —
- Monthly cashflow
- —
- DSCR
- —
- Eligible?
- —
Personal DTI + credit; lowest rate.
DSCR
20% down · 8.5% · 30yr
- Down + closing
- —
- Monthly P&I
- —
- Monthly cashflow
- —
- DSCR
- —
- Eligible?
- —
No personal income docs; deal must DSCR.
Hard money
10% down · 12.0% · 12mo
- Down + closing
- —
- Monthly P&I
- —
- Monthly cashflow
- —
- DSCR
- —
- Eligible?
- —
Short-term bridge; refi at stabilization.
Listing history 17 events
-
2026-06-18days on market $70,000 Active 128 DOM
-
2026-06-17days on market $70,000 Active 127 DOM
-
2026-06-16days on market $70,000 Active 126 DOM
-
2026-06-15days on market $70,000 Active 125 DOM
-
2026-06-14days on market $70,000 Active 123 DOM
-
2026-06-13days on market $70,000 Active 122 DOM
-
2026-06-10days on market $70,000 Active 120 DOM
-
2026-06-09days on market $70,000 Active 119 DOM
-
2026-06-08days on market $70,000 Active 118 DOM
-
2026-06-07days on market $70,000 Active 117 DOM
-
2026-06-03days on market $70,000 Active 113 DOM
-
2026-06-02days on market $70,000 Active 112 DOM
-
2026-06-01days on market $70,000 Active 111 DOM
-
2026-05-31days on market $70,000 Active 110 DOM
-
2026-05-30days on market $70,000 Active 109 DOM
-
2026-05-10price $70,000 351-char remark
Show marketing remark (351 chars)
This beautifully renovated mobile home offers three spacious bedrooms and modern upgrades throughout. The bright, open layout creates a welcoming atmosphere perfect for everyday living. Enjoy the convenience of a private driveway with ample parking. Nestled in a small, quiet community, this home provides both comfort and privacy in an ideal setting.
-
2026-02-10$75,000 Active 351-char remark
Show marketing remark (351 chars)
This beautifully renovated mobile home offers three spacious bedrooms and modern upgrades throughout. The bright, open layout creates a welcoming atmosphere perfect for everyday living. Enjoy the convenience of a private driveway with ample parking. Nestled in a small, quiet community, this home provides both comfort and privacy in an ideal setting.
ⓘ Source: listings_history table (triggers on properties + properties_extension) + one-shot
backfill from property_details.listing_events for pre-trigger history.
Climate risk First Street
- Flood 1/10 Low FEMA zone X (unshaded) · 0% chance over 30 yrs
- Wildfire 2/10 Low
- Heat 5/10 Major 7 d/yr ≥103°F today · 15 d/yr by 30 yrs out
- Wind 6/10 Major 27% chance of damaging wind over 30 yrs
- Air quality 3/10 Moderate 2 unhealthy d/yr today · 4 by 30 yrs out
Nearby sold comps map
Loading sold comps map…
Walkable amenities ~0.75 mi
Loading nearby amenities…
Taxation est. · year 1
- Rental income
- $20,605
- − Mortgage interest
- −$3,921
- − Property taxes
- −$1,050
- − Insurance
- −$350
- − Repairs & maintenance
- −$1,648
- − Management
- −$1,648
- − Depreciation
- −$2,036
- Taxable income
- $9,951
- Est. tax owed @ 24.0%
- −$2,388
- After-tax cash flow
- $8,085/yr
For passive investors: Depreciation is non-cash, so a rental often shows a tax loss while cash-flowing — sheltering income. Rental losses are passive: they offset passive income freely, and up to $25,000/yr can offset ordinary (W-2) income if you actively participate and your MAGI is under $100k (phasing out to $0 by $150k); unused losses carry forward. On sale, claimed depreciation is recaptured at up to 25%, and gains may owe capital-gains tax (a 1031 exchange can defer both). Figures are a year-1 estimate at your 24.0% rate — not tax advice; consult a CPA.
Schools (NCES district)
- District
- Solanco SD
- NCES district ID
- 4221810
- Math proficiency
- 31% ▼ -10.00%
- Reading proficiency
- 57% ▼ -4.00%
- Median HH income
- $57,326
- Composite
- 38.41/100
- National rank
- #4205
- State rank
- #272 of 539 in PA
Livability — East Drumore
No livability data for this city. (Only ~50 U.S. cities are tracked.)
Census & demographics
- Population (ZIP)
- 12,276
Population outlook (Lancaster County) Hauer SSP2
- Today (2025)
- 561,011 people
- By 2030
- 570,969 · +1.8%
- By 2040
- 585,929 · +4.4%
- By 2050
- 591,056 · +5.4%
- By 2075
- 594,747 · +6.0%
- By 2100
- 558,850 · -0.4%
Race, ethnicity, and origin ACS 2023
- Neighborhood character
- Predominantly White (91%)
- Race & ethnicity
- White 91% Two or more races 3% Hispanic / Latino 3% Asian 2% Black 1%
- Common ancestry
- Polish 3% Serbian 2% Lithuanian 2%
- Foreign-born
- 4% · Vietnam, Canada
- Languages at home
- 77% English-only · German/W. Germanic 17% Spanish 2% Vietnamese 1%
Political lean MEDSL · Lancaster
- 2024 margin
- R (+15.9) · D 41.5% · R 57.5%
- 2008→2024 swing
- -4.1pp toward R · 2008: -11.8pp · 2024: -15.9pp
- All cycles
- 2024: R+15.9 2020: R+15.8 2016: R+19.7 2012: R+19.2 2008: R+11.8
Not yet ingested
- Civics
- —
Market trends
- HPI YoY
- ▼ -146.74%
- Current HPI
- 262.7066
- Rent YoY
- —
- Metro
- —
- State GDP YoY
- ▲ 1.68%
- F500 in state
- 34
Industry mix (Fortune 500 HQ in PA)
| Industry | F500 HQs | Revenue |
|---|---|---|
| Healthcare | 2 | $309B |
|
||
| Insurance | 2 | $27B |
|
||
| Telecommunications / Media | 1 | $124B |
|
||
| Industrial Distribution | 1 | $22B |
|
||
| Financial Services | 1 | $20B |
|
||
| Chemicals / Materials | 1 | $18B |
|
||
Price history
-6.7% since first listed2 events — show timeline
- 2026-05-10 Price Changed $70,000 BRIGHT MLS
- 2026-02-10 Listed $75,000 BRIGHT MLS
Property tax history
-6.7%/yrLatest (2026): $139 · +5.0% YoY. Source: county tax records.
Cash-flow waterfall
monthlySold comps — $/sqft
last 12 mo · ≤1 miLoading sold comps…