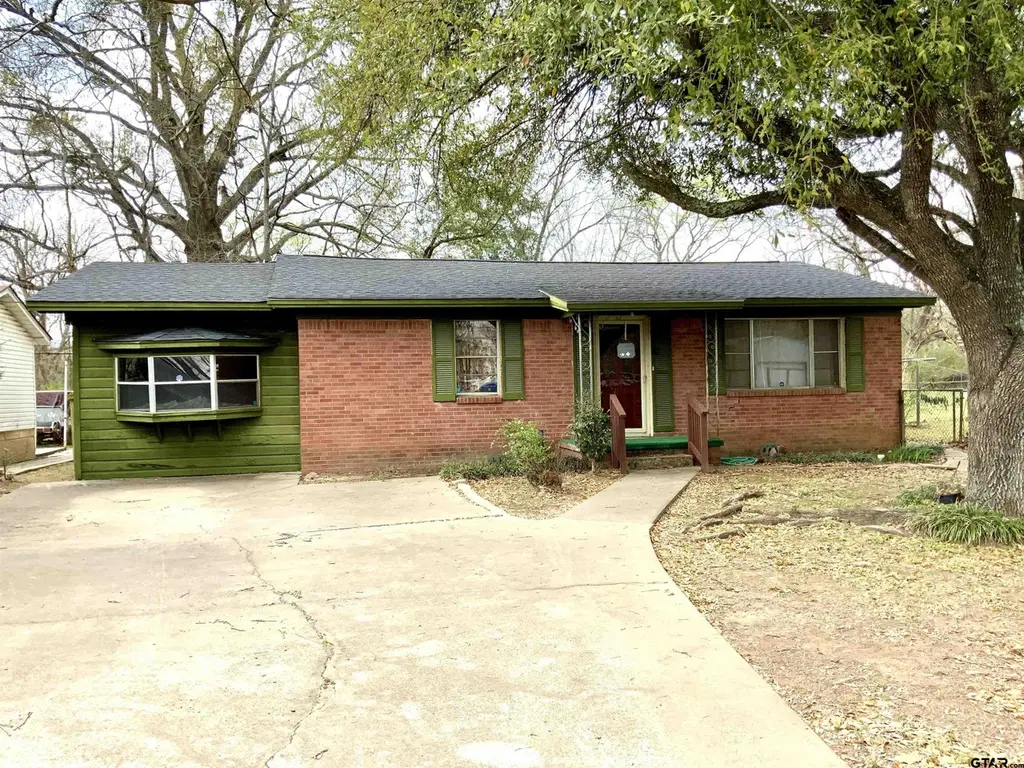
428 Park St · Crockett, TX
Flood risk 1/10 · Minimal
- FEMA flood zone
- X (unshaded)
- Chance of flooding over 30 yrs
- 0.0%
- Est. flood insurance / yr
- $507 – $1,088
Fire risk 5/10 · Moderate
- Est. fire insurance / yr
- $1,222 – $2,270
Heat risk 8/10 · Major
- Hot days now (above 110°F)
- 7 days/yr
- Hot days in 30 yrs
- 25 days/yr
Wind risk 8/10 · Major
- Chance of severe wind over 30 yrs
- 80.0%
Air-quality risk 1/10 · Minimal
- Unhealthy air days now
- 0 days/yr
- Unhealthy air days in 30 yrs
- 0 days/yr
Risk factors via First Street. Map © Google.
Why this score? — see what drove the B grade
The composite is a weighted blend of 9 inputs, each scored 0–100. Each bar is that input's sub-score; the figure is the points it added to the 100-point composite (weight × sub-score).
- Cash flow +30.0/30.0
- ARV discount +15.0/15.0
- DSCR +10.0/10.0
- 1% rule +9.1/10.0
- Livability +3.1/5.0
- Rent growth +2.5/5.0
- Condition / age +2.5/5.0
- Schools +2.0/10.0
- Appreciation +0.0/10.0
$74,900
🖨 Deal sheet (PDF) 📄 Offer letter ✓ Due diligence
Listing remarks MLS
This 2-bedroom, 2-bath home offers plenty of potential for a first-time homebuyer, investor, or someone looking to downsize. The carport has been converted into a versatile space that could serve as a den, game room, or additional living area. Situated on a spacious lot with large, mature trees, the property is conveniently located near a local park and baseball field, offering a pleasant neighborhood setting. While the home does need some repairs, it presents a wonderful opportunity to add your personal touch and build equity.
Key facts
- Versatile space
- Local park
- Large mature trees
Tags
Neighborhood map
What this means for you Summary
Snapshot
- This is a 2-bed/2.0-bath single-family listed at $75k.
Deal economics
- At list price, monthly cash flow is $314 ($4k/yr) — positive.
- The deal already cash-flows at list — no discount required.
- Meets the 1% rule at list price ($1k rent vs $75k).
- Recommended offer: $68k (9.0% below list) — sets the bar for market timing.
- Cap rate 11.3% vs local median 3.2% in Crockett — top-decile yield for the area; either an underpriced asset or a hidden risk that comps aren't pricing in. Stress-test before assuming the spread holds.
Location & tenants
- Location reads 61/100 on livability (#1,005 in TX) — a middle-class / working-renter tenant base. Strengths: cost of living A+, housing A, crime B+; Watch: schools F, amenities F, commute F.
- Crockett ISD (town): math 22% / reading 28% proficiency, ranked #736 of 826 in TX (top 89%) — low school quality limits family demand, transient renter base, plan for 1-2y turnover; 78% free/reduced lunch — lower-income household profile, screen leases tightly.
- Market conditions: 277 active listings in the ZIP; 3 comparable units currently listed for rent nearby; rentals lingering (median 45d on market — plan ~5-8 weeks vacancy on turnover, expect pricing pressure); 100% of comp listings sitting > 30 days — soft ceiling on asking rent; 3 units permitted in Houston County in 2024 (0 in 5+ unit buildings).
Forward outlook
- Local home prices are declining (-3.0%/yr); year-one equity from $518 of loan paydown is wiped out by about $2k of value loss. Plan a longer hold.
- Houston County population projected at -16% by 2050 — secular population decline; favor cash flow + early exit over multi-decade hold.
- At projected returns (-3.0% appreciation + 3.0% rent growth), your $21k cash investment doubles in ~7 years — after that, you're playing with house money.
Negotiation context
- It's been on market 96 days — a 9% lower offer ($68k) is reasonable based on typical stale-listing flexibility.
Risks & watch-outs
- Watch-outs: built in 1900 — expect roof / HVAC / electrical / plumbing capex.
- Climate carrying-cost: severe wind risk, 80% chance of damaging wind over 30y; moderate wildfire risk; extreme-heat days projected 7→25/yr by 2055 (HVAC capex compounding) — expect insurance premiums to compound above CPI over the hold.
Questions for the listing agent
- It's been on market 96 days. Have you received any prior offers? Is the seller open to a 9% concession, seller financing, or rate buy-down credit?
- Built in 1900 — when were the roof, HVAC, electrical panel, plumbing, and water heater last replaced?
- Why hasn't it sold? Are there any deal-killer items the seller is aware of (foundation, flood, title, zoning, code violations)?
- Is there a deadline driving the sale (1031 exchange, divorce, estate, relocation)? That informs how much negotiation room exists.
- Schools are F-rated, which usually means shorter tenancies and higher turnover. Who's the typical renter profile here, and what's been the actual vacancy rate?
- What's the average days-on-market for RENTAL listings here right now (not sales)? A rising rental-DOM trend means longer vacancies and softer asking-rent achievability than the comps imply.
- What's the recent tenant-quality profile in this submarket — average credit score on applications, eviction rate, late-payment / NSF rate, and stable-employment percentage? A property-management company in the area should have these aggregated.
- How much new for-sale + rental construction is in the pipeline within 1–3 miles? Heavy new supply typically softens prices + rents 12–24 months out; constrained supply supports both.
Investment metrics
- 1% rule
- 1.41% ✓
- Cap rate
- 11.32%
- Cash-on-cash
- 17.96%
- DSCR
- 1.80
- GRM
- 5.9
CMA / ARV
- ARV (median comp)
- $119,824
- List price
- $74,900
- Delta
- -37.49%
- Verdict
- UNDERPRICED
- Comps
- 20 within 1.0 mi
Show comp detail 11 sales within ~0.75 mi
| Address | Dist | Beds/Ba | Sqft | Sold | Price | $/sf | Match |
|---|---|---|---|---|---|---|---|
| 504 E Bell Ave | 0.55mi | 2/1.0 | 1,176 (-2%) | 2mo | $129,500 | $110 | 65 |
| 1314 Hooks St | 0.54mi | 3/2.0 (+1) | 1,232 (+2%) | 1mo | $162,500 | $132 | 64 |
| 1403 Sanders | 0.59mi | 3/2.0 (+1) | 1,206 (+0%) | 5mo | $150,000 | $124 | 63 |
| 107 Thomas St | 0.36mi | 3/1.5 (+1) | 1,107 (-8%) | 3mo | $79,999 | $72 | 60 |
| 406 E Bonham St | 0.60mi | 2/1.0 | 1,200 (-0%) | 16mo | $124,900 | $104 | 55 |
| 1312 Hooks St | 0.54mi | 3/2.0 (+1) | 1,260 (+5%) | 12mo | $195,000 | $155 | 52 |
| 605 S Fair St | 0.45mi | 3/1.0 (+1) | 1,107 (-8%) | 16mo | $69,000 | $62 | 43 |
| 100 J B Mcduff Dr | 0.72mi | 3/2.0 (+1) | 1,199 (-0%) | 22mo | $169,000 | $141 | 43 |
| 109 Amanda Ave | 0.68mi | 3/1.0 (+1) | 1,028 (-14%) | 4mo | $99,000 | $96 | 32 |
| 809 S Cedar St | 0.73mi | 3/1.0 (+1) | 1,158 (-4%) | 23mo | $85,000 | $73 | 31 |
| 102 Mcduff Dr | 0.71mi | 3/1.5 (+1) | 1,064 (-12%) | 20mo | $120,000 | $113 | 24 |
Match score weights: distance 35% · size 25% · config 20% · recency 20%. Top-matched comps best support the ARV.
Projected returns pro-forma
-3.0% appreciation · 3.0% rent growth · sell at horizon
- IRR
- 9.5%
- Equity multiple
- 1.38×
- Total profit
- $7,867
- Equity at exit
- $11,168
- IRR
- 18.7%
- Equity multiple
- 2.56×
- Total profit
- $32,656
- Equity at exit
- $6,476
Cash invested: $20,972 (down + closing). Projections, not guarantees.
Landlord ↔ Tenant lean methodology
- Overall (STATE)
- 87 Strongly Landlord-Friendly
- State Texas
- 87 Strongly Landlord-Friendly · R+5
- County
- — inherits STATE
- City
- — inherits STATE
ZIP-level market 75835
- Home prices YoY
- -15.8%
- Active inventory
- 277
- Price-to-rent
- 5.9×
Monthly cashflow live
- Estimated rent
- $1,055 medium interval (Pro) →
- Mortgage (P&I)
- −$393
- Tax from tax record
- −$96 /mo · $1,148/yr
- Insurance
- −$31
- HOA
- −$0
- Vacancy / Maint / Mgmt
- −$222
- Net cashflow
- $314
Break-even live
Sensitivity live
| Price | -10% $356 | -5% $335 | +0% $314 | +5% $293 | +10% $271 |
|---|---|---|---|---|---|
| Rent | -10% $230 | -5% $272 | +0% $314 | +5% $355 | +10% $397 |
| Rate | -1.0pp $352 | -0.5pp $333 | base $314 | +0.5pp $294 | +1.0pp $275 |
UW: 25.0% down · 7.5% · 30yr · 1.5% tax · 5.0% vac · 8.0% maint · 8.0% mgmt
Financing live
Cash to close
- Down payment
- $18,725
- Closing costs
- $2,247
- Reserves months
- —
- Total cash needed
- —
Loan-product check · same deal, 3 products live
Conventional
25% down · 7.5% · 30yr
- Down + closing
- —
- Monthly P&I
- —
- Monthly cashflow
- —
- DSCR
- —
- Eligible?
- —
Personal DTI + credit; lowest rate.
DSCR
20% down · 8.5% · 30yr
- Down + closing
- —
- Monthly P&I
- —
- Monthly cashflow
- —
- DSCR
- —
- Eligible?
- —
No personal income docs; deal must DSCR.
Hard money
10% down · 12.0% · 12mo
- Down + closing
- —
- Monthly P&I
- —
- Monthly cashflow
- —
- DSCR
- —
- Eligible?
- —
Short-term bridge; refi at stabilization.
Rent comps 3 comps
| Address | Beds | Baths | Sqft | Rent | $/sqft | DOM | Units | Dist |
|---|---|---|---|---|---|---|---|---|
| 108 N Gordon Dr Unit A Crockett, TX | 2.0 | 1.0 | 980 | $900 | $0.92 | 44d | 1 | 1.08mi |
| 705 E Runnells Ave Crockett, TX | 1.0 | 1.0 | 841 | $1,000 | $1.19 | 44d | 1 | 1.21mi |
| 2109 E Goliad Ave Crockett, TX | 2.0 | 1.0 | 1348 | $1,300 | $0.96 | 44d | 1 | 1.47mi |
Listing history 16 events
-
2026-06-21days on market $74,900 Active 96 DOM
-
2026-06-18days on market $74,900 Active 94 DOM
-
2026-06-17days on market $74,900 Active 93 DOM
-
2026-06-16days on market $74,900 Active 92 DOM
-
2026-06-15days on market $74,900 Active 91 DOM
-
2026-06-13days on market $74,900 Active 89 DOM
-
2026-06-12days on market $74,900 Active 88 DOM
-
2026-06-09days on market $74,900 Active 85 DOM
-
2026-06-08days on market $74,900 Active 84 DOM
-
2026-06-08days on market $74,900 Active 83 DOM
-
2026-06-07days on market $74,900 Active 82 DOM
-
2026-06-03days on market $74,900 Active 79 DOM
-
2026-06-02days on market $74,900 Active 78 DOM
-
2026-06-01days on market $74,900 Active 77 DOM
-
2026-05-31days on market $74,900 Active 76 DOM
-
2026-03-17$74,900 Active 533-char remark
Show marketing remark (533 chars)
This 2-bedroom, 2-bath home offers plenty of potential for a first-time homebuyer, investor, or someone looking to downsize. The carport has been converted into a versatile space that could serve as a den, game room, or additional living area. Situated on a spacious lot with large, mature trees, the property is conveniently located near a local park and baseball field, offering a pleasant neighborhood setting. While the home does need some repairs, it presents a wonderful opportunity to add your personal touch and build equity.
ⓘ Source: listings_history table (triggers on properties + properties_extension) + one-shot
backfill from property_details.listing_events for pre-trigger history.
Tax reassessment forecast TX · Resets to sale price
- Current annual tax
- $1,148 · $96/mo
- Projected year-2 tax
- $1,371 · $114/mo
- Expected delta
- +$223/yr (+$19/mo · 19.4%)
ⓘ Screening estimate from a state-policy table — verify with the county assessor before closing.
Climate risk First Street
- Flood 1/10 Low FEMA zone X (unshaded) · 0% chance over 30 yrs
- Wildfire 5/10 Major
- Heat 8/10 Severe 7 d/yr ≥110°F today · 25 d/yr by 30 yrs out
- Wind 8/10 Severe 80% chance of damaging wind over 30 yrs
- Air quality 1/10 Low 0 unhealthy d/yr today · 0 by 30 yrs out
Nearby sold comps map
Loading sold comps map…
Walkable amenities ~0.75 mi
Loading nearby amenities…
Taxation est. · year 1
- Rental income
- $12,660
- − Mortgage interest
- −$4,196
- − Property taxes
- −$1,148
- − Insurance
- −$374
- − Repairs & maintenance
- −$1,013
- − Management
- −$1,013
- − Depreciation
- −$2,179
- Taxable income
- $2,738
- Est. tax owed @ 24.0%
- −$657
- After-tax cash flow
- $3,109/yr
For passive investors: Depreciation is non-cash, so a rental often shows a tax loss while cash-flowing — sheltering income. Rental losses are passive: they offset passive income freely, and up to $25,000/yr can offset ordinary (W-2) income if you actively participate and your MAGI is under $100k (phasing out to $0 by $150k); unused losses carry forward. On sale, claimed depreciation is recaptured at up to 25%, and gains may owe capital-gains tax (a 1031 exchange can defer both). Figures are a year-1 estimate at your 24.0% rate — not tax advice; consult a CPA.
Schools (NCES district)
- District
- Crockett ISD
- NCES district ID
- 4815720
- Math proficiency
- 22% ▬ 0.00%
- Reading proficiency
- 28% ▲ 1.00%
- Median HH income
- $26,917
- Composite
- 19.83/100
- National rank
- #8699
- State rank
- #736 of 826 in TX
Livability — Crockett
- Score
- 61/100
- State rank
- #1005
- US rank
- #17855
Category grades
Schools grade is shown separately in the Schools card above.
Census & demographics
- Census place
- Crockett, TX
- Population (ZIP)
- 11,805
Population outlook (Houston County) Hauer SSP2
- Today (2025)
- 21,269 people
- By 2030
- 20,568 · -3.3%
- By 2040
- 19,255 · -9.5%
- By 2050
- 17,980 · -15.5%
- By 2075
- 15,214 · -28.5%
- By 2100
- 11,720 · -44.9%
Race, ethnicity, and origin ACS 2023
- Neighborhood character
- Diverse neighborhood (Simpson 0.61)
- Race & ethnicity
- White 55% Black 25% Hispanic / Latino 17% Two or more races 9%
- Hispanic origin (detail)
- Mexican 15%
- Common ancestry
- Lithuanian 3% Romanian 1% Slovak 1%
- Foreign-born
- 4% · Canada
- Languages at home
- 89% English-only · Spanish 10%
Political lean MEDSL · Houston
- 2024 margin
- Solid R (+55.4) · D 22.1% · R 77.4%
- 2008→2024 swing
- -18.1pp toward R · 2008: -37.3pp · 2024: -55.4pp
- All cycles
- 2024: R+55.4 2020: R+50.3 2016: R+50.9 2012: R+44.3 2008: R+37.3
Not yet ingested
- Civics
- —
Market trends
- HPI YoY
- ▼ -28.03%
- Current HPI
- 149.4937
- Rent YoY
- —
- Metro
- —
- State GDP YoY
- ▲ 3.95%
- F500 in state
- 110
Industry mix (Fortune 500 HQ in TX)
| Industry | F500 HQs | Revenue |
|---|---|---|
| Energy | 16 | $1,198B |
|
||
| Technology | 5 | $198B |
|
||
| Engineering / Construction | 4 | $72B |
|
||
| Energy Services | 3 | $60B |
|
||
| Utilities | 3 | $41B |
|
||
| Healthcare | 2 | $330B |
|
||
Price history
1 event — show timeline
- 2026-03-17 Listed $74,900 GTAR
Property tax history
+5.3%/yrLatest (2025): $1,148 · +10.1% YoY. Source: county tax records.
Cash-flow waterfall
monthlySold comps — $/sqft
last 12 mo · ≤1 miLoading sold comps…