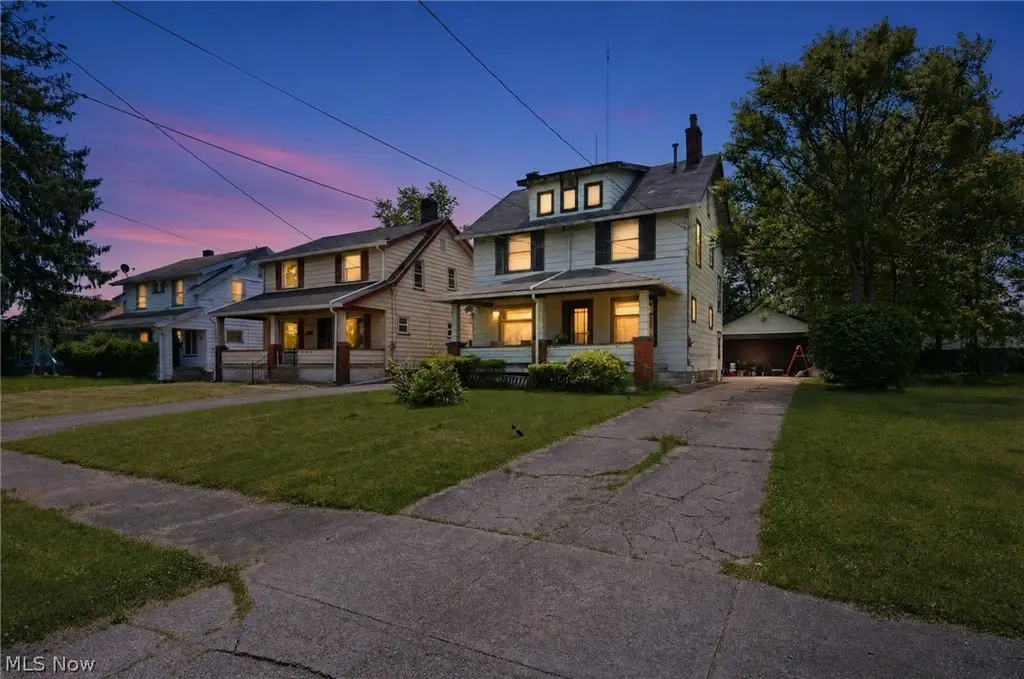
347 E Judson Ave · Youngstown, OH
Flood risk 1/10 · Minimal
- FEMA flood zone
- X (unshaded)
- Chance of flooding over 30 yrs
- 0.0%
- Est. flood insurance / yr
- $473 – $860
Fire risk 1/10 · Minimal
- Est. fire insurance / yr
- $713 – $1,323
Heat risk 3/10 · Minor
- Hot days now (above 97°F)
- 7 days/yr
- Hot days in 30 yrs
- 17 days/yr
Wind risk 1/10 · Minimal
- Chance of severe wind over 30 yrs
- —
Air-quality risk 3/10 · Minor
- Unhealthy air days now
- 1 days/yr
- Unhealthy air days in 30 yrs
- 4 days/yr
Risk factors via First Street. Map © Google.
Why this score? — see what drove the B grade
The composite is a weighted blend of 9 inputs, each scored 0–100. Each bar is that input's sub-score; the figure is the points it added to the 100-point composite (weight × sub-score).
- Cash flow +27.8/30.0
- ARV discount +15.0/15.0
- DSCR +9.8/10.0
- 1% rule +6.6/10.0
- Appreciation +4.6/10.0
- Livability +4.0/5.0
- Rent growth +2.5/5.0
- Condition / age +2.5/5.0
- Schools +0.9/10.0
$104,999
🖨 Deal sheet 📄 Offer letter ✓ Due diligence
Listing remarks MLS
Lovely, well maintained, spacious and Move-In ready 5 bedroom 3 bath larger home on the Southside. Home features hardwood floors, Large livingroom and diningroom with builit-ins on main floor including a full bathroom and the spacious Kitchen with an eat in area. Upstairs features a 2 full bathrooms, 4 -5 bedrooms with large closets. The attic is an additional living suite/bedroom with its own bathroom. (Finished Attic sq footage not included in auditors total sq footage. ) The Basement is an open slate with great storage space, laundry area with maintained mechanicals. Enjoy relaxing time on the front porch or in backyard. Make your appointment today! As-Is, Seller makes no guarantees or warranties.
Key facts
- Solid foundation
- Outdoor enjoyment
- Convenient location
Tags
Property features AI
Finance
- Financial info: Pets allowed
Exterior
- Parking: Detached garage (2 car spaces)
- Utilities: Public water; Public sewer
- Home design: 3 stories; Aluminum siding; Asphalt roof
- Construction: Aluminum siding construction; Asphalt roof; Below-grade finished area; Above-grade finished area
- Exterior features: City lot; Less than half-acre lot; Lot dimensions approximately 45 x 130
Interior
- Kitchen: Eat-in kitchen (appliances not specified)
- Bedrooms: 3 main-level bedrooms
- Bathrooms: 3 full bathrooms
- Heating & cooling: Forced air heating (gas); Central air conditioning; Ceiling fans; Window units
- Interior features: Built-in features; Eat-in kitchen; Decorative fireplace in the living room; Full, unfinished basement with storage space
- Laundry & utility: Laundry area in basement
Neighborhood map
What this means for you Summary
Snapshot
- This is a 5-bed/3.0-bath single-family listed at $105k.
Deal economics
- At list price, monthly cash flow is $322 ($4k/yr) — positive.
- The deal already cash-flows at list — no discount required.
- Meets the 1% rule at list price ($1k rent vs $105k).
- Cap rate 10.0% vs local median 7.0% in Youngstown — top-decile yield for the area; either an underpriced asset or a hidden risk that comps aren't pricing in. Stress-test before assuming the spread holds.
Location & tenants
- Location reads 81/100 on livability (#99 in OH, #1,506 nationally) — a professional / high-income tenant draw. Strengths: amenities A+, commute A+, cost of living A+; Watch: crime F, employment F.
- Youngstown City (urban): math 8% / reading 17% proficiency, ranked #649 of 656 in OH (top 99%) — low school quality limits family demand, transient renter base, plan for 1-2y turnover; 88% free/reduced lunch — lower-income household profile, screen leases tightly.
- Market conditions: 28 active listings in the ZIP; 3 comparable units currently listed for rent nearby; rentals at typical pace (median 21d on market — plan ~3-4 weeks tenant-placement turnaround); lower-income renter base — watch delinquency; 147 units permitted in Mahoning County in 2024 (0 in 5+ unit buildings).
- At $1,213/mo this rent would consume 57% of the median local household income ($26k/yr) (locally 17% of renters already pay >50% of income on rent) — very limited rent-growth headroom before tenants either downsize or default.
Forward outlook
- Local home prices are declining (-0.8%/yr); year-one equity from $726 of loan paydown is wiped out by about $868 of value loss. Plan a longer hold.
- Mahoning County population projected at -14% by 2050 — secular population decline; favor cash flow + early exit over multi-decade hold.
- At projected returns (-0.8% appreciation + 3.0% rent growth), your $29k cash investment doubles in ~7 years — after that, you're playing with house money.
Negotiation context
- Only 11 days on market — expect competitive offers; lowballing is unlikely to land.
- 6 sale attempts since 34y ago with the ask held roughly flat each time — persistent listings suggest the price (not the market) is what's stuck; bring a comps-based counter.
- Current owner paid $90k; 17% above their basis — modest negotiation headroom, anchor on the comps not their cost.
Risks & watch-outs
- Watch-outs: built in 1922 — expect roof / HVAC / electrical / plumbing capex.
Questions for the listing agent
- Built in 1922 — when were the roof, HVAC, electrical panel, plumbing, and water heater last replaced?
- Is there a deadline driving the sale (1031 exchange, divorce, estate, relocation)? That informs how much negotiation room exists.
- Crime grade is F in this area — have there been break-ins, vandalism, or insurance claims at this property in the last 3 years? What carrier currently insures it and at what premium?
- What's the average days-on-market for RENTAL listings here right now (not sales)? A rising rental-DOM trend means longer vacancies and softer asking-rent achievability than the comps imply.
- What's the recent tenant-quality profile in this submarket — average credit score on applications, eviction rate, late-payment / NSF rate, and stable-employment percentage? A property-management company in the area should have these aggregated.
- How much new for-sale + rental construction is in the pipeline within 1–3 miles? Heavy new supply typically softens prices + rents 12–24 months out; constrained supply supports both.
Investment metrics
- 1% rule
- 1.16% ✓
- Cap rate
- 9.97%
- Cash-on-cash
- 13.13%
- DSCR
- 1.58
- GRM
- 7.2
CMA / ARV
- ARV (on-the-fly)
- $132,634
- Comps found
- 9
Show comp detail 9 sales within ~0.75 mi
| Address | Dist | Beds/Ba | Sqft | Sold | Price | $/sf | Match |
|---|---|---|---|---|---|---|---|
| 3919 Rush Blvd | 0.17mi | 4/2.0 (-1) | 1,510 (-6%) | 3mo | $154,000 | $102 | 72 |
| 228 Lowell Ave | 0.41mi | 4/3.0 (-1) | 1,551 (-3%) | 20mo | $128,000 | $83 | 55 |
| 4019 Euclid Blvd | 0.25mi | 4/2.0 (-1) | 1,776 (+11%) | 10mo | $169,950 | $96 | 52 |
| 190 Lowell Ave | 0.46mi | 4/2.5 (-1) | 1,522 (-5%) | 15mo | $40,000 | $26 | 51 |
| 72 Labelle Ave | 0.58mi | 4/1.5 (-1) | 1,716 (+7%) | 1mo | $40,100 | $23 | 49 |
| 354 E Indianola Ave | 0.71mi | 4/1.5 (-1) | 1,552 (-3%) | 13mo | $65,000 | $42 | 40 |
| 177 Wychwood Ln | 0.64mi | 4/2.0 (-1) | 1,660 (+4%) | 20mo | $165,000 | $99 | 38 |
| 204 Berkshire Ave | 0.62mi | 4/1.5 (-1) | 1,463 (-8%) | 10mo | $150,000 | $103 | 38 |
| 4307 Rush Blvd | 0.48mi | 4/1.5 (-1) | 1,796 (+12%) | 15mo | $114,050 | $64 | 33 |
Match score weights: distance 35% · size 25% · config 20% · recency 20%. Top-matched comps best support the ARV.
Projected returns pro-forma
-0.83% appreciation · 3.0% rent growth · sell at horizon
- IRR
- 10.0%
- Equity multiple
- 1.45×
- Total profit
- $13,370
- Equity at exit
- $26,217
- IRR
- 15.9%
- Equity multiple
- 2.61×
- Total profit
- $47,288
- Equity at exit
- $28,280
Cash invested: $29,400 (down + closing). Projections, not guarantees.
Landlord ↔ Tenant lean methodology
- Overall (STATE)
- 73 Landlord-Friendly
- State Ohio
- 73 Landlord-Friendly · R+6
- County
- — inherits STATE
- City
- — inherits STATE
ZIP-level market 44507
- Home prices YoY
- -0.3%
- Active inventory
- 28
- Price-to-rent
- 7.2×
Monthly cashflow live
- Estimated rent
- $1,213 medium interval (Pro) →
- Mortgage (P&I)
- −$551
- Tax from tax record
- −$42 /mo · $508/yr
- Insurance
- −$44
- HOA
- −$0
- Vacancy / Maint / Mgmt
- −$255
- Net cashflow
- $322
Break-even live
UW: 25.0% down · 7.5% · 30yr · 1.5% tax · 5.0% vac · 8.0% maint · 8.0% mgmt
Financing live
Cash to close
- Down payment
- $26,250
- Closing costs
- $3,150
- Reserves months
- —
- Total cash needed
- —
Loan-product check · same deal, 3 products live
Conventional
25% down · 7.5% · 30yr
- Down + closing
- —
- Monthly P&I
- —
- Monthly cashflow
- —
- DSCR
- —
- Eligible?
- —
Personal DTI + credit; lowest rate.
DSCR
20% down · 8.5% · 30yr
- Down + closing
- —
- Monthly P&I
- —
- Monthly cashflow
- —
- DSCR
- —
- Eligible?
- —
No personal income docs; deal must DSCR.
Hard money
10% down · 12.0% · 12mo
- Down + closing
- —
- Monthly P&I
- —
- Monthly cashflow
- —
- DSCR
- —
- Eligible?
- —
Short-term bridge; refi at stabilization.
Rent comps 3 comps
| Address | Beds | Baths | Sqft | Rent | $/sqft | DOM | Units | Dist |
|---|---|---|---|---|---|---|---|---|
| 236 Hilton Ave Youngstown, OH | 4.0 | 1.5 | 1488 | $1,195 | $0.80 | 21d | 1 | 0.18mi |
| 540 Cameron Ave Youngstown, OH | 4.0 | 2.0 | 1780 | $1,300 | $0.73 | 21d | 1 | 1.07mi |
| 3446 Ambert Ave Youngstown, OH | 4.0 | 1.0 | 1100 | $1,250 | $1.14 | 13d | 1 | 1.27mi |
Listing history 10 events
-
2026-06-19days on market $104,999 Active 11 DOM
-
2026-06-18days on market $104,999 Active 10 DOM
-
2026-06-17days on market $104,999 Active 9 DOM
-
2026-06-16days on market $104,999 Active 8 DOM
-
2026-06-15days on market $104,999 Active 7 DOM
-
2026-06-14days on market $104,999 Active 5 DOM
-
2026-06-13days on market $104,999 Active 4 DOM
-
2026-06-10days on market $104,999 Active 2 DOM
-
2026-06-09remarks 692-char remark
-
2026-06-09$104,999 Active 1 DOM
ⓘ Source: listings_history table (triggers on properties + properties_extension) + one-shot
backfill from property_details.listing_events for pre-trigger history.
Tax reassessment forecast OH · Partial reset (capped growth)
- Current annual tax
- $508 · $42/mo
- Projected year-2 tax
- $1,073 · $89/mo
- Expected delta
- +$565/yr (+$47/mo · 111.3%)
ⓘ Screening estimate from a state-policy table — verify with the county assessor before closing.
Climate risk First Street
- Flood 1/10 Low FEMA zone X (unshaded) · 0% chance over 30 yrs
- Wildfire 1/10 Low
- Heat 3/10 Moderate 7 d/yr ≥97°F today · 17 d/yr by 30 yrs out
- Wind 1/10 Low
- Air quality 3/10 Moderate 1 unhealthy d/yr today · 4 by 30 yrs out
Nearby sold comps map
Loading sold comps map…
Walkable amenities ~0.75 mi
Loading nearby amenities…
Taxation est. · year 1
- Rental income
- $14,559
- − Mortgage interest
- −$5,882
- − Property taxes
- −$508
- − Insurance
- −$525
- − Repairs & maintenance
- −$1,165
- − Management
- −$1,165
- − Depreciation
- −$3,055
- Taxable income
- $2,260
- Est. tax owed @ 24.0%
- −$543
- After-tax cash flow
- $3,319/yr
For passive investors: Depreciation is non-cash, so a rental often shows a tax loss while cash-flowing — sheltering income. Rental losses are passive: they offset passive income freely, and up to $25,000/yr can offset ordinary (W-2) income if you actively participate and your MAGI is under $100k (phasing out to $0 by $150k); unused losses carry forward. On sale, claimed depreciation is recaptured at up to 25%, and gains may owe capital-gains tax (a 1031 exchange can defer both). Figures are a year-1 estimate at your 24.0% rate — not tax advice; consult a CPA.
Schools (NCES district)
- District
- Youngstown City
- NCES district ID
- 3904516
- Math proficiency
- 8% ▼ -15.00%
- Reading proficiency
- 17% ▼ -10.00%
- Median HH income
- $25,257
- Composite
- 9.29/100
- National rank
- #9858
- State rank
- #649 of 656 in OH
Livability — Youngstown
- Score
- 81/100
- State rank
- #99
- US rank
- #1506
Category grades
Schools grade is shown separately in the Schools card above.
Census & demographics
- Census place
- Youngstown, OH
- County
- Mahoning · 224,175 people
- City population
- 28,503
- Metro
- Youngstown-Warren, OH
- Population (ZIP)
- 4,402
- Household income
- $25,767
- Rent vs Own
- Severe rent burden
- 17.1
Population outlook (Mahoning County) Hauer SSP2
- Today (2025)
- 223,932 people
- By 2030
- 218,387 · -2.5%
- By 2040
- 205,367 · -8.3%
- By 2050
- 193,606 · -13.5%
- By 2075
- 173,694 · -22.4%
- By 2100
- 151,147 · -32.5%
Race, ethnicity, and origin ACS 2023
- Neighborhood character
- Diverse neighborhood (Simpson 0.58)
- Race & ethnicity
- Black 60% White 20% Hispanic / Latino 12% Two or more races 10%
- Hispanic origin (detail)
- Puerto Rican 10%
- Common ancestry
- Subsaharan African 2% Hispanic 2% Romanian 1%
- Foreign-born
- 3% · Canada
- Languages at home
- 89% English-only · Spanish 10%
Political lean MEDSL · Mahoning
- 2024 margin
- Lean R (+9.4) · D 44.9% · R 54.4%
- 2008→2024 swing
- -36.1pp toward R · 2008: 26.6pp · 2024: -9.4pp
- All cycles
- 2024: R+9.4 2020: R+1.9 2016: D+3.0 2012: D+27.7 2008: D+26.6
Not yet ingested
- Civics
- —
Market trends
- HPI YoY
- ▼ -0.83%
- Current HPI
- 282.496
- Rent YoY
- —
- Metro
- —
- State GDP YoY
- ▲ 1.98%
- F500 in state
- 48
Industry mix (Fortune 500 HQ in OH)
| Industry | F500 HQs | Revenue |
|---|---|---|
| Insurance | 3 | $145B |
|
||
| Industrial Machinery | 3 | $49B |
|
||
| Financial Services | 3 | $24B |
|
||
| Consumer Goods | 2 | $93B |
|
||
| Aerospace / Defense | 2 | $47B |
|
||
| Utilities | 2 | $33B |
|
||
Price history
+163.2% since first listed14 events — show timeline
- 2026-06-08 Listed $104,999 MLSNOW
- 2025-02-19 Sold (Public Records) $90,000 Public Records
- 2025-02-18 Sold (MLS) $90,000 MLSNOW
- 2025-02-07 Pending — MLSNOW
- 2025-01-18 Relisted — MLSNOW
- 2024-12-19 Pending — MLSNOW
- 2024-11-23 Contingent — MLSNOW
- 2024-09-29 Listed $94,900 MLSNOW
- 2005-03-28 Sold (Public Records) $25,500 Public Records
- 2005-03-22 Sold (MLS) $25,500 MLSNOW
- 2004-08-13 Listed $34,900 MLSNOW
- 1995-08-08 Listed $38,900 MLSNOW
- 1993-02-12 Listing Removed — MLSNOW
- 1992-08-12 Listed $39,900 MLSNOW
Property tax history
+1.2%/yrLatest (2025): $508 · -11.8% YoY. Source: county tax records.
Cash-flow waterfall
monthlySold comps — $/sqft
last 12 mo · ≤1 miLoading sold comps…