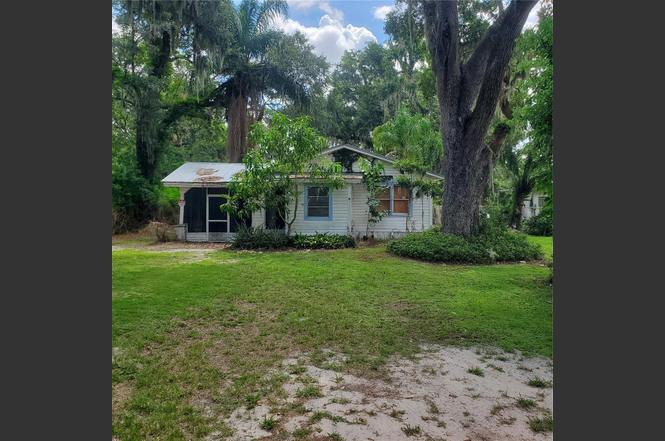
949 Lake St · Lake Hamilton, FL
Flood risk 1/10 · Minimal
- FEMA flood zone
- X (unshaded)
- Chance of flooding over 30 yrs
- 0.0%
- Est. flood insurance / yr
- $507 – $1,088
Fire risk 4/10 · Minor
- Est. fire insurance / yr
- $947 – $1,759
Heat risk 8/10 · Major
- Hot days now (above 108°F)
- 7 days/yr
- Hot days in 30 yrs
- 21 days/yr
Wind risk 9/10 · Severe
- Chance of severe wind over 30 yrs
- 99.0%
Air-quality risk 1/10 · Minimal
- Unhealthy air days now
- 0 days/yr
- Unhealthy air days in 30 yrs
- 0 days/yr
Risk factors via First Street. Map © Google.
Why this score? — see what drove the C- grade
The composite is a weighted blend of 9 inputs, each scored 0–100. Each bar is that input's sub-score; the figure is the points it added to the 100-point composite (weight × sub-score).
- Cash flow +17.1/30.0
- ARV discount +7.5/15.0
- Appreciation +5.7/10.0
- DSCR +5.3/10.0
- 1% rule +4.6/10.0
- Schools +3.5/10.0
- Livability +3.3/5.0
- Rent growth +2.5/5.0
- Condition / age +2.5/5.0
$189,000
🖨 Deal sheet 📄 Offer letter ✓ Due diligence
Listing remarks
1. No HOA. 2. New Roof-Summer-2025. 3. Curtis Campbell is my Brother. 4. This Mid-Century home is the very definition of: Fixer-Upper. 5. This Bungalow was built in the 1940's and is ready to be Up-Dated and Modernized. 6. If you love the challenge of Home Improvement and have a Stylish Eye, this may be the Opportunity that you are looking for. 7. The Seller may consider Financing. 8. Call me to Schedule a Viewing.
Key facts
- No hoa
- Fixer-upper
- 0.35 acre lot
Tags
Property features AI
Finance
- Other: Living area reported as 1,128 (public records); total building area reported as 1,510; Lot size about 0.35 acres (0.25–0.5 range); Vegetation includes fruit trees and oak trees
- Financial info: No investor or income/expense details provided
- HOA & community: Not in a development; No association indicated
Exterior
- Parking: No parking features listed
- Utilities: Electricity available; Water available; Water source: canal/lake for irrigation; Sewer: other
- Home design: Single family residence; One story; Faces west; On waterfront with lake view and access (Lake Sara), approximately 36 feet of lake frontage
- Construction: Vinyl siding and frame construction; Metal roof; Pillar/Post/Pier foundation; Built as a residence (year built not provided)
- Exterior features: Screened patio/porch; Chain link fencing; Other exterior features; City limits lot; Irregular lot; Paved road access; Publicly maintained road
Interior
- Kitchen: No appliances listed
- Bedrooms: 3 bedrooms
- Flooring: Linoleum; Tile; Vinyl; Wood
- Bathrooms: 1 full bathroom
- Heating & cooling: No heating listed; No cooling listed
- Interior features: No notable interior features listed; 11 total rooms
- Laundry & utility: No laundry features listed
Neighborhood map
What this means for you Summary
Snapshot
- This is a 3-bed/1.0-bath single-family listed at $189k.
Deal economics
- At list price, monthly cash flow is $133 ($2k/yr) — positive.
- The deal already cash-flows at list — no discount required.
- To meet the 1% rule (rent ≥ 1% of price), the offer needs to be $182k (3.6% below list).
- Recommended offer: $172k (9.0% below list) — sets the bar for market timing.
Location & tenants
- Location reads 66/100 on livability (#591 in FL) — a middle-class / working-renter tenant base. Strengths: cost of living A+, housing A+, health & safety A; Watch: employment D, schools F, amenities F.
- Polk (suburban): math 39% / reading 43% proficiency, ranked #62 of 73 in FL (top 85%) — families likely to look elsewhere, expect single-tenant / working-renter base with shorter leases.
- Market conditions: 137 active listings in the ZIP; 5 comparable units currently listed for rent nearby; rentals at typical pace (median 24d on market — plan ~3-4 weeks tenant-placement turnaround); 10,384 units permitted in Polk County in 2024 (1,716 in 5+ unit buildings).
Forward outlook
- In year one you build about $4k of equity ($1k loan paydown + $3k appreciation (1.4% local appreciation)).
- Polk County population projected at +33% by 2050 — long-run rental-demand tailwind backs the buy-and-hold thesis.
- At projected returns (1.4% appreciation + 3.0% rent growth), your $53k cash investment doubles in ~8 years — after that, you're playing with house money.
- By year 8, paydown + projected appreciation supports a ~$31k cash-out refi (75% LTV) — recoverable capital for the next deal without selling this one.
Negotiation context
- It's been on market 118 days — a 9% lower offer ($172k) is reasonable based on typical stale-listing flexibility.
- 8 sale attempts since 15y ago with the ask held roughly flat each time — persistent listings suggest the price (not the market) is what's stuck; bring a comps-based counter.
- Current owner paid $45k; list at $189k implies a 320% gain — meaningful room to come down on a strong offer.
Risks & watch-outs
- Watch-outs: built in 1946 — expect roof / HVAC / electrical / plumbing capex.
- Climate carrying-cost: severe wind risk, 99% chance of damaging wind over 30y; extreme-heat days projected 7→21/yr by 2055 (HVAC capex compounding) — expect insurance premiums to compound above CPI over the hold.
Questions for the listing agent
- It's been on market 118 days. Have you received any prior offers? Is the seller open to a 9% concession, seller financing, or rate buy-down credit?
- Built in 1946 — when were the roof, HVAC, electrical panel, plumbing, and water heater last replaced?
- Why hasn't it sold? Are there any deal-killer items the seller is aware of (foundation, flood, title, zoning, code violations)?
- Is there a deadline driving the sale (1031 exchange, divorce, estate, relocation)? That informs how much negotiation room exists.
- Schools are F-rated, which usually means shorter tenancies and higher turnover. Who's the typical renter profile here, and what's been the actual vacancy rate?
- What's the average days-on-market for RENTAL listings here right now (not sales)? A rising rental-DOM trend means longer vacancies and softer asking-rent achievability than the comps imply.
- What's the recent tenant-quality profile in this submarket — average credit score on applications, eviction rate, late-payment / NSF rate, and stable-employment percentage? A property-management company in the area should have these aggregated.
- How much new for-sale + rental construction is in the pipeline within 1–3 miles? Heavy new supply typically softens prices + rents 12–24 months out; constrained supply supports both.
Investment metrics
- 1% rule
- 0.96% ✗
- Cap rate
- 7.13%
- Cash-on-cash
- 3.01%
- DSCR
- 1.13
- GRM
- 8.6
CMA / ARV
No comps found within radius.
Projected returns pro-forma
1.45% appreciation · 3.0% rent growth · sell at horizon
- IRR
- 5.9%
- Equity multiple
- 1.31×
- Total profit
- $16,158
- Equity at exit
- $68,940
- IRR
- 9.7%
- Equity multiple
- 2.24×
- Total profit
- $65,755
- Equity at exit
- $95,135
Cash invested: $52,920 (down + closing). Projections, not guarantees.
Landlord ↔ Tenant lean methodology
- Overall (STATE)
- 87 Strongly Landlord-Friendly
- State Florida
- 87 Strongly Landlord-Friendly · R+3
- County
- — inherits STATE
- City
- — inherits STATE
ZIP-level market 33851
- Home prices YoY
- 0.4%
- Active inventory
- 137
- Price-to-rent
- 8.6×
Monthly cashflow live
- Estimated rent
- $1,821 high interval (Pro) →
- Mortgage (P&I)
- −$991
- Tax est. 1.5%
- −$236 /mo · $2,835/yr
- Insurance
- −$79
- HOA
- −$0
- Vacancy / Maint / Mgmt
- −$382
- Net cashflow
- $133
Break-even live
UW: 25.0% down · 7.5% · 30yr · 1.5% tax · 5.0% vac · 8.0% maint · 8.0% mgmt
Financing live
Cash to close
- Down payment
- $47,250
- Closing costs
- $5,670
- Reserves months
- —
- Total cash needed
- —
Loan-product check · same deal, 3 products live
Conventional
25% down · 7.5% · 30yr
- Down + closing
- —
- Monthly P&I
- —
- Monthly cashflow
- —
- DSCR
- —
- Eligible?
- —
Personal DTI + credit; lowest rate.
DSCR
20% down · 8.5% · 30yr
- Down + closing
- —
- Monthly P&I
- —
- Monthly cashflow
- —
- DSCR
- —
- Eligible?
- —
No personal income docs; deal must DSCR.
Hard money
10% down · 12.0% · 12mo
- Down + closing
- —
- Monthly P&I
- —
- Monthly cashflow
- —
- DSCR
- —
- Eligible?
- —
Short-term bridge; refi at stabilization.
Rent comps 5 comps
| Address | Beds | Baths | Sqft | Rent | $/sqft | DOM | Units | Dist |
|---|---|---|---|---|---|---|---|---|
| 2912 poppy ave, Lake Hamilton, FL | 3.0 | 2.0 | 1401 | $1,925 | $1.37 | 23d | 1 | 0.58mi |
| 1007 N Tangerine St Haines City, FL | 3.0 | 3.0 | 1200 | $1,700 | $1.42 | 23d | 1 | 1.23mi |
| 401 Pearl St Lake Hamilton, FL | 2.0 | 2.0 | 900 | $1,500 | $1.67 | 3d | 1 | 1.33mi |
| 2240 Crown Rock Bluff Dr Lake Hamilton, FL | 3.0 | 2.0 | 1486 | $1,999 | $1.35 | 14d | 1 | 1.38mi |
| 2405 Bluestone Rd Lake Hamilton, FL | 3.0 | 2.0 | 1487 | $1,900 | $1.28 | 23d | 1 | 1.40mi |
Listing history 13 events
-
2026-06-18days on market $189,000 Active 118 DOM
-
2026-06-17days on market $189,000 Active 117 DOM
-
2026-06-16days on market $189,000 Active 116 DOM
-
2026-06-15days on market $189,000 Active 115 DOM
-
2026-06-13days on market $189,000 Active 113 DOM
-
2026-06-10days on market $189,000 Active 110 DOM
-
2026-06-09days on market $189,000 Active 109 DOM
-
2026-06-08days on market $189,000 Active 108 DOM
-
2026-06-07days on market $189,000 Active 107 DOM
-
2026-06-05days on market $189,000 Active 104 DOM
-
2026-06-03days on market $189,000 Active 102 DOM
-
2026-06-01days on market $189,000 Active 101 DOM
-
2026-05-31days on market $189,000 Active 100 DOM
ⓘ Source: listings_history table (triggers on properties + properties_extension) + one-shot
backfill from property_details.listing_events for pre-trigger history.
Climate risk First Street
- Flood 1/10 Low FEMA zone X (unshaded) · 0% chance over 30 yrs
- Wildfire 4/10 Moderate
- Heat 8/10 Severe 7 d/yr ≥108°F today · 21 d/yr by 30 yrs out
- Wind 9/10 Extreme 99% chance of damaging wind over 30 yrs
- Air quality 1/10 Low 0 unhealthy d/yr today · 0 by 30 yrs out
Nearby sold comps map
Loading sold comps map…
Walkable amenities ~0.75 mi
Loading nearby amenities…
Taxation est. · year 1
- Rental income
- $21,853
- − Mortgage interest
- −$10,587
- − Property taxes
- −$2,835
- − Insurance
- −$945
- − Repairs & maintenance
- −$1,748
- − Management
- −$1,748
- − Depreciation
- −$5,498
- Taxable loss
- −$1,508
- Est. tax savings @ 24.0%
- +$362
- After-tax cash flow
- $1,953/yr
For passive investors: Depreciation is non-cash, so a rental often shows a tax loss while cash-flowing — sheltering income. Rental losses are passive: they offset passive income freely, and up to $25,000/yr can offset ordinary (W-2) income if you actively participate and your MAGI is under $100k (phasing out to $0 by $150k); unused losses carry forward. On sale, claimed depreciation is recaptured at up to 25%, and gains may owe capital-gains tax (a 1031 exchange can defer both). Figures are a year-1 estimate at your 24.0% rate — not tax advice; consult a CPA.
Schools (NCES district)
- District
- Polk
- NCES district ID
- 1201590
- Math proficiency
- 39% ▼ -11.00%
- Reading proficiency
- 43% ▼ -4.00%
- Median HH income
- $43,979
- Composite
- 34.74/100
- National rank
- #5132
- State rank
- #62 of 73 in FL
Livability — Lake Hamilton
- Score
- 66/100
- State rank
- #591
- US rank
- #11293
Category grades
Schools grade is shown separately in the Schools card above.
Census & demographics
- Census place
- Lake Hamilton, FL
- City population
- 1,109
- Population (ZIP)
- 1,109
Population outlook (Polk County) Hauer SSP2
- Today (2025)
- 752,975 people
- By 2030
- 804,621 · +6.9%
- By 2040
- 906,117 · +20.3%
- By 2050
- 1,000,476 · +32.9%
- By 2075
- 1,197,520 · +59.0%
- By 2100
- 1,271,518 · +68.9%
Race, ethnicity, and origin ACS 2023
- Neighborhood character
- Diverse neighborhood (Simpson 0.64)
- Race & ethnicity
- White 49% Hispanic / Latino 29% Asian 20% Two or more races 5%
- Hispanic origin (detail)
- Mexican 10% Puerto Rican 16% Cuban 2% Salvadoran 1%
- Common ancestry
- Lithuanian 1% Romanian 1%
- Foreign-born
- 19% · Canada
- Languages at home
- 55% English-only · Spanish 25% Arabic 20%
Political lean MEDSL · Polk
- 2024 margin
- Strong R (+20.7) · D 39.2% · R 59.9%
- 2008→2024 swing
- -14.6pp toward R · 2008: -6.1pp · 2024: -20.7pp
- All cycles
- 2024: R+20.7 2020: R+14.4 2016: R+14.1 2012: R+6.8 2008: R+6.1
Not yet ingested
- Civics
- —
Market trends
- HPI YoY
- ▲ 1.45%
- Current HPI
- 388.4644
- Rent YoY
- —
- Metro
- —
- State GDP YoY
- ▲ 3.28%
- F500 in state
- 36
Industry mix (Fortune 500 HQ in FL)
| Industry | F500 HQs | Revenue |
|---|---|---|
| Industrial Technology | 2 | $29B |
|
||
| Insurance | 2 | $17B |
|
||
| Retail | 1 | $60B |
|
||
| Technology Distribution | 1 | $58B |
|
||
| Homebuilding | 1 | $35B |
|
||
| Technology Manufacturing | 1 | $35B |
|
||
Price history
+152.0% since first listed15 events — show timeline
- 2026-05-29 Relisted — Stellar MLS as Distributed by MLS Grid
- 2026-05-12 Listing Removed — Stellar MLS as Distributed by MLS Grid
- 2026-02-03 Listed $189,000 Stellar MLS as Distributed by MLS Grid
- 2025-12-30 Listing Removed — Stellar MLS as Distributed by MLS Grid
- 2025-12-04 Listed $189,000 Stellar MLS as Distributed by MLS Grid
- 2025-10-27 Relisted — Stellar MLS as Distributed by MLS Grid
- 2025-10-27 Listing Removed — Stellar MLS as Distributed by MLS Grid
- 2025-10-27 Listing Removed — Stellar MLS as Distributed by MLS Grid
- 2025-10-25 Relisted — Stellar MLS as Distributed by MLS Grid
- 2025-09-30 Listing Removed — Stellar MLS as Distributed by MLS Grid
- 2025-06-30 Listed $239,000 Stellar MLS as Distributed by MLS Grid
- 2014-03-10 Sold (MLS) $45,000 Stellar MLS as Distributed by MLS Grid
- 2014-01-20 Listed $65,000 Stellar MLS as Distributed by MLS Grid
- 2012-04-11 Listing Removed — Stellar MLS as Distributed by MLS Grid
- 2011-07-13 Listed $75,000 Stellar MLS as Distributed by MLS Grid
Cash-flow waterfall
monthlySold comps — $/sqft
last 12 mo · ≤1 miLoading sold comps…