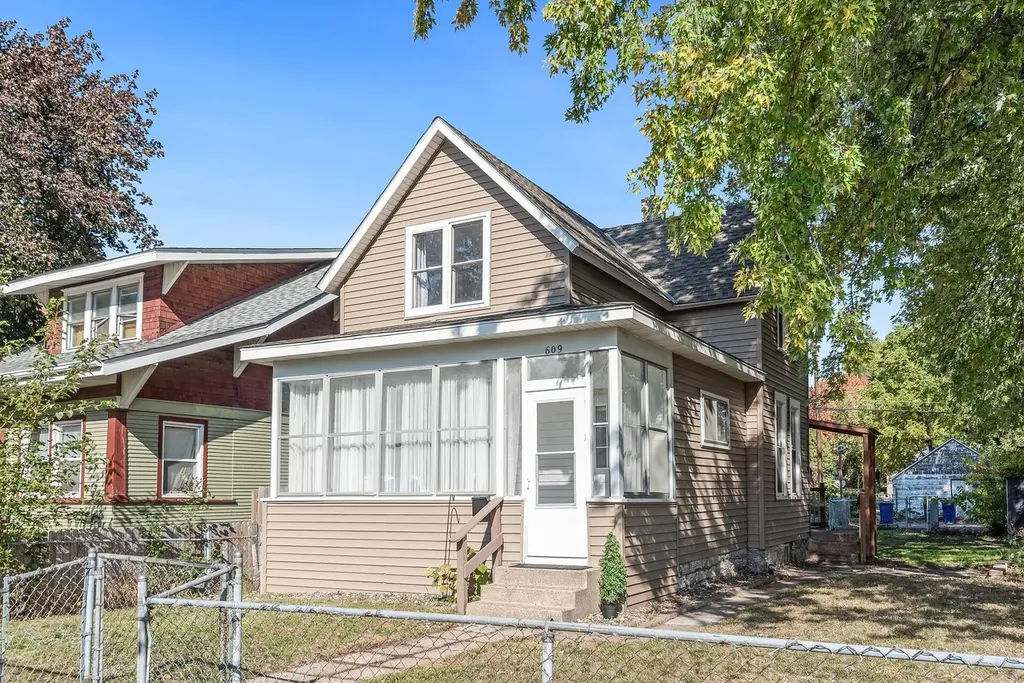
609 Jessamine Ave E · St. Paul, MN
Flood risk 1/10 · Minimal
- FEMA flood zone
- X (unshaded)
- Chance of flooding over 30 yrs
- 0.0%
- Est. flood insurance / yr
- $507 – $1,088
Fire risk 1/10 · Minimal
- Est. fire insurance / yr
- $888 – $1,650
Heat risk 2/10 · Minimal
- Hot days now (above 99°F)
- 7 days/yr
- Hot days in 30 yrs
- 14 days/yr
Wind risk 2/10 · Minimal
- Chance of severe wind over 30 yrs
- —
Air-quality risk 2/10 · Minimal
- Unhealthy air days now
- 1 days/yr
- Unhealthy air days in 30 yrs
- 1 days/yr
Risk factors via First Street. Map © Google.
Why this score? — see what drove the F grade
The composite is a weighted blend of 9 inputs, each scored 0–100. Each bar is that input's sub-score; the figure is the points it added to the 100-point composite (weight × sub-score).
- Cash flow +9.3/30.0
- ARV discount +7.5/15.0
- Rent growth +3.5/5.0
- 1% rule +3.0/10.0
- DSCR +2.6/10.0
- Livability +2.5/5.0
- Condition / age +2.5/5.0
- Schools +2.4/10.0
- Appreciation +0.0/10.0
$190,000
🖨 Deal sheet (PDF) 📄 Offer letter ✓ Due diligence
Listing remarks MLS
Sweet, completely renovated home close to bus and shops. Enter on enclosed porch to living room, dining room, eat-in kitchen with new appliances and main floor laundry. 3 bedrooms and 1 full bath upstairs. Home has clean radiator heat, newer siding, roofing and boiler. Completely fenced yard with raised garden bed and outdoor storage. 3 car paved off-street parking. This is a Charming move-in ready "Doll House"
Key facts
- Lvp on the main
- Newer windows
- Updated lighting
Tags
Property features AI
Finance
- Other: Above-grade finished area and living area listed (see agent for details); Foundations described as 'Other' with foundation dimensions 40 x 16
Exterior
- Parking: Carport; Open parking
- Utilities: City water connected; City sewer connected; Natural gas; 100-amp electrical service with circuit breakers
- Home design: Residential property; Two levels; Three-season porch entry area
- Construction: Stone construction details; Asphalt pitched roof (8 years old or newer); Full basement
- Exterior features: Vinyl exterior; Chain-link fencing; Patio; Porch; Tree coverage (medium); Public transit within ~6 blocks; City street with paved streets, sidewalks, street lights and storm sewer
Interior
- Kitchen: Range; Microwave; Refrigerator; Kitchen window
- Bedrooms: 4 bedrooms total; Upper-level bedrooms include one 15 x 12, one 11 x 8, and one 11 x 10; Main-level bedroom 10 x 9
- Flooring: Hardwood floors; Tile floors
- Bathrooms: One full bathroom on the upper level
- Heating & cooling: Boiler heating; Window air conditioning units
- Interior features: Three-season porch; Separate/formal dining room; Main floor laundry; Washer and dryer hookup; Ceiling fan(s); Natural woodwork; Hardwood and tile floors; Kitchen window; Patio; Porch; Satellite dish; Cable available
- Laundry & utility: Washer; Dryer; Washer/Dryer hookup on main floor
Neighborhood map
What this means for you Summary
Snapshot
- This is a 3-bed/1.0-bath single-family listed at $190k.
Deal economics
- At list price, monthly cash flow is $-138 ($-2k/yr) — negative.
- To cash-flow at today's rent, offer at most $166k (12.8% below list).
- To meet the 1% rule (rent ≥ 1% of price), the offer needs to be $153k (19.6% below list).
- Recommended offer: $153k (19.6% below list) — sets the bar for 1% rule.
Location & tenants
- Location reads: area grade F — affects rentability + tenant quality, not the cash-flow math above.
- St. Paul Public School District (urban): math 21% / reading 33% proficiency, ranked #270 of 301 in MN (top 90%) — low school quality limits family demand, transient renter base, plan for 1-2y turnover; 64% free/reduced lunch — lower-income household profile, screen leases tightly.
- Market conditions: Rents rising (+3.9%/yr); 58 active listings in the ZIP; 1 comparable units currently listed for rent nearby; 1,202 units permitted in Ramsey County in 2024 (880 in 5+ unit buildings).
- This rent runs 34% of the median local income ($54k/yr) — at the standard rent-burdened threshold; future hikes will face affordability resistance.
Forward outlook
- Local home prices are declining (-3.0%/yr); year-one equity from $1k of loan paydown is wiped out by about $6k of value loss. Plan a longer hold.
- Ramsey County population projected at +27% by 2050 — long-run rental-demand tailwind backs the buy-and-hold thesis.
Negotiation context
- It's been on market 16 days — a 2% lower offer ($187k) is reasonable based on typical stale-listing flexibility.
- 8 sale attempts since 10y ago with the ask held roughly flat each time — persistent listings suggest the price (not the market) is what's stuck; bring a comps-based counter.
Risks & watch-outs
- Watch-outs: built in 1890 — expect roof / HVAC / electrical / plumbing capex.
Questions for the listing agent
- What do current leases actually rent for vs. the listed asking? Can we see a recent rent roll and the last 12 months of T-12 income?
- Built in 1890 — when were the roof, HVAC, electrical panel, plumbing, and water heater last replaced?
- Is there a deadline driving the sale (1031 exchange, divorce, estate, relocation)? That informs how much negotiation room exists.
- The area grade is low — what's the realistic commute time and amenity access for the typical tenant pool here? Any planned neighborhood developments (good or bad) we should know about?
- What's the average days-on-market for RENTAL listings here right now (not sales)? A rising rental-DOM trend means longer vacancies and softer asking-rent achievability than the comps imply.
- What's the recent tenant-quality profile in this submarket — average credit score on applications, eviction rate, late-payment / NSF rate, and stable-employment percentage? A property-management company in the area should have these aggregated.
- How much new for-sale + rental construction is in the pipeline within 1–3 miles? Heavy new supply typically softens prices + rents 12–24 months out; constrained supply supports both.
Investment metrics
- 1% rule
- 0.80% ✗
- Cap rate
- 5.42%
- Cash-on-cash
- -3.11%
- DSCR
- 0.86
- GRM
- 10.4
CMA / ARV
No comps found within radius.
Projected returns pro-forma
-3.0% appreciation · 3.94% rent growth · sell at horizon
- IRR
- -20.4%
- Equity multiple
- 0.28×
- Total profit
- $-38,071
- Equity at exit
- $28,330
- IRR
- -11.5%
- Equity multiple
- 0.28×
- Total profit
- $-38,191
- Equity at exit
- $16,428
Cash invested: $53,200 (down + closing). Projections, not guarantees.
Landlord ↔ Tenant lean methodology
- Overall (STATE)
- 46 Balanced
- State Minnesota
- 46 Balanced · D+2
- County
- — inherits STATE
- City
- — inherits STATE
ZIP-level market 55130
- Home prices YoY
- -17.6%
- Rents YoY
- 3.9%
- Active inventory
- 58
- Price-to-rent
- 10.4×
Monthly cashflow live
- Estimated rent
- $1,527 medium interval (Pro) →
- Mortgage (P&I)
- −$996
- Tax from tax record
- −$269 /mo · $3,226/yr
- Insurance
- −$79
- HOA
- −$0
- Vacancy / Maint / Mgmt
- −$321
- Net cashflow
- $-138
Break-even live
Sensitivity live
| Price | -10% $-30 | -5% $-84 | +0% $-138 | +5% $-192 | +10% $-245 |
|---|---|---|---|---|---|
| Rent | -10% $-259 | -5% $-198 | +0% $-138 | +5% $-78 | +10% $-17 |
| Rate | -1.0pp $-42 | -0.5pp $-90 | base $-138 | +0.5pp $-187 | +1.0pp $-237 |
UW: 25.0% down · 7.5% · 30yr · 1.5% tax · 5.0% vac · 8.0% maint · 8.0% mgmt
Financing live
Cash to close
- Down payment
- $47,500
- Closing costs
- $5,700
- Reserves months
- —
- Total cash needed
- —
Loan-product check · same deal, 3 products live
Conventional
25% down · 7.5% · 30yr
- Down + closing
- —
- Monthly P&I
- —
- Monthly cashflow
- —
- DSCR
- —
- Eligible?
- —
Personal DTI + credit; lowest rate.
DSCR
20% down · 8.5% · 30yr
- Down + closing
- —
- Monthly P&I
- —
- Monthly cashflow
- —
- DSCR
- —
- Eligible?
- —
No personal income docs; deal must DSCR.
Hard money
10% down · 12.0% · 12mo
- Down + closing
- —
- Monthly P&I
- —
- Monthly cashflow
- —
- DSCR
- —
- Eligible?
- —
Short-term bridge; refi at stabilization.
Rent comps 1 comps
| Address | Beds | Baths | Sqft | Rent | $/sqft | DOM | Units | Dist |
|---|---|---|---|---|---|---|---|---|
| 321 Larpenteur Ave E Maplewood, MN | 1.0–2.0 | 1.0 | 755 | $1,250 | $1.66 | 44d | 2 | 1.32mi |
Listing history 34 events
-
2026-05-18historical Contingent - Inspection 592-char remark
-
2026-05-08$190,000 Active 592-char remark
-
2023-01-29historical
-
2023-01-17price $214,000
-
2022-10-26price $219,000
-
2022-10-12$220,000 Active
-
2020-07-14soldstatus $178,000
-
2020-06-15soldstatus $178,000 Sold
Show marketing remark (426 chars)
Sweet, completely renovated home close to bus and shops. Enter on enclosed porch to living room, dining room, eat-in kitchen with new appliances and main floor laundry. 3 bedrooms and 1 full bath upstairs. Home has clean radiator heat, newer siding, roofing and boiler. Completely fenced yard with raised garden bed and outdoor storage. 3 car paved off-street parking. This is a Charming move-in ready "Doll House"
-
2020-05-08status Pending
Show marketing remark (426 chars)
Sweet, completely renovated home close to bus and shops. Enter on enclosed porch to living room, dining room, eat-in kitchen with new appliances and main floor laundry. 3 bedrooms and 1 full bath upstairs. Home has clean radiator heat, newer siding, roofing and boiler. Completely fenced yard with raised garden bed and outdoor storage. 3 car paved off-street parking. This is a Charming move-in ready "Doll House"
-
2020-04-27historical Contingent - Inspection
Show marketing remark (426 chars)
Sweet, completely renovated home close to bus and shops. Enter on enclosed porch to living room, dining room, eat-in kitchen with new appliances and main floor laundry. 3 bedrooms and 1 full bath upstairs. Home has clean radiator heat, newer siding, roofing and boiler. Completely fenced yard with raised garden bed and outdoor storage. 3 car paved off-street parking. This is a Charming move-in ready "Doll House"
-
2020-04-22$162,000 Active
Show marketing remark (426 chars)
Sweet, completely renovated home close to bus and shops. Enter on enclosed porch to living room, dining room, eat-in kitchen with new appliances and main floor laundry. 3 bedrooms and 1 full bath upstairs. Home has clean radiator heat, newer siding, roofing and boiler. Completely fenced yard with raised garden bed and outdoor storage. 3 car paved off-street parking. This is a Charming move-in ready "Doll House"
-
2017-06-13soldstatus $142,400
-
2017-06-06soldstatus $142,400 Sold
-
2017-05-04status Pending
-
2017-04-22historical Contingent - Inspection
-
2017-04-17$139,900 Active
-
2017-04-15price $139,900
-
2017-04-15status Active
-
2017-04-01historical
-
2017-03-04status Pending
-
2017-02-26historical Contingent - Inspection
-
2017-02-21price $129,900
-
2017-01-25price $133,500
-
2017-01-09price $139,900
-
2017-01-03status Active
-
2016-12-29historical
-
2016-12-19price $144,900
-
2016-12-06$149,900 Active
-
2016-07-25soldstatus $45,900
-
2016-06-10soldstatus $45,900 Sold
-
2016-05-04status Pending
-
2016-04-21price $54,722
-
2016-04-06price $59,522
-
2016-03-25$67,522 Active
ⓘ Source: listings_history table (triggers on properties + properties_extension) + one-shot
backfill from property_details.listing_events for pre-trigger history.
Tax reassessment forecast MN · Partial reset (capped growth)
- Current annual tax
- $3,226 · $269/mo
- Projected year-2 tax
- $3,226 · $269/mo
- Expected delta
- $0/yr ($0/mo · 0.0%)
ⓘ Screening estimate from a state-policy table — verify with the county assessor before closing.
Climate risk First Street
- Flood 1/10 Low FEMA zone X (unshaded) · 0% chance over 30 yrs
- Wildfire 1/10 Low
- Heat 2/10 Low 7 d/yr ≥99°F today · 14 d/yr by 30 yrs out
- Wind 2/10 Low
- Air quality 2/10 Low 1 unhealthy d/yr today · 1 by 30 yrs out
Nearby sold comps map
Loading sold comps map…
Walkable amenities ~0.75 mi
Loading nearby amenities…
Taxation est. · year 1
- Rental income
- $18,326
- − Mortgage interest
- −$10,643
- − Property taxes
- −$3,226
- − Insurance
- −$950
- − Repairs & maintenance
- −$1,466
- − Management
- −$1,466
- − Depreciation
- −$5,527
- Taxable loss
- −$4,952
- Est. tax savings @ 24.0%
- +$1,189
- After-tax cash flow
- $-466/yr
For passive investors: Depreciation is non-cash, so a rental often shows a tax loss while cash-flowing — sheltering income. Rental losses are passive: they offset passive income freely, and up to $25,000/yr can offset ordinary (W-2) income if you actively participate and your MAGI is under $100k (phasing out to $0 by $150k); unused losses carry forward. On sale, claimed depreciation is recaptured at up to 25%, and gains may owe capital-gains tax (a 1031 exchange can defer both). Figures are a year-1 estimate at your 24.0% rate — not tax advice; consult a CPA.
Schools (NCES district)
- District
- St. Paul Public School District
- NCES district ID
- 2733840
- Math proficiency
- 21% ▼ -11.00%
- Reading proficiency
- 33% ▼ -7.00%
- Median HH income
- $48,316
- Composite
- 23.51/100
- National rank
- #7868
- State rank
- #270 of 301 in MN
Livability — St. Paul
No livability data for this city. (Only ~50 U.S. cities are tracked.)
Census & demographics
- Census place
- St. Paul, MN
- County
- Ramsey County · 542,837 people
- City population
- 280,599
- Metro
- Minneapolis-St. Paul-Bloomington, MN-WI
- Population (ZIP)
- 17,775
- Household income
- $54,130
- Rent vs Own
- Severe rent burden
- 818.0
Population outlook (Ramsey County) Hauer SSP2
- Today (2025)
- 603,431 people
- By 2030
- 636,459 · +5.5%
- By 2040
- 700,596 · +16.1%
- By 2050
- 765,819 · +26.9%
- By 2075
- 929,297 · +54.0%
- By 2100
- 1,053,924 · +74.7%
Race, ethnicity, and origin ACS 2023
- Neighborhood character
- Diverse neighborhood (Simpson 0.69)
- Race & ethnicity
- Asian 47% Black 22% White 19% Hispanic / Latino 9% Two or more races 4%
- Hispanic origin (detail)
- Mexican 6%
- Common ancestry
- Portuguese 3% Swedish 2% Romanian 1%
- Foreign-born
- 33% · Philippines, Canada, Vietnam
- Languages at home
- 44% English-only · Other Asian/Pacific 37% Spanish 7% Other Indo-European 1%
Political lean MEDSL · Ramsey
- 2024 margin
- Solid D (+43.3) · D 70.5% · R 27.2% · Other 2.3%
- 2008→2024 swing
- +9.4pp toward D · 2008: 33.9pp · 2024: 43.3pp
- All cycles
- 2024: D+43.3 2020: D+45.4 2016: D+39.4 2012: D+35.3 2008: D+33.9
Not yet ingested
- Civics
- —
Market trends
- HPI YoY
- ▼ -60.12%
- Current HPI
- 281.2507
- Rent YoY
- ▲ 3.94%
- Metro
- Minneapolis-St. Paul-Bloomington, MN-WI
- State GDP YoY
- ▲ 2.41%
- F500 in state
- 34
Industry mix (Fortune 500 HQ in MN)
| Industry | F500 HQs | Revenue |
|---|---|---|
| Healthcare | 2 | $407B |
|
||
| Retail | 2 | $150B |
|
||
| Consumer Goods | 2 | $32B |
|
||
| Industrial Machinery | 2 | $6B |
|
||
| Agriculture | 1 | $40B |
|
||
| Healthcare / Medical Devices | 1 | $32B |
|
||
Price history
+181.4% since first listed35 events — show timeline
- 2026-05-24 Pending — NORTHSTARMLS as Distributed by MLS Grid
- 2026-05-18 Contingent — NORTHSTARMLS as Distributed by MLS Grid
- 2026-05-08 Listed $190,000 NORTHSTARMLS as Distributed by MLS Grid
- 2023-01-29 Listing Removed — NORTHSTARMLS as Distributed by MLS Grid
- 2023-01-17 Price Changed $214,000 NORTHSTARMLS as Distributed by MLS Grid
- 2022-10-26 Price Changed $219,000 NORTHSTARMLS as Distributed by MLS Grid
- 2022-10-12 Listed $220,000 NORTHSTARMLS as Distributed by MLS Grid
- 2020-07-14 Sold (Public Records) $178,000 Public Records
- 2020-06-15 Sold (MLS) $178,000 NORTHSTARMLS as Distributed by MLS Grid
- 2020-05-08 Pending — NORTHSTARMLS as Distributed by MLS Grid
- 2020-04-27 Contingent — NORTHSTARMLS as Distributed by MLS Grid
- 2020-04-22 Listed $162,000 NORTHSTARMLS as Distributed by MLS Grid
- 2017-06-13 Sold (Public Records) $142,400 Public Records
- 2017-06-06 Sold (MLS) $142,400 NORTHSTARMLS as Distributed by MLS Grid
- 2017-05-04 Pending — NORTHSTARMLS as Distributed by MLS Grid
- 2017-04-22 Contingent — NORTHSTARMLS as Distributed by MLS Grid
- 2017-04-17 Listed $139,900 NORTHSTARMLS as Distributed by MLS Grid
- 2017-04-15 Price Changed $139,900 NORTHSTARMLS as Distributed by MLS Grid
- 2017-04-15 Relisted — NORTHSTARMLS as Distributed by MLS Grid
- 2017-04-01 Listing Removed — NORTHSTARMLS as Distributed by MLS Grid
- 2017-03-04 Pending — NORTHSTARMLS as Distributed by MLS Grid
- 2017-02-26 Contingent — NORTHSTARMLS as Distributed by MLS Grid
- 2017-02-21 Price Changed $129,900 NORTHSTARMLS as Distributed by MLS Grid
- 2017-01-25 Price Changed $133,500 NORTHSTARMLS as Distributed by MLS Grid
- 2017-01-09 Price Changed $139,900 NORTHSTARMLS as Distributed by MLS Grid
- 2017-01-03 Relisted — NORTHSTARMLS as Distributed by MLS Grid
- 2016-12-29 Listing Removed — NORTHSTARMLS as Distributed by MLS Grid
- 2016-12-19 Price Changed $144,900 NORTHSTARMLS as Distributed by MLS Grid
- 2016-12-06 Listed $149,900 NORTHSTARMLS as Distributed by MLS Grid
- 2016-07-25 Sold (Public Records) $45,900 Public Records
- 2016-06-10 Sold (MLS) $45,900 NORTHSTARMLS as Distributed by MLS Grid
- 2016-05-04 Pending — NORTHSTARMLS as Distributed by MLS Grid
- 2016-04-21 Price Changed $54,722 NORTHSTARMLS as Distributed by MLS Grid
- 2016-04-06 Price Changed $59,522 NORTHSTARMLS as Distributed by MLS Grid
- 2016-03-25 Listed $67,522 NORTHSTARMLS as Distributed by MLS Grid
Property tax history
+2.5%/yrLatest (2025): $3,226 · +1.9% YoY. Source: county tax records.
Cash-flow waterfall
monthlySold comps — $/sqft
last 12 mo · ≤1 miLoading sold comps…