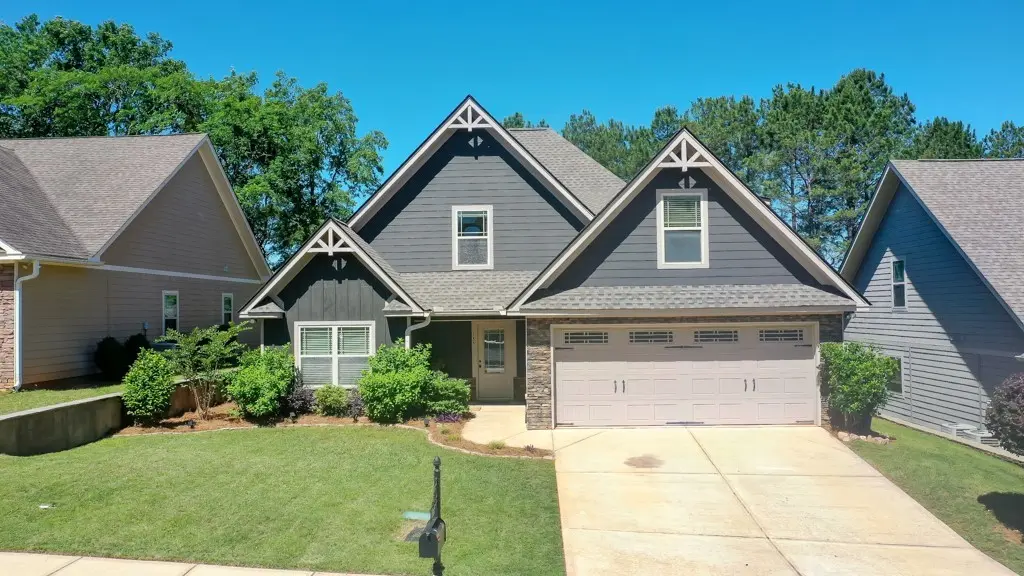
135 Denali Ln · Auburn, AL
Flood risk 1/10 · Minimal
- FEMA flood zone
- X (unshaded)
- Chance of flooding over 30 yrs
- 0.0%
- Est. flood insurance / yr
- $507 – $1,088
Fire risk 4/10 · Minor
- Est. fire insurance / yr
- $916 – $1,700
Heat risk 6/10 · Moderate
- Hot days now (above 105°F)
- 7 days/yr
- Hot days in 30 yrs
- 20 days/yr
Wind risk 6/10 · Moderate
- Chance of severe wind over 30 yrs
- 68.0%
Air-quality risk 2/10 · Minimal
- Unhealthy air days now
- 1 days/yr
- Unhealthy air days in 30 yrs
- 1 days/yr
Risk factors via First Street. Map © Google.
Why this score? — see what drove the D- grade
The composite is a weighted blend of 9 inputs, each scored 0–100. Each bar is that input's sub-score; the figure is the points it added to the 100-point composite (weight × sub-score).
- ARV discount +11.1/15.0
- Cash flow +8.2/30.0
- Schools +5.0/10.0
- Rent growth +4.0/5.0
- Livability +4.0/5.0
- Condition / age +2.5/5.0
- DSCR +2.2/10.0
- 1% rule +1.5/10.0
- Appreciation +0.0/10.0
$400,000
🖨 Deal sheet 📄 Offer letter ✓ Due diligence
Listing remarks MLS
Very nice 4 Bedroom, 3 Bath house in a desirable location. Large kitchen with lots of cabinets, stainless appliances, and eat-in area. Large backyard area with privacy fence, covered patio with an outdoor fireplace. Nice neighborhood with pool. Irrigation system. Lots of attic storage.
Key facts
- Flexible layout
- Screened porch
- Greenhouse
Tags
Property features AI
Finance
- Other: Subdivision: SOLAMERE
- HOA & community: Homeowners association with community pool
Exterior
- Parking: Attached garage; 2 garage spaces
- Utilities: Cable available; Public water available; Sewer connected
- Home design: Residential property; One and one-half stories
- Construction: Block, cement siding and stone construction; Slab foundation
- Exterior features: Covered porch; Storage; Privacy fencing; Community pool
Interior
- Kitchen: Dishwasher; Electric cooktop; Oven; Microwave
- Flooring: Carpet; Tile; Wood
- Bathrooms: 3 full bathrooms; 2 bathrooms on the main level
- Heating & cooling: Electric heating; Central air; Ceiling fans; Electric cooling
- Interior features: Ceiling fans; Eat-in kitchen; Pantry; Fireplace (1)
Neighborhood map
What this means for you Summary
Snapshot
- This is a 4-bed/2.0-bath single-family listed at $400k.
Deal economics
- At list price, monthly cash flow is $-370 ($-4k/yr) — negative.
- To cash-flow at today's rent, offer at most $335k (16.3% below list).
- To meet the 1% rule (rent ≥ 1% of price), the offer needs to be $259k (35.3% below list).
- Recommended offer: $259k (35.3% below list) — sets the bar for 1% rule.
- Cap rate 5.2% vs local median 2.7% in Auburn — top-decile yield for the area; either an underpriced asset or a hidden risk that comps aren't pricing in. Stress-test before assuming the spread holds.
Location & tenants
- Location reads 80/100 on livability (#6 in AL, #1,842 nationally) — a professional / high-income tenant draw. Strengths: crime A+, amenities A+, health & safety A+; Watch: commute F.
- Auburn City (urban): math 51% / reading 69% proficiency, ranked #7 of 129 in AL (top 5%) — acceptable for families but not a draw, mixed tenant base, ~2y average lease.
- Market conditions: Rents rising fast (+6.2%/yr); 359 active listings in the ZIP; 2 comparable units currently listed for rent nearby; lower-income renter base — watch delinquency; 1,858 units permitted in Lee County in 2024 (113 in 5+ unit buildings).
- At $2,587/mo this rent would consume 73% of the median local household income ($43k/yr) (locally 2503% of renters already pay >50% of income on rent) — very limited rent-growth headroom before tenants either downsize or default.
Forward outlook
- Local home prices are declining (-3.0%/yr); year-one equity from $3k of loan paydown is wiped out by about $12k of value loss. Plan a longer hold.
- Lee County population projected at +54% by 2050 — long-run rental-demand tailwind backs the buy-and-hold thesis.
Negotiation context
- It's been on market 21 days — a 2% lower offer ($394k) is reasonable based on typical stale-listing flexibility.
- 2 sale attempts since 7y ago with the ask held roughly flat each time — persistent listings suggest the price (not the market) is what's stuck; bring a comps-based counter.
- Current owner paid $250k; list at $400k implies a 60% gain — meaningful room to come down on a strong offer.
Risks & watch-outs
- Climate carrying-cost: major wind risk, 68% chance of damaging wind over 30y; extreme-heat days projected 7→20/yr by 2055 (HVAC capex compounding) — expect insurance premiums to compound above CPI over the hold.
Questions for the listing agent
- What do current leases actually rent for vs. the listed asking? Can we see a recent rent roll and the last 12 months of T-12 income?
- Is there a deadline driving the sale (1031 exchange, divorce, estate, relocation)? That informs how much negotiation room exists.
- Schools are A-rated — typically a magnet for longer-tenancy family renters. What's the average tenant stay here, and is there a school-zone premium baked into asking?
- The area grade is low — what's the realistic commute time and amenity access for the typical tenant pool here? Any planned neighborhood developments (good or bad) we should know about?
- What's the average days-on-market for RENTAL listings here right now (not sales)? A rising rental-DOM trend means longer vacancies and softer asking-rent achievability than the comps imply.
- What's the recent tenant-quality profile in this submarket — average credit score on applications, eviction rate, late-payment / NSF rate, and stable-employment percentage? A property-management company in the area should have these aggregated.
- How much new for-sale + rental construction is in the pipeline within 1–3 miles? Heavy new supply typically softens prices + rents 12–24 months out; constrained supply supports both.
Investment metrics
- 1% rule
- 0.65% ✗
- Cap rate
- 5.18%
- Cash-on-cash
- -3.96%
- DSCR
- 0.82
- GRM
- 12.9
CMA / ARV
- ARV (median comp)
- $434,918
- List price
- $400,000
- Delta
- -8.03%
- Verdict
- FAIR
- Comps
- 20 within 1.0 mi
Show comp detail 12 sales within ~0.75 mi
| Address | Dist | Beds/Ba | Sqft | Sold | Price | $/sf | Match |
|---|---|---|---|---|---|---|---|
| 1756 Denali Ct | 0.20mi | 3/2.0 (-1) | 1,920 (-6%) | 1mo | $355,000 | $185 | 75 |
| 159 Solamere Ln | 0.15mi | 3/2.5 (-1) | 2,051 (+1%) | 16mo | $355,000 | $173 | 72 |
| 123 Solamere Ln | 0.06mi | 4/3.0 | 2,302 (+13%) | 2mo | $395,000 | $172 | 70 |
| 369 Lightness Dr | 0.41mi | 4/2.5 | 2,132 (+5%) | 3mo | $385,000 | $181 | 69 |
| 390 Lightness Dr | 0.47mi | 3/2.5 (-1) | 2,025 (-1%) | 4mo | $325,000 | $160 | 66 |
| 1786 Kenai Pass | 0.21mi | 3/2.5 (-1) | 2,270 (+11%) | 4mo | $365,000 | $161 | 61 |
| 1717 Solamere Ct | 0.17mi | 3/2.5 (-1) | 2,333 (+14%) | 3mo | $362,500 | $155 | 59 |
| 374 Lightness Dr | 0.44mi | 3/2.5 (-1) | 1,999 (-2%) | 13mo | $320,000 | $160 | 58 |
| 373 Lightness Dr | 0.42mi | 5/3.0 (+1) | 2,134 (+5%) | 10mo | $369,000 | $173 | 56 |
| 331 Lightness Dr | 0.33mi | 4/2.5 | 2,320 (+14%) | 10mo | $356,000 | $153 | 51 |
| 363 Lightness Dr | 0.39mi | 4/3.5 | 2,300 (+13%) | 7mo | $415,000 | $180 | 49 |
| 440 Lightness Dr | 0.51mi | 3/3.0 (-1) | 1,755 (-14%) | 12mo | $335,000 | $191 | 34 |
Match score weights: distance 35% · size 25% · config 20% · recency 20%. Top-matched comps best support the ARV.
Projected returns pro-forma
-3.0% appreciation · 6.18% rent growth · sell at horizon
- IRR
- -20.0%
- Equity multiple
- 0.29×
- Total profit
- $-80,010
- Equity at exit
- $59,641
- IRR
- -8.1%
- Equity multiple
- 0.43×
- Total profit
- $-63,306
- Equity at exit
- $34,585
Cash invested: $112,000 (down + closing). Projections, not guarantees.
Landlord ↔ Tenant lean methodology
- Overall (STATE)
- 90 Strongly Landlord-Friendly
- State Alabama
- 90 Strongly Landlord-Friendly · R+15
- County
- — inherits STATE
- City
- — inherits STATE
ZIP-level market 36832
- Home prices YoY
- -23.3%
- Rents YoY
- 6.2%
- Active inventory
- 359
- Price-to-rent
- 12.9×
Monthly cashflow live
- Estimated rent
- $2,587 medium interval (Pro) →
- Mortgage (P&I)
- −$2,098
- Tax from tax record
- −$149 /mo · $1,792/yr
- Insurance
- −$167
- HOA
- −$0
- Vacancy / Maint / Mgmt
- −$543
- Net cashflow
- $-370
Break-even live
UW: 25.0% down · 7.5% · 30yr · 1.5% tax · 5.0% vac · 8.0% maint · 8.0% mgmt
Financing live
Cash to close
- Down payment
- $100,000
- Closing costs
- $12,000
- Reserves months
- —
- Total cash needed
- —
Loan-product check · same deal, 3 products live
Conventional
25% down · 7.5% · 30yr
- Down + closing
- —
- Monthly P&I
- —
- Monthly cashflow
- —
- DSCR
- —
- Eligible?
- —
Personal DTI + credit; lowest rate.
DSCR
20% down · 8.5% · 30yr
- Down + closing
- —
- Monthly P&I
- —
- Monthly cashflow
- —
- DSCR
- —
- Eligible?
- —
No personal income docs; deal must DSCR.
Hard money
10% down · 12.0% · 12mo
- Down + closing
- —
- Monthly P&I
- —
- Monthly cashflow
- —
- DSCR
- —
- Eligible?
- —
Short-term bridge; refi at stabilization.
Rent comps 2 comps
| Address | Beds | Baths | Sqft | Rent | $/sqft | DOM | Units | Dist |
|---|---|---|---|---|---|---|---|---|
| 1550 Richland Rd Auburn, AL | 4.0 | 1.0–3.5 | 1157 | $3,300 | $2.85 | 13d | 97 | 0.80mi |
| 1007 Stonegate Dr Auburn, AL | 3.0 | 2.0 | 1440 | $1,900 | $1.32 | 43d | 1 | 1.38mi |
Listing history 12 events
-
2026-06-07statusdays on market $400,000 Pending 21 DOM
-
2026-06-05days on market $400,000 Active 20 DOM
-
2026-06-03days on market $400,000 Active 19 DOM
-
2026-06-02days on market $400,000 Active 18 DOM
-
2026-06-01days on market $400,000 Active 17 DOM
-
2026-05-31days on market $400,000 Active 16 DOM
-
2026-05-30days on market $400,000 Active 15 DOM
-
2026-05-15$400,000 Active 1742-char remark
-
2019-06-20soldstatus $250,000 286-char remark
Show marketing remark (286 chars)
Very nice 4 Bedroom, 3 Bath house in a desirable location. Large kitchen with lots of cabinets, stainless appliances, and eat-in area. Large backyard area with privacy fence, covered patio with an outdoor fireplace. Nice neighborhood with pool. Irrigation system. Lots of attic storage.
-
2019-06-20soldstatus $250,000
Show marketing remark (286 chars)
Very nice 4 Bedroom, 3 Bath house in a desirable location. Large kitchen with lots of cabinets, stainless appliances, and eat-in area. Large backyard area with privacy fence, covered patio with an outdoor fireplace. Nice neighborhood with pool. Irrigation system. Lots of attic storage.
-
2019-04-12$268,000 286-char remark
Show marketing remark (286 chars)
Very nice 4 Bedroom, 3 Bath house in a desirable location. Large kitchen with lots of cabinets, stainless appliances, and eat-in area. Large backyard area with privacy fence, covered patio with an outdoor fireplace. Nice neighborhood with pool. Irrigation system. Lots of attic storage.
-
2011-07-28soldstatus $27,000
ⓘ Source: listings_history table (triggers on properties + properties_extension) + one-shot
backfill from property_details.listing_events for pre-trigger history.
Tax reassessment forecast AL · Resets to sale price
- Current annual tax
- $1,792 · $149/mo
- Projected year-2 tax
- $1,792 · $149/mo
- Expected delta
- $0/yr ($0/mo · 0.0%)
ⓘ Screening estimate from a state-policy table — verify with the county assessor before closing.
Climate risk First Street
- Flood 1/10 Low FEMA zone X (unshaded) · 0% chance over 30 yrs
- Wildfire 4/10 Moderate
- Heat 6/10 Major 7 d/yr ≥105°F today · 20 d/yr by 30 yrs out
- Wind 6/10 Major 68% chance of damaging wind over 30 yrs
- Air quality 2/10 Low 1 unhealthy d/yr today · 1 by 30 yrs out
Nearby sold comps map
Loading sold comps map…
Walkable amenities ~0.75 mi
Loading nearby amenities…
Taxation est. · year 1
- Rental income
- $31,044
- − Mortgage interest
- −$22,406
- − Property taxes
- −$1,792
- − Insurance
- −$2,000
- − Repairs & maintenance
- −$2,484
- − Management
- −$2,484
- − Depreciation
- −$11,636
- Taxable loss
- −$11,757
- Est. tax savings @ 24.0%
- +$2,822
- After-tax cash flow
- $-1,617/yr
For passive investors: Depreciation is non-cash, so a rental often shows a tax loss while cash-flowing — sheltering income. Rental losses are passive: they offset passive income freely, and up to $25,000/yr can offset ordinary (W-2) income if you actively participate and your MAGI is under $100k (phasing out to $0 by $150k); unused losses carry forward. On sale, claimed depreciation is recaptured at up to 25%, and gains may owe capital-gains tax (a 1031 exchange can defer both). Figures are a year-1 estimate at your 24.0% rate — not tax advice; consult a CPA.
Schools (NCES district)
- District
- Auburn City
- NCES district ID
- 0100210
- Math proficiency
- 51% ▼ -21.00%
- Reading proficiency
- 69% ▲ 5.00%
- Median HH income
- $38,126
- Composite
- 49.87/100
- National rank
- #1944
- State rank
- #7 of 129 in AL
Livability — Auburn
- Score
- 80/100
- State rank
- #6
- US rank
- #1842
Category grades
Schools grade is shown separately in the Schools card above.
Census & demographics
- Census place
- Auburn, AL
- County
- Lee County · 144,175 people
- City population
- 80,251
- Metro
- Auburn-Opelika, AL
- Population (ZIP)
- 30,959
- Household income
- $42,717
- Rent vs Own
- Severe rent burden
- 2503.0
Population outlook (Lee County) Hauer SSP2
- Today (2025)
- 196,440 people
- By 2030
- 217,417 · +10.7%
- By 2040
- 259,467 · +32.1%
- By 2050
- 301,557 · +53.5%
- By 2075
- 402,186 · +104.7%
- By 2100
- 474,503 · +141.6%
Race, ethnicity, and origin ACS 2023
- Neighborhood character
- Diverse neighborhood (Simpson 0.58)
- Race & ethnicity
- White 59% Black 26% Asian 6% Hispanic / Latino 6% Two or more races 4%
- Hispanic origin (detail)
- Mexican 3%
- Common ancestry
- Italian 3% Slovak 2% Serbian 1%
- Foreign-born
- 8% · South Korea, Canada, China
- Languages at home
- 89% English-only · Spanish 4% Korean 2% Chinese 1%
Political lean MEDSL · Lee
- 2024 margin
- Strong R (+27.8) · D 35.5% · R 63.3% · Other 1.2%
- 2008→2024 swing
- -8.1pp toward R · 2008: -19.8pp · 2024: -27.8pp
- All cycles
- 2024: R+27.8 2020: R+20.1 2016: R+23.1 2012: R+19.9 2008: R+19.8
Not yet ingested
- Civics
- —
Market trends
- HPI YoY
- ▼ -75.65%
- Current HPI
- 248.9059
- Rent YoY
- ▲ 6.18%
- Metro
- Auburn-Opelika, AL
- State GDP YoY
- ▲ 2.94%
- F500 in state
- 4
Industry mix (Fortune 500 HQ in AL)
| Industry | F500 HQs | Revenue |
|---|---|---|
| Financial Services | 1 | $8B |
|
||
| Healthcare | 1 | $5B |
|
||
Price history
+1381.5% since first listed6 events — show timeline
- 2026-06-05 Pending — LCMLS
- 2026-05-15 Listed $400,000 LCMLS
- 2019-06-20 Sold (Public Records) $250,000 Public Records
- 2019-06-20 Sold (MLS) $250,000 LCMLS
- 2019-04-12 Listed $268,000 LCMLS
- 2011-07-28 Sold (Public Records) $27,000 Public Records
Property tax history
+4.4%/yrLatest (2025): $1,792 · +7.2% YoY. Source: county tax records.
Cash-flow waterfall
monthlySold comps — $/sqft
last 12 mo · ≤1 miLoading sold comps…