 Duplex
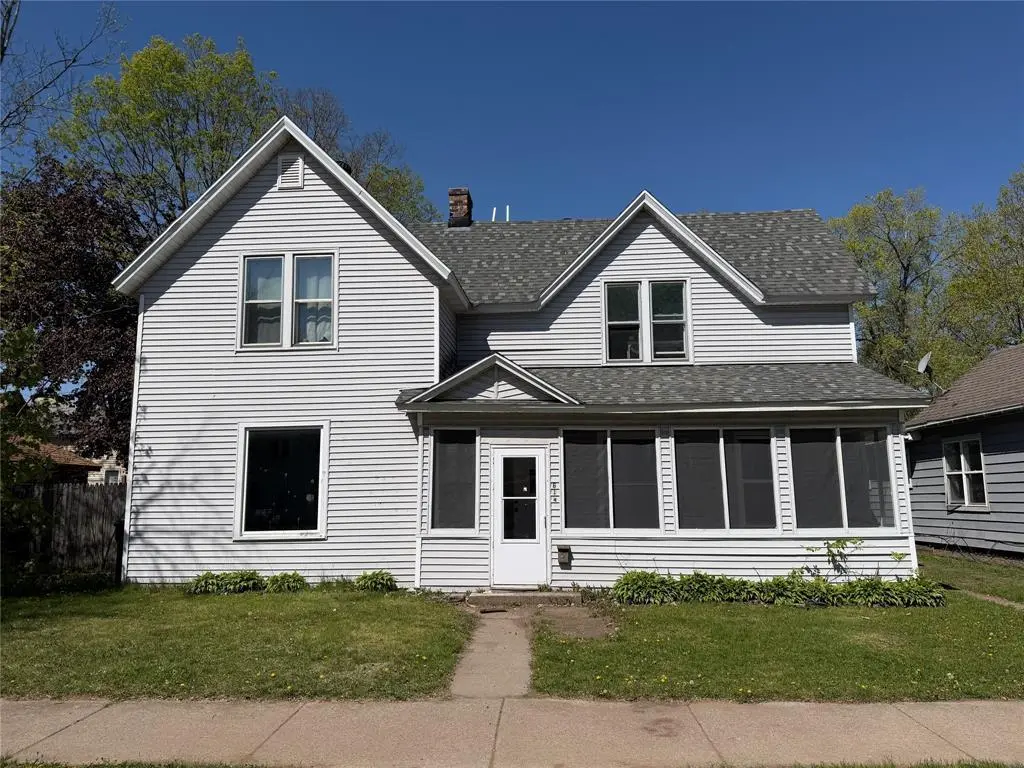
614 Cochrane St #2 · Eau Claire, WI
Flood risk 1/10 · Minimal
- FEMA flood zone
- X (unshaded)
- Chance of flooding over 30 yrs
- 0.0%
- Est. flood insurance / yr
- $473 – $860
Fire risk 1/10 · Minimal
- Est. fire insurance / yr
- $636 – $1,182
Heat risk 2/10 · Minimal
- Hot days now (above 97°F)
- 7 days/yr
- Hot days in 30 yrs
- 14 days/yr
Wind risk 1/10 · Minimal
- Chance of severe wind over 30 yrs
- —
Air-quality risk 2/10 · Minimal
- Unhealthy air days now
- 1 days/yr
- Unhealthy air days in 30 yrs
- 1 days/yr
Risk factors via First Street. Map © Google.
Why this score? — see what drove the C+ grade
The composite is a weighted blend of 9 inputs, each scored 0–100. Each bar is that input's sub-score; the figure is the points it added to the 100-point composite (weight × sub-score).
- Cash flow +28.5/30.0
- DSCR +10.0/10.0
- 1% rule +7.9/10.0
- Livability +4.5/5.0
- Condition / age +4.0/5.0
- ARV discount +3.7/15.0
- Schools +3.5/10.0
- Rent growth +3.0/5.0
- Appreciation +0.0/10.0
$247,500
🖨 Deal sheet 📄 Offer letter ✓ Due diligence
Multi-family units
County records classify this as Multi-Family (2-4 Unit). Listing-text estimate: 2 units. confirmed
Listing remarks
Newly renovated large duplex located just minutes from downtown! This property is perfect for owner occupancy or as a turnkey addition to your investment portfolio. The spacious lower 3-bedroom unit has just been completely remodeled and is vacant, making it move-in ready for a new owner or tenant. Recent updates include a brand-new kitchen with new appliances, updated bathroom, fresh paint throughout, and all-new flooring. The upper unit received the same full renovation approximately 18 months ago, giving both units modern finishes and strong rental appeal. Major maintenance and updates have already been completed, allowing you to focus on finding the perfect tenant and building equity fr
Key facts
- New kitchen
- Fresh paint
- All new flooring
Tags
Property features AI
Exterior
- Utilities: Municipal water; Municipal sewer
- Home design: Duplex (multi-family); Estimated living area 1,751–2,000 sq ft (finished above grade about 1,932 sq ft); Two units (Unit 1 ~1,100 sq ft; Unit 2 ~832 sq ft)
- Construction: Block in basement
- Exterior features: Vinyl exterior; Lot size approximately 0.1879 acres
Interior
- Bedrooms: Unit 1: 3 bedrooms; Unit 2: 2 bedrooms
- Bathrooms: Unit 1: 1 full bathroom; Unit 2: 1 full bathroom
- Heating & cooling: Forced air heating; Natural gas fuel
- Interior features: Circuit breakers; Full basement with block construction
Neighborhood map
What this means for you Summary
Snapshot
- This is a 2 × 2-bed/1-bath units multifamily listed at $248k. Condition is rated good.
Deal economics
- At list price, monthly cash flow is $807 ($10k/yr) — positive. Per door: $403/mo.
- The deal already cash-flows at list — no discount required.
- Meets the 1% rule at list price ($3k rent vs $248k).
- Recommended offer: $240k (3.0% below list) — sets the bar for market timing.
- Cap rate 10.2% vs local median 2.4% in Eau Claire — top-decile yield for the area; either an underpriced asset or a hidden risk that comps aren't pricing in. Stress-test before assuming the spread holds.
Location & tenants
- Location reads 89/100 on livability (#10 in WI, #121 nationally) — a professional / high-income tenant draw. Strengths: amenities A+, cost of living A+, housing A+.
- Eau Claire Area School District (urban): math 38% / reading 43% proficiency, ranked #150 of 342 in WI (top 44%) — families likely to look elsewhere, expect single-tenant / working-renter base with shorter leases.
- Market conditions: Rents rising (+2.0%/yr); 212 active listings in the ZIP; 1 comparable units currently listed for rent nearby; 583 units permitted in Eau Claire County in 2024 (325 in 5+ unit buildings).
- At $3,186/mo this rent would consume 53% of the median local household income ($72k/yr) (locally 1614% of renters already pay >50% of income on rent) — very limited rent-growth headroom before tenants either downsize or default.
Forward outlook
- Local home prices are declining (-3.0%/yr); year-one equity from $2k of loan paydown is wiped out by about $7k of value loss. Plan a longer hold.
- Eau Claire County population projected at +14% by 2050 — modest demand growth; plan on rents tracking national, not racing it.
- At projected returns (-3.0% appreciation + 2.0% rent growth), your $69k cash investment doubles in ~10 years — after that, you're playing with house money.
Negotiation context
- It's been on market 35 days — a 3% lower offer ($240k) is reasonable based on typical stale-listing flexibility.
Risks & watch-outs
- Watch-outs: built in 1891 — expect roof / HVAC / electrical / plumbing capex.
Questions for the listing agent
- It's been on market 35 days. Have you received any prior offers? Is the seller open to a 3% concession, seller financing, or rate buy-down credit?
- Can we see the unit-by-unit rent roll, current vacancy, and any below-market leases? What's the average tenancy length?
- What capital expenditures (roof, boiler, parking lot, exteriors) have been made in the last 5 years, and what's planned in the next 2?
- Built in 1891 — when were the roof, HVAC, electrical panel, plumbing, and water heater last replaced?
- Is there a deadline driving the sale (1031 exchange, divorce, estate, relocation)? That informs how much negotiation room exists.
- Schools are B-rated — typically a magnet for longer-tenancy family renters. What's the average tenant stay here, and is there a school-zone premium baked into asking?
- What's the average days-on-market for RENTAL listings here right now (not sales)? A rising rental-DOM trend means longer vacancies and softer asking-rent achievability than the comps imply.
- What's the recent tenant-quality profile in this submarket — average credit score on applications, eviction rate, late-payment / NSF rate, and stable-employment percentage? A property-management company in the area should have these aggregated.
- How much new apartment / multifamily construction is in the pipeline within 1–3 miles? Heavy new supply (>2% of stock underway) typically softens rents 12–24 months out; light construction supports rent growth.
Investment metrics
- 1% rule
- 1.29% ✓
- Cap rate
- 10.20%
- Cash-on-cash
- 13.97%
- DSCR
- 1.62
- GRM
- 6.5
CMA / ARV
- ARV (median comp)
- $228,249
- List price
- $247,500
- Delta
- 8.43%
- Verdict
- FAIR
- Comps
- 20 within 1.0 mi
Show comp detail 8 sales within ~0.75 mi
| Address | Dist | Beds/Ba | Sqft | Sold | Price | $/sf | Match |
|---|---|---|---|---|---|---|---|
| 503 Dewey St Unit 1 & 2 | 0.33mi | 4/2.0 | 2,037 (+5%) | 5mo | $188,500 | $93 | 71 |
| 1150 E Madison St #3 | 0.24mi | 4/3.0 | 2,083 (+8%) | 14mo | $261,000 | $125 | 60 |
| 517 Dodge St Unit 1 & 2 | 0.69mi | 5/2.0 (+1) | 1,932 (0%) | 5mo | $157,500 | $82 | 58 |
| 708 Jones St Unit 1 & 1/2 | 0.68mi | 4/2.0 | 2,024 (+5%) | 4mo | $145,000 | $72 | 56 |
| 901 Barland St Unit 1&2 | 0.67mi | 4/2.0 | 2,118 (+10%) | 13mo | $265,000 | $125 | 42 |
| 1037 Barland St Unit 1 & 2 | 0.72mi | 3/2.0 (-1) | 2,095 (+8%) | 9mo | $222,500 | $106 | 40 |
| 1418 E Madison St Unit 1 & 2 | 0.32mi | 3/2.0 (-1) | 2,214 (+15%) | 20mo | $192,500 | $87 | 39 |
| 1105 Barland St Unit 1-2 | 0.74mi | 5/2.0 (+1) | 1,768 (-8%) | 9mo | $145,000 | $82 | 39 |
Match score weights: distance 35% · size 25% · config 20% · recency 20%. Top-matched comps best support the ARV.
Projected returns pro-forma
-3.0% appreciation · 2.01% rent growth · sell at horizon
- IRR
- 3.1%
- Equity multiple
- 1.12×
- Total profit
- $8,168
- Equity at exit
- $36,903
- IRR
- 11.7%
- Equity multiple
- 1.88×
- Total profit
- $60,810
- Equity at exit
- $21,399
Cash invested: $69,300 (down + closing). Projections, not guarantees.
Landlord ↔ Tenant lean methodology
- Overall (STATE)
- 73 Landlord-Friendly
- State Wisconsin
- 73 Landlord-Friendly · R+2
- County
- — inherits STATE
- City
- — inherits STATE
ZIP-level market 54703
- Rents YoY
- 2.0%
- Active inventory
- 212
- Price-to-rent
- 12.9×
Monthly cashflow live
- Estimated rent
- $3,186 high interval (Pro) →
- Mortgage (P&I)
- −$1,298
- Tax est. 1.5%
- −$309 /mo · $3,712/yr
- Insurance
- −$103
- HOA
- −$0
- Vacancy / Maint / Mgmt
- −$669
- Net cashflow
- $807
Break-even live
2-unit breakdown (identical units grouped — click to expand)
| Units | Beds | Baths | Est. rent |
|---|---|---|---|
| 2× units | 2 | 1 | $3,186 |
| #1 | 2 | 1 | $1,593 |
| #2 | 2 | 1 | $1,593 |
| Total (2 units) | $3,186 | ||
UW: 25.0% down · 7.5% · 30yr · 1.5% tax · 5.0% vac · 8.0% maint · 8.0% mgmt
Financing live
Cash to close
- Down payment
- $61,875
- Closing costs
- $7,425
- Reserves months
- —
- Total cash needed
- —
Loan-product check · same deal, 3 products live
Conventional
25% down · 7.5% · 30yr
- Down + closing
- —
- Monthly P&I
- —
- Monthly cashflow
- —
- DSCR
- —
- Eligible?
- —
Personal DTI + credit; lowest rate.
DSCR
20% down · 8.5% · 30yr
- Down + closing
- —
- Monthly P&I
- —
- Monthly cashflow
- —
- DSCR
- —
- Eligible?
- —
No personal income docs; deal must DSCR.
Hard money
10% down · 12.0% · 12mo
- Down + closing
- —
- Monthly P&I
- —
- Monthly cashflow
- —
- DSCR
- —
- Eligible?
- —
Short-term bridge; refi at stabilization.
Rent comps 1 comps
| Address | Beds | Baths | Sqft | Rent | $/sqft | DOM | Units | Dist |
|---|---|---|---|---|---|---|---|---|
| 1014 Oxford Ave Unit 1/2 Eau Claire, WI | 4.0 | 1.0 | 1244 | $1,396 | $1.12 | 43d | 1 | 1.01mi |
Listing history 16 events
-
2026-06-18status $247,500 Pending 35 DOM
-
2026-06-17days on market $247,500 Active 35 DOM
-
2026-06-16days on market $247,500 Active 34 DOM
-
2026-06-15days on market $247,500 Active 33 DOM
-
2026-06-13days on market $247,500 Active 30 DOM
-
2026-06-10days on market $247,500 Active 28 DOM
-
2026-06-09days on market $247,500 Active 27 DOM
-
2026-06-09price $247,500 Active 26 DOM
-
2026-06-08days on market $249,900 Active 26 DOM
-
2026-06-07days on market $249,900 Active 25 DOM
-
2026-06-05days on market $249,900 Active 22 DOM
-
2026-06-02days on market $249,900 Active 20 DOM
-
2026-06-01days on market $249,900 Active 19 DOM
-
2026-05-31days on market $249,900 Active 18 DOM
-
2026-05-30days on market $249,900 Active 17 DOM
-
2026-05-13$249,900 Active 898-char remark
ⓘ Source: listings_history table (triggers on properties + properties_extension) + one-shot
backfill from property_details.listing_events for pre-trigger history.
Climate risk First Street
- Flood 1/10 Low FEMA zone X (unshaded) · 0% chance over 30 yrs
- Wildfire 1/10 Low
- Heat 2/10 Low 7 d/yr ≥97°F today · 14 d/yr by 30 yrs out
- Wind 1/10 Low
- Air quality 2/10 Low 1 unhealthy d/yr today · 1 by 30 yrs out
Nearby sold comps map
Loading sold comps map…
Walkable amenities ~0.75 mi
Loading nearby amenities…
Taxation est. · year 1
- Rental income
- $38,232
- − Mortgage interest
- −$13,864
- − Property taxes
- −$3,712
- − Insurance
- −$1,238
- − Repairs & maintenance
- −$3,059
- − Management
- −$3,059
- − Depreciation
- −$7,200
- Taxable income
- $6,101
- Est. tax owed @ 24.0%
- −$1,464
- After-tax cash flow
- $8,214/yr
For passive investors: Depreciation is non-cash, so a rental often shows a tax loss while cash-flowing — sheltering income. Rental losses are passive: they offset passive income freely, and up to $25,000/yr can offset ordinary (W-2) income if you actively participate and your MAGI is under $100k (phasing out to $0 by $150k); unused losses carry forward. On sale, claimed depreciation is recaptured at up to 25%, and gains may owe capital-gains tax (a 1031 exchange can defer both). Figures are a year-1 estimate at your 24.0% rate — not tax advice; consult a CPA.
Condition & rehab AI · 12 photos
This newly renovated duplex is move-in ready with updated kitchens and bathrooms, fresh paint, and new flooring. It offers strong rental appeal and is ideal for owner-occupancy or investment.
Value-add opportunities
- Both Painting exterior and interior — Enhances curb appeal and interior aesthetics
- Both Upgrading lighting fixtures — Improves ambiance and safety
- Both Adding smart home features — Enhances convenience and marketability
Renovation cost estimate screening
Value-add ROI direction
- Both Painting exterior and interior — Enhances curb appeal and interior aesthetics ↑
- Both Upgrading lighting fixtures — Improves ambiance and safety ↑
- Both Adding smart home features — Enhances convenience and marketability ↑
ⓘ Cost ranges are severity-bucket heuristics (US national rule-of-thumb). Get contractor quotes + a written scope before underwriting a rehab budget.
Schools (NCES district)
- District
- Eau Claire Area School District
- NCES district ID
- 5504050
- Math proficiency
- 38% ▼ -9.00%
- Reading proficiency
- 43% ▬ 0.00%
- Median HH income
- $48,206
- Composite
- 34.72/100
- National rank
- #5135
- State rank
- #150 of 342 in WI
Livability — Eau Claire
- Score
- 89/100
- State rank
- #10
- US rank
- #121
Category grades
Schools grade is shown separately in the Schools card above.
Census & demographics
- Census place
- Eau Claire, WI
- County
- Eau Claire County · 96,114 people
- City population
- 87,167
- Metro
- Eau Claire, WI
- Population (ZIP)
- 44,153
- Household income
- $71,518
- Rent vs Own
- Severe rent burden
- 1614.0
Population outlook (Eau Claire County) Hauer SSP2
- Today (2025)
- 109,006 people
- By 2030
- 112,587 · +3.3%
- By 2040
- 118,674 · +8.9%
- By 2050
- 124,085 · +13.8%
- By 2075
- 135,804 · +24.6%
- By 2100
- 139,875 · +28.3%
Race, ethnicity, and origin ACS 2023
- Neighborhood character
- Predominantly White (85%)
- Race & ethnicity
- White 85% Asian 6% Two or more races 4% Hispanic / Latino 4% Black 2%
- Common ancestry
- Portuguese 16% Romanian 5% Lithuanian 3%
- Foreign-born
- 3% · Canada, China
- Languages at home
- 92% English-only · Other Asian/Pacific 4% Spanish 3%
Political lean MEDSL · Eau Claire
- 2024 margin
- D (+10.6) · D 54.6% · R 44.0% · Other 1.4%
- 2008→2024 swing
- -11.6pp toward R · 2008: 22.1pp · 2024: 10.6pp
- All cycles
- 2024: D+10.6 2020: D+10.8 2016: D+7.3 2012: D+13.6 2008: D+22.1
Not yet ingested
- Civics
- —
Market trends
- HPI YoY
- ▼ -276.20%
- Current HPI
- 218.2747
- Rent YoY
- ▲ 2.01%
- Metro
- Eau Claire, WI
- State GDP YoY
- ▲ 2.10%
- F500 in state
- 20
Industry mix (Fortune 500 HQ in WI)
| Industry | F500 HQs | Revenue |
|---|---|---|
| Industrial Machinery | 4 | $23B |
|
||
| Industrial Technology | 2 | $36B |
|
||
| Insurance | 1 | $36B |
|
||
| Professional Services | 1 | $19B |
|
||
| Utilities | 1 | $9B |
|
||
| Consumer Goods | 1 | $3B |
|
||
Price history
-1.0% since first listed3 events — show timeline
- 2026-06-18 Pending — RANWW
- 2026-06-08 Price Changed $247,500 RANWW
- 2026-05-13 Listed $249,900 RANWW
Cash-flow waterfall
monthlySold comps — $/sqft
last 12 mo · ≤1 miLoading sold comps…