15030 71st Ave Unit 2D · New York, NY
Flood risk 6/10 · Moderate
- FEMA flood zone
- X (unshaded)
- Chance of flooding over 30 yrs
- 0.57%
- Est. flood insurance / yr
- $507 – $1,088
Fire risk 1/10 · Minimal
- Est. fire insurance / yr
- $691 – $1,283
Heat risk 7/10 · Major
- Hot days now (above 99°F)
- 7 days/yr
- Hot days in 30 yrs
- 15 days/yr
Wind risk 6/10 · Moderate
- Chance of severe wind over 30 yrs
- 27.0%
Air-quality risk 4/10 · Minor
- Unhealthy air days now
- 6 days/yr
- Unhealthy air days in 30 yrs
- 6 days/yr
Risk factors via First Street. Map © Google.
Why this score? — see what drove the C- grade
The composite is a weighted blend of 9 inputs, each scored 0–100. Each bar is that input's sub-score; the figure is the points it added to the 100-point composite (weight × sub-score).
- Cash flow +20.9/30.0
- ARV discount +7.5/15.0
- DSCR +6.7/10.0
- 1% rule +5.5/10.0
- Schools +5.0/10.0
- Livability +3.8/5.0
- Rent growth +2.5/5.0
- Condition / age +2.5/5.0
- Appreciation +0.0/10.0
$258,000
🖨 Deal sheet 📄 Offer letter ✓ Due diligence
Listing remarks
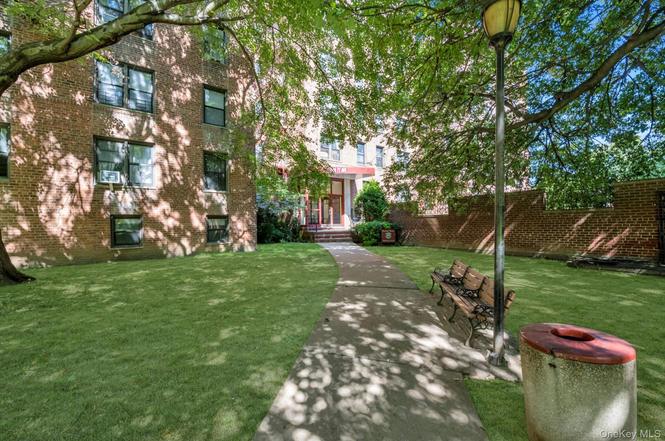
Sunny 1-Bedroom Co-op in Dara Gardens! Features a modern eat-in kitchen, spacious living room with high ceilings, hardwood floors, and ample closet space. Gated garden, 24-hr doorman/security, laundry, playground, and landscaped grounds. Indoor parking available (+$30K). Pet-friendly, sublet after 2 years. Prime location near schools, transportation, highways, shopping & dining. Move-in ready! No flip tax!
Key facts
- 24-hr doorman
- Gated garden
- Ample closet space
Tags
Property features AI
Finance
- HOA & community: Cooperative ownership (HOA/maintenance details not specified)
Exterior
- Parking: 1 parking space (additional parking fee applies)
- Utilities: Electricity connected; Natural gas connected; Public sewer; Water connected; Public trash collection
- Home design: Stock cooperative
- Construction: Brick construction
- Exterior features: Brick construction; Not waterfront
Interior
- Kitchen: Other appliances
- Bedrooms: 2 rooms total (includes bedrooms and living spaces)
- Bathrooms: 1 full bathroom
- Heating & cooling: Wall/window air conditioning units; Other heating system
- Interior features: Finished full basement; Other interior features
- Laundry & utility: Washer/dryer information not specified
Neighborhood map
What this means for you Summary
Snapshot
- This is a 1-bed/1.0-bath condo listed at $258k.
Deal economics
- At list price, monthly cash flow is $359 ($4k/yr) — positive.
- The deal already cash-flows at list — no discount required.
- Meets the 1% rule at list price ($3k rent vs $258k).
- Recommended offer: $227k (12.0% below list) — sets the bar for market timing.
- Cap rate 8.0% vs local median 2.6% in New York — top-decile yield for the area; either an underpriced asset or a hidden risk that comps aren't pricing in. Stress-test before assuming the spread holds.
Location & tenants
- Location reads 75/100 on livability (#268 in NY, #4,188 nationally) — a middle-class / working-renter tenant base. Strengths: amenities A+, commute A+, health & safety A; Watch: crime F, cost of living F.
- Market conditions: 259 active listings in the ZIP; 33 comparable units currently listed for rent nearby; rentals at typical pace (median 22d on market — plan ~3-4 weeks tenant-placement turnaround); solid renter incomes; 5,302 units permitted in Queens County in 2024 (4,918 in 5+ unit buildings).
- This rent runs 43% of the median local income ($75k/yr) — at the standard rent-burdened threshold; future hikes will face affordability resistance.
Forward outlook
- Local home prices are declining (-3.0%/yr); year-one equity from $2k of loan paydown is wiped out by about $8k of value loss. Plan a longer hold.
- Queens County population projected at +16% by 2050 — long-run rental-demand tailwind backs the buy-and-hold thesis.
Negotiation context
- It's been on market 285 days — a 12% lower offer ($227k) is reasonable based on typical stale-listing flexibility.
- 4 sale attempts since 6y ago with the ask held roughly flat each time — persistent listings suggest the price (not the market) is what's stuck; bring a comps-based counter.
Risks & watch-outs
- Watch-outs: built in 1958 — expect roof / HVAC / electrical / plumbing capex.
- Climate carrying-cost: major flood risk; major wind risk, 27% chance of damaging wind over 30y; extreme-heat days projected 7→15/yr by 2055 (HVAC capex compounding) — expect insurance premiums to compound above CPI over the hold.
Questions for the listing agent
- It's been on market 285 days. Have you received any prior offers? Is the seller open to a 12% concession, seller financing, or rate buy-down credit?
- Built in 1958 — when were the roof, HVAC, electrical panel, plumbing, and water heater last replaced?
- Any open or pending special assessments — roof, HVAC, plumbing, elevator, façade? What's the per-unit balance and payoff schedule, and is the seller paying it off at close or rolling it to the buyer?
- Why hasn't it sold? Are there any deal-killer items the seller is aware of (foundation, flood, title, zoning, code violations)?
- Is there a deadline driving the sale (1031 exchange, divorce, estate, relocation)? That informs how much negotiation room exists.
- Schools are B-rated — typically a magnet for longer-tenancy family renters. What's the average tenant stay here, and is there a school-zone premium baked into asking?
- Crime grade is F in this area — have there been break-ins, vandalism, or insurance claims at this property in the last 3 years? What carrier currently insures it and at what premium?
- What's the average days-on-market for RENTAL listings here right now (not sales)? A rising rental-DOM trend means longer vacancies and softer asking-rent achievability than the comps imply.
- What's the recent tenant-quality profile in this submarket — average credit score on applications, eviction rate, late-payment / NSF rate, and stable-employment percentage? A property-management company in the area should have these aggregated.
- How much new apartment / multifamily construction is in the pipeline within 1–3 miles? Heavy new supply (>2% of stock underway) typically softens rents 12–24 months out; light construction supports rent growth.
Investment metrics
- 1% rule
- 1.05% ✓
- Cap rate
- 7.96%
- Cash-on-cash
- 5.97%
- DSCR
- 1.27
- GRM
- 7.9
CMA / ARV
No comps found within radius.
Projected returns pro-forma
-3.0% appreciation · 3.0% rent growth · sell at horizon
- IRR
- -7.1%
- Equity multiple
- 0.74×
- Total profit
- $-18,877
- Equity at exit
- $38,469
- IRR
- 2.5%
- Equity multiple
- 1.18×
- Total profit
- $13,201
- Equity at exit
- $22,307
Cash invested: $72,240 (down + closing). Projections, not guarantees.
Landlord ↔ Tenant lean methodology
- Overall (CITY)
- 0 Strongly Tenant-Friendly
- State New York
- 15 Strongly Tenant-Friendly · D+10
- County
- — inherits STATE
- City New York
- 0 Strongly Tenant-Friendly · D+34
ZIP-level market 11367
- Active inventory
- 259
- Price-to-rent
- 7.9×
Monthly cashflow live
- Estimated rent
- $2,712 high interval (Pro) →
- Mortgage (P&I)
- −$1,353
- Tax est. 1.5%
- −$322 /mo · $3,870/yr
- Insurance
- −$108
- HOA
- −$0
- Vacancy / Maint / Mgmt
- −$569
- Net cashflow
- $359
Break-even live
UW: 25.0% down · 7.5% · 30yr · 1.5% tax · 5.0% vac · 8.0% maint · 8.0% mgmt
Financing live
Cash to close
- Down payment
- $64,500
- Closing costs
- $7,740
- Reserves months
- —
- Total cash needed
- —
Loan-product check · same deal, 3 products live
Conventional
25% down · 7.5% · 30yr
- Down + closing
- —
- Monthly P&I
- —
- Monthly cashflow
- —
- DSCR
- —
- Eligible?
- —
Personal DTI + credit; lowest rate.
DSCR
20% down · 8.5% · 30yr
- Down + closing
- —
- Monthly P&I
- —
- Monthly cashflow
- —
- DSCR
- —
- Eligible?
- —
No personal income docs; deal must DSCR.
Hard money
10% down · 12.0% · 12mo
- Down + closing
- —
- Monthly P&I
- —
- Monthly cashflow
- —
- DSCR
- —
- Eligible?
- —
Short-term bridge; refi at stabilization.
Rent comps 33 comps
| Address | Beds | Baths | Sqft | Rent | $/sqft | DOM | Units | Dist |
|---|---|---|---|---|---|---|---|---|
| 150-25 72nd Rd Flushing, NY | 1.0 | 1.0 | 700 | $2,300 | $3.29 | 24d | 1 | 0.05mi |
| 71-82 Parsons Blvd Unit 503 Kew Gardens Hills, NY | 2.0 | 1.5 | 900 | $4,000 | $4.44 | 24d | 1 | 0.26mi |
| 71-82 Parsons Blvd Unit 303 Kew Gardens Hills, NY | 2.0 | 1.5 | 900 | $4,000 | $4.44 | 14d | 1 | 0.26mi |
| 71-82 Parsons Blvd Unit 516 Kew Gardens Hills, NY | 2.0 | 1.5 | 900 | $3,500 | $3.89 | 3d | 1 | 0.26mi |
| 71-82 Parsons Blvd Unit 702 Kew Gardens Hills, NY | 1.0 | 1.0 | 1000 | $2,900 | $2.90 | 21d | 1 | 0.26mi |
| 7157 161 St Apt 5B Flushing, NY | 2.0 | 2.0 | 1100 | $2,600 | $2.36 | 24d | 1 | 0.42mi |
| 7133 162nd St Unit 3F Fresh Meadows, NY | 2.0 | 2.0 | 850 | $2,700 | $3.18 | 24d | 1 | 0.47mi |
| 163-07 72nd Ave Unit 3G Flushing, NY | 2.0 | 2.0 | 716 | $2,900 | $4.05 | 24d | 1 | 0.53mi |
| 7835 147th St Unit 2E Flushing, NY | 1.0 | 1.0 | 700 | $2,200 | $3.14 | 6d | 1 | 0.64mi |
| 7837 Main St Unit 2G Queens, NY | 1.0 | 1.0 | 700 | $2,300 | $3.29 | 24d | 1 | 0.67mi |
| 14112 78th Rd Unit 1G Flushing, NY | 1.0 | 1.0 | 700 | $2,200 | $3.14 | 24d | 1 | 0.74mi |
| 135-26 78th Ave Unit 2FL Flushing, NY | 2.0 | 1.0 | 900 | $2,800 | $3.11 | 2d | 1 | 0.79mi |
| 16525 Union Tpke Fresh Meadows, NY | 2.0 | 1.0 | 1000 | $2,900 | $2.90 | 24d | 1 | 0.84mi |
| 80-12 165th St Unit 3 Jamaica, NY | 2.0 | 1.5 | 960 | $2,800 | $2.92 | 24d | 1 | 0.86mi |
| 7629 170th St Fresh Meadows, NY | 2.0 | 1.0 | 924 | $2,800 | $3.03 | 3d | 1 | 0.94mi |
| 84-03 Lander St Unit 2B Jamaica, NY | 2.0 | 2.0 | 850 | $3,250 | $3.82 | 24d | 1 | 1.07mi |
| 13915 83rd Ave #717 Jamaica, NY | 1.0 | 1.0 | 800 | $2,400 | $3.00 | 5d | 1 | 1.10mi |
| 14160 84th Rd Unit 2G Jamaica, NY | 1.0 | 1.0 | 700 | $2,200 | $3.14 | 14d | 1 | 1.13mi |
| 141-35 Pershing Cres Unit 1B Jamaica, NY | 1.0 | 1.5 | 1100 | $2,800 | $2.55 | 21d | 1 | 1.16mi |
| 61-41 173rd St Unit 3rd fl Flushing, NY | 2.0 | 1.0 | 1000 | $2,500 | $2.50 | 22d | 1 | 1.17mi |
| 8455 Daniels St Unit 5H Jamaica, NY | 1.0 | 1.0 | 750 | $2,300 | $3.07 | 19d | 1 | 1.17mi |
| 178-05 69th Ave Unit 2 Flushing, NY | 2.0 | 1.0 | 750 | $2,700 | $3.60 | 24d | 1 | 1.28mi |
| 123-40 83rd Ave Unit 2107 Jamaica, NY | 1.0 | 1.0 | 750 | $2,573 | $3.43 | 24d | 1 | 1.35mi |
| 123-40 83rd Ave Unit 8B Queens, NY | 1.0 | 1.0 | 800 | $2,450 | $3.06 | 24d | 1 | 1.35mi |
| 11019 72nd Rd Unit 1B Forest Hills, NY | 1.0 | 1.0 | 750 | $3,200 | $4.27 | 14d | 1 | 1.39mi |
| 7540 Austin St Unit 4HR Forest Hills, NY | 1.0 | 1.0 | 841 | $2,990 | $3.56 | 24d | 1 | 1.43mi |
| 11007 73rd Rd Forest Hills, NY | 1.0 | 1.0 | 950 | $1,800 | $1.89 | 19d | 1 | 1.45mi |
| 138-28 Queens Blvd Unit 5G Briarwood, NY | 1.0 | 1.0 | 650 | $2,750 | $4.23 | 24d | 1 | 1.46mi |
| 13828 Queens Blvd Jamaica, NY | 1.0 | 1.0 | 640 | $2,700 | $4.22 | 19d | 1 | 1.46mi |
| 13828 Queens Blvd Unit 2E Briarwood, NY | 1.0 | 1.0 | 700 | $2,600 | $3.71 | 8d | 1 | 1.46mi |
| 13828 Queens Blvd Unit 7A Briarwood, NY | 2.0 | 1.0 | 810 | $3,600 | $4.44 | 24d | 1 | 1.46mi |
| 10919 72nd Rd Unit 6F Forest Hills, NY | 1.0 | 1.0 | 696 | $3,485 | $5.01 | 11d | 1 | 1.49mi |
| 11131 66th Ave Unit 3C Forest Hills, NY | 1.0 | 1.0 | 600 | $2,000 | $3.33 | 5d | 1 | 1.50mi |
HOA detail condo
- Monthly dues
- $0 · $0/yr
- Likely covers
- landscapingdoormansecurity
- Assessments
- None detected in remarks — confirm with the listing agent.
Listing history 21 events
-
2026-06-18days on market $258,000 Active 285 DOM
-
2026-06-17days on market $258,000 Active 284 DOM
-
2026-06-15days on market $258,000 Active 282 DOM
-
2026-06-13days on market $258,000 Active 280 DOM
-
2026-06-10days on market $258,000 Active 276 DOM
-
2026-06-08days on market $258,000 Active 275 DOM
-
2026-06-03days on market $258,000 Active 270 DOM
-
2026-06-01days on market $258,000 Active 268 DOM
-
2026-05-31days on market $258,000 Active 267 DOM
-
2025-11-28price $258,000
-
2025-09-06$268,000 Active
-
2025-09-04historical
-
2025-06-22price $274,900
-
2025-02-05price $299,000
-
2024-12-09price $320,000
-
2024-11-03$330,000 Active
-
2024-04-19historical
-
2024-03-19$320,000 Active
-
2021-03-18soldstatus $285,000 Closed
-
2020-07-08$295,000 Active
-
2009-05-01soldstatus $237,000
ⓘ Source: listings_history table (triggers on properties + properties_extension) + one-shot
backfill from property_details.listing_events for pre-trigger history.
Climate risk First Street
- Flood 6/10 Major FEMA zone X (unshaded) · 57% chance over 30 yrs
- Wildfire 1/10 Low
- Heat 7/10 Severe 7 d/yr ≥99°F today · 15 d/yr by 30 yrs out
- Wind 6/10 Major 27% chance of damaging wind over 30 yrs
- Air quality 4/10 Moderate 6 unhealthy d/yr today · 6 by 30 yrs out
Nearby sold comps map
Loading sold comps map…
Walkable amenities ~0.75 mi
Loading nearby amenities…
Taxation est. · year 1
- Rental income
- $32,542
- − Mortgage interest
- −$14,452
- − Property taxes
- −$3,870
- − Insurance
- −$1,290
- − Repairs & maintenance
- −$2,603
- − Management
- −$2,603
- − Depreciation
- −$7,505
- Taxable income
- $218
- Est. tax owed @ 24.0%
- −$52
- After-tax cash flow
- $4,260/yr
For passive investors: Depreciation is non-cash, so a rental often shows a tax loss while cash-flowing — sheltering income. Rental losses are passive: they offset passive income freely, and up to $25,000/yr can offset ordinary (W-2) income if you actively participate and your MAGI is under $100k (phasing out to $0 by $150k); unused losses carry forward. On sale, claimed depreciation is recaptured at up to 25%, and gains may owe capital-gains tax (a 1031 exchange can defer both). Figures are a year-1 estimate at your 24.0% rate — not tax advice; consult a CPA.
Schools (NCES district)
No district data.
Livability — New York
- Score
- 75/100
- State rank
- #268
- US rank
- #4188
Category grades
Schools grade is shown separately in the Schools card above.
Census & demographics
- Census place
- New York, NY
- County
- Queens County · 1,914,869 people
- City population
- 7,731,280
- Metro
- New York-Newark-Jersey City, NY-NJ-PA
- Population (ZIP)
- 40,923
- Household income
- $75,061
- Rent vs Own
- Severe rent burden
- 2010.0
Population outlook (Queens County) Hauer SSP2
- Today (2025)
- 2,546,320 people
- By 2030
- 2,643,059 · +3.8%
- By 2040
- 2,815,563 · +10.6%
- By 2050
- 2,944,423 · +15.6%
- By 2075
- 3,123,338 · +22.7%
- By 2100
- 3,098,688 · +21.7%
Race, ethnicity, and origin ACS 2023
- Neighborhood character
- Highly diverse neighborhood (Simpson 0.72)
- Race & ethnicity
- White 42% Asian 25% Hispanic / Latino 19% Black 7% Two or more races 7%
- Hispanic origin (detail)
- Puerto Rican 3% Dominican 6%
- Common ancestry
- Scotch-Irish 5% Romanian 3% Hispanic 1%
- Foreign-born
- 41% · China, Canada, Jamaica
- Languages at home
- 41% English-only · Chinese 16% Spanish 15% Russian/Polish/Slavic 9%
Political lean MEDSL · Queens
- 2024 margin
- Strong D (+24.6) · D 62.3% · R 37.7%
- 2008→2024 swing
- -26.2pp toward R · 2008: 50.8pp · 2024: 24.6pp
- All cycles
- 2024: D+24.6 2020: D+45.2 2016: D+53.4 2012: D+58.5 2008: D+50.8
Not yet ingested
- Civics
- —
Market trends
- HPI YoY
- ▼ -211.36%
- Current HPI
- 220.6177
- Rent YoY
- —
- Metro
- New York-Newark-Jersey City, NY-NJ-PA
- State GDP YoY
- ▲ 2.60%
- F500 in state
- 92
Industry mix (Fortune 500 HQ in NY)
| Industry | F500 HQs | Revenue |
|---|---|---|
| Financial Services | 10 | $950B |
|
||
| Consumer Goods | 9 | $162B |
|
||
| Insurance | 4 | $225B |
|
||
| Telecommunications | 2 | $144B |
|
||
| Pharmaceuticals | 2 | $112B |
|
||
| Media / Entertainment | 2 | $69B |
|
||
Price history
+8.9% since first listed12 events — show timeline
- 2025-11-28 Price Changed $258,000 OneKey® MLS as Distributed by MLS Grid
- 2025-09-06 Listed $268,000 OneKey® MLS as Distributed by MLS Grid
- 2025-09-04 Listing Removed — OneKey® MLS as Distributed by MLS Grid
- 2025-06-22 Price Changed $274,900 OneKey® MLS as Distributed by MLS Grid
- 2025-02-05 Price Changed $299,000 OneKey® MLS as Distributed by MLS Grid
- 2024-12-09 Price Changed $320,000 OneKey® MLS as Distributed by MLS Grid
- 2024-11-03 Listed $330,000 OneKey® MLS as Distributed by MLS Grid
- 2024-04-19 Listing Removed — OneKey® MLS as Distributed by MLS Grid
- 2024-03-19 Listed $320,000 OneKey® MLS as Distributed by MLS Grid
- 2021-03-18 Sold (MLS) $285,000 OneKey® MLS as Distributed by MLS Grid
- 2020-07-08 Listed $295,000 OneKey® MLS as Distributed by MLS Grid
- 2009-05-01 Sold (Public Records) $237,000 Public Records
Cash-flow waterfall
monthlySold comps — $/sqft
last 12 mo · ≤1 miLoading sold comps…