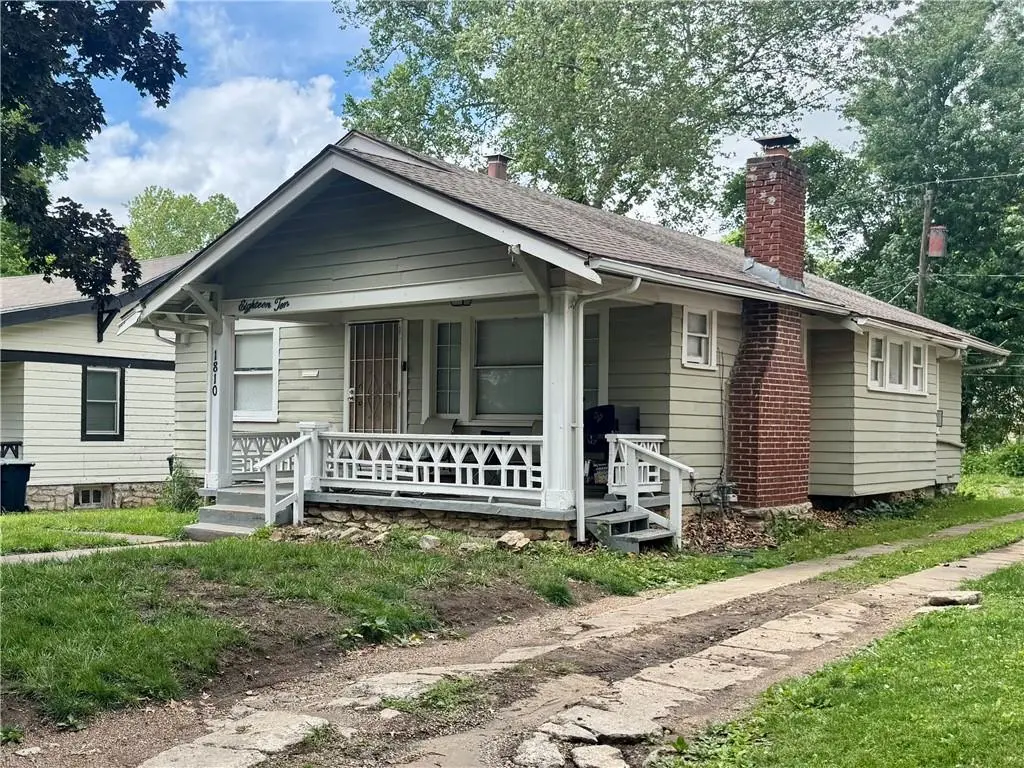
1810 E 70th St · Kansas City, MO
Flood risk 1/10 · Minimal
- FEMA flood zone
- X (unshaded)
- Chance of flooding over 30 yrs
- 0.0%
- Est. flood insurance / yr
- $473 – $860
Fire risk 1/10 · Minimal
- Est. fire insurance / yr
- $1,054 – $1,958
Heat risk 4/10 · Minor
- Hot days now (above 106°F)
- 7 days/yr
- Hot days in 30 yrs
- 17 days/yr
Wind risk 2/10 · Minimal
- Chance of severe wind over 30 yrs
- —
Air-quality risk 3/10 · Minor
- Unhealthy air days now
- 2 days/yr
- Unhealthy air days in 30 yrs
- 4 days/yr
Risk factors via First Street. Map © Google.
Why this score? — see what drove the C+ grade
The composite is a weighted blend of 9 inputs, each scored 0–100. Each bar is that input's sub-score; the figure is the points it added to the 100-point composite (weight × sub-score).
- Cash flow +27.0/30.0
- ARV discount +10.7/15.0
- DSCR +9.3/10.0
- 1% rule +6.5/10.0
- Livability +3.9/5.0
- Rent growth +3.6/5.0
- Condition / age +2.5/5.0
- Schools +1.5/10.0
- Appreciation +0.0/10.0
$122,500
🖨 Deal sheet 📄 Offer letter ✓ Due diligence
Listing remarks MLS
Welcome to this charming 3-bedroom bungalow located in the heart of Kansas City on a peaceful dead-end street, within walking distance to Blenheim Park Trail. Step inside to discover beautiful wood floors throughout the home, exuding warmth and character. The kitchen boasts a large pantry, perfect for all your storage needs. Home needs a little TLC. Owner/Agent
Key facts
- 5,843 sq ft lot
- Garage
- Built 1925
Property features AI
Finance
- Other: No maintenance provided by a community association; Directions: From downtown Kansas City take US-71 South to the Gregory Boulevard exit; left on East Gregory Boulevard, right on Woodland Avenue, left on East 70th Street — property on the right.
- HOA & community: No association fees
Exterior
- Parking: Rear-facing garage access; 1-car garage; Off-street parking
- Utilities: Public water; Public sewer
- Home design: Single-family residence; Bungalow/Ranch floor plan; Residential property
- Construction: Stone and frame construction; Composition roof; Built approximately 76–100 years ago
- Exterior features: Lot approximately 5,843 square feet; Located in an area with unknown flood plain status
Interior
- Bedrooms: 3 bedrooms
- Bathrooms: 1 full bathroom
- Heating & cooling: Forced air heating; Electric cooling
- Interior features: Living/dining combo; Full basement with stone/rock walls and garage entrance; Living room fireplace (1)
- Laundry & utility: Laundry in basement
Neighborhood map
What this means for you Summary
Snapshot
- This is a 3-bed/1.0-bath single-family listed at $122k.
Deal economics
- At list price, monthly cash flow is $342 ($4k/yr) — positive.
- The deal already cash-flows at list — no discount required.
- Meets the 1% rule at list price ($1k rent vs $122k).
- Cap rate 9.6% vs local median 3.9% in Kansas City — top-decile yield for the area; either an underpriced asset or a hidden risk that comps aren't pricing in. Stress-test before assuming the spread holds.
Location & tenants
- Location reads 78/100 on livability (#28 in MO, #2,671 nationally) — a middle-class / working-renter tenant base. Strengths: amenities A+, commute A+, cost of living A+; Watch: schools C-, crime F.
- Kansas City 33 (urban): math 12% / reading 24% proficiency, ranked #308 of 324 in MO (top 95%) — low school quality limits family demand, transient renter base, plan for 1-2y turnover; 75% free/reduced lunch — lower-income household profile, screen leases tightly.
- Market conditions: Rents rising fast (+4.4%/yr); 187 active listings in the ZIP; 40 comparable units currently listed for rent nearby; rentals at typical pace (median 16d on market — plan ~3-4 weeks tenant-placement turnaround); lower-income renter base — watch delinquency; 4,002 units permitted in Jackson County in 2024 (2,271 in 5+ unit buildings).
- This rent runs 40% of the median local income ($42k/yr) — at the standard rent-burdened threshold; future hikes will face affordability resistance.
Forward outlook
- Local home prices are declining (-3.0%/yr); year-one equity from $847 of loan paydown is wiped out by about $4k of value loss. Plan a longer hold.
- Jackson County population projected at +4% by 2050 — modest demand growth; plan on rents tracking national, not racing it.
- At projected returns (-3.0% appreciation + 4.4% rent growth), your $34k cash investment doubles in ~9 years — after that, you're playing with house money.
Negotiation context
- Only 11 days on market — expect competitive offers; lowballing is unlikely to land.
- 7 sale attempts since 20y ago with the ask held roughly flat each time — persistent listings suggest the price (not the market) is what's stuck; bring a comps-based counter.
- Current owner paid $41k; list at $122k implies a 197% gain — meaningful room to come down on a strong offer.
Risks & watch-outs
- Watch-outs: built in 1925 — expect roof / HVAC / electrical / plumbing capex.
Questions for the listing agent
- Built in 1925 — when were the roof, HVAC, electrical panel, plumbing, and water heater last replaced?
- Is there a deadline driving the sale (1031 exchange, divorce, estate, relocation)? That informs how much negotiation room exists.
- Crime grade is F in this area — have there been break-ins, vandalism, or insurance claims at this property in the last 3 years? What carrier currently insures it and at what premium?
- What's the average days-on-market for RENTAL listings here right now (not sales)? A rising rental-DOM trend means longer vacancies and softer asking-rent achievability than the comps imply.
- What's the recent tenant-quality profile in this submarket — average credit score on applications, eviction rate, late-payment / NSF rate, and stable-employment percentage? A property-management company in the area should have these aggregated.
- How much new for-sale + rental construction is in the pipeline within 1–3 miles? Heavy new supply typically softens prices + rents 12–24 months out; constrained supply supports both.
Investment metrics
- 1% rule
- 1.15% ✓
- Cap rate
- 9.65%
- Cash-on-cash
- 11.97%
- DSCR
- 1.53
- GRM
- 7.2
CMA / ARV
- ARV (on-the-fly)
- $131,824
- Comps found
- 12
Show comp detail 12 sales within ~0.75 mi
| Address | Dist | Beds/Ba | Sqft | Sold | Price | $/sf | Match |
|---|---|---|---|---|---|---|---|
| 7121 Woodland Ave | 0.20mi | 4/1.0 (+1) | 1,181 (-4%) | 3mo | $129,000 | $109 | 76 |
| 7336 Olive St | 0.56mi | 3/1.0 | 1,232 (0%) | 3mo | $77,000 | $63 | 71 |
| 7104 Tracy Ave | 0.49mi | 4/1.0 (+1) | 1,188 (-4%) | 3mo | $115,000 | $97 | 64 |
| 7300 Tracy Ave | 0.61mi | 3/1.0 | 1,186 (-4%) | 3mo | $175,000 | $148 | 62 |
| 936 E Gregory Blvd | 0.62mi | 2/1.5 (-1) | 1,184 (-4%) | 5mo | $189,900 | $160 | 54 |
| 6943 S Benton Ave | 0.62mi | 3/2.0 | 1,312 (+6%) | 7mo | $138,000 | $105 | 51 |
| 849 E 71st Ter | 0.65mi | 3/2.0 | 1,292 (+5%) | 9mo | $239,000 | $185 | 50 |
| 7404 Tracy Ave | 0.71mi | 3/2.0 | 1,175 (-5%) | 8mo | $164,000 | $140 | 49 |
| 6727 Agnes Ave | 0.73mi | 3/1.0 | 1,100 (-11%) | 4mo | $90,000 | $82 | 45 |
| 7013 Bellefontaine Ave | 0.74mi | 2/1.0 (-1) | 1,144 (-7%) | 6mo | $90,000 | $79 | 43 |
| 7420 Euclid Ave | 0.58mi | 4/2.0 (+1) | 1,088 (-12%) | 6mo | $114,900 | $106 | 40 |
| 7434 Wabash Ave | 0.69mi | 2/1.5 (-1) | 1,384 (+12%) | 8mo | $148,000 | $107 | 34 |
Match score weights: distance 35% · size 25% · config 20% · recency 20%. Top-matched comps best support the ARV.
Projected returns pro-forma
-3.0% appreciation · 4.42% rent growth · sell at horizon
- IRR
- 3.0%
- Equity multiple
- 1.12×
- Total profit
- $3,964
- Equity at exit
- $18,265
- IRR
- 13.7%
- Equity multiple
- 2.17×
- Total profit
- $40,053
- Equity at exit
- $10,592
Cash invested: $34,300 (down + closing). Projections, not guarantees.
Landlord ↔ Tenant lean methodology
- Overall (STATE)
- 81 Strongly Landlord-Friendly
- State Missouri
- 81 Strongly Landlord-Friendly · R+10
- County
- — inherits STATE
- City
- — inherits STATE
ZIP-level market 64130
- Home prices YoY
- -21.5%
- Rents YoY
- 4.4%
- Active inventory
- 187
- Price-to-rent
- 7.2×
Monthly cashflow live
- Estimated rent
- $1,411 high interval (Pro) →
- Mortgage (P&I)
- −$642
- Tax from tax record
- −$79 /mo · $948/yr
- Insurance
- −$51
- HOA
- −$0
- Vacancy / Maint / Mgmt
- −$296
- Net cashflow
- $342
Break-even live
UW: 25.0% down · 7.5% · 30yr · 1.5% tax · 5.0% vac · 8.0% maint · 8.0% mgmt
Financing live
Cash to close
- Down payment
- $30,625
- Closing costs
- $3,675
- Reserves months
- —
- Total cash needed
- —
Loan-product check · same deal, 3 products live
Conventional
25% down · 7.5% · 30yr
- Down + closing
- —
- Monthly P&I
- —
- Monthly cashflow
- —
- DSCR
- —
- Eligible?
- —
Personal DTI + credit; lowest rate.
DSCR
20% down · 8.5% · 30yr
- Down + closing
- —
- Monthly P&I
- —
- Monthly cashflow
- —
- DSCR
- —
- Eligible?
- —
No personal income docs; deal must DSCR.
Hard money
10% down · 12.0% · 12mo
- Down + closing
- —
- Monthly P&I
- —
- Monthly cashflow
- —
- DSCR
- —
- Eligible?
- —
Short-term bridge; refi at stabilization.
Rent comps 40 comps
| Address | Beds | Baths | Sqft | Rent | $/sqft | DOM | Units | Dist |
|---|---|---|---|---|---|---|---|---|
| 1850 E 68th Ter Kansas City, MO | 4.0 | 2.0 | 1400 | $1,600 | $1.14 | 16d | 1 | 0.21mi |
| 1831 E 68th St Kansas City, MO | 3.0 | 1.0 | 1043 | $1,250 | $1.20 | 16d | 1 | 0.25mi |
| 2120 E 68th Ter Kansas City, MO | 2.0 | 1.0 | 930 | $1,200 | $1.29 | 23d | 1 | 0.25mi |
| 2422 E 70th Ter Kansas City, MO | 2.0 | 1.0 | 748 | $1,356 | $1.81 | 12d | 1 | 0.35mi |
| 1805 E 67th St Kansas City, MO | 2.0 | 1.0 | 1064 | $1,200 | $1.13 | 16d | 1 | 0.38mi |
| 2237 E 67th St Kansas City, MO | 4.0 | 1.0 | 1300 | $1,500 | $1.15 | 16d | 1 | 0.43mi |
| 2421 E 67th Ter Kansas City, MO | 2.0 | 1.0 | 816 | $1,125 | $1.38 | 16d | 1 | 0.45mi |
| 2430 E 67th Ter Kansas City, MO | 3.0 | 2.0 | 960 | $1,195 | $1.24 | 43d | 1 | 0.47mi |
| 1435 E 66th Ter Kansas City, MO | 3.0 | 1.0 | 988 | $1,340 | $1.36 | 12d | 1 | 0.52mi |
| 6653 Lydia Ave Kansas City, MO | 3.0 | 1.0 | 962 | $1,500 | $1.56 | 16d | 1 | 0.54mi |
| 7427 Arleta Blvd Kansas City, MO | 2.0 | 1.0 | 805 | $1,150 | $1.43 | 43d | 1 | 0.54mi |
| 2607 E 73rd St Kansas City, MO | 2.0 | 1.0 | 1212 | $1,050 | $0.87 | 23d | 1 | 0.56mi |
| 7022 S Benton Ave Kansas City, MO | 3.0 | 1.5 | 1100 | $1,095 | $1.00 | 14d | 1 | 0.56mi |
| 7133 Agnes Ave Kansas City, MO | 3.0 | 2.0 | 1100 | $1,645 | $1.50 | 23d | 1 | 0.68mi |
| 7036 Bellefontaine Ave Unit A Kansas City, MO | 2.0 | 1.0 | 810 | $1,200 | $1.48 | 2d | 1 | 0.69mi |
| 7411 Montgall Ave Kansas City, MO | 3.0 | 1.0 | 840 | $1,200 | $1.43 | 43d | 1 | 0.71mi |
| 7240 Agnes Ave Kansas City, MO | 3.0 | 1.0 | 1140 | $1,350 | $1.18 | 1d | 1 | 0.71mi |
| 7317 Agnes Ave Kansas City, MO | 2.0 | 1.0 | 767 | $895 | $1.17 | 23d | 1 | 0.78mi |
| 6404 The Paseo Kansas City, MO | 1.0–2.0 | 1.0–2.0 | 942 | $1,600 | $1.70 | 2d | 6 | 0.78mi |
| 6812 College Ave Kansas City, MO | 4.0 | 2.0 | 1152 | $1,795 | $1.56 | 23d | 1 | 0.84mi |
| 6703 Walrond Ave Kansas City, MO | 2.0 | 1.0 | 912 | $1,200 | $1.32 | 1d | 1 | 0.85mi |
| 7412 Bellefontaine Ave Unit A Kansas City, MO | 2.0 | 1.0 | 780 | $1,200 | $1.54 | 2d | 1 | 0.87mi |
| 1836 E 77th St Kansas City, MO | 2.0 | 1.0 | 1200 | $1,150 | $0.96 | 21d | 1 | 0.88mi |
| 6431 S Benton Ave Kansas City, MO | 3.0 | 1.0 | 1160 | $1,225 | $1.06 | 23d | 1 | 0.90mi |
| 6551 Rockhill Rd Kansas City, MO | 1.0–2.0 | 1.0–2.0 | 912 | $2,128 | $2.33 | 1d | 10 | 0.92mi |
| 3106 E 75th St Kansas City, MO | 3.0 | 1.5 | 985 | $1,225 | $1.24 | 21d | 1 | 0.95mi |
| 6518 Rockhill Rd Kansas City, MO | 2.0 | 1.0 | 900 | $2,090 | $2.32 | 43d | 1 | 0.95mi |
| 6512 Rockhill Rd Kansas City, MO | 2.0 | 1.0 | 900 | $1,990 | $2.21 | 1d | 1 | 0.96mi |
| 7115 Bales Ave Kansas City, MO | 3.0 | 1.0 | 865 | $1,350 | $1.56 | 16d | 1 | 0.98mi |
| 6821 Bales Ave Kansas City, MO | 3.0 | 1.5 | 1430 | $1,595 | $1.12 | 19d | 1 | 0.98mi |
| 7127 Bales Ave Kansas City, MO | 3.0 | 1.0 | 900 | $1,350 | $1.50 | 23d | 1 | 0.98mi |
| 1830 E 78th St Kansas City, MO | 3.0 | 1.0 | 1000 | $1,350 | $1.35 | 12d | 1 | 1.03mi |
| 7426 Indiana Ave Kansas City, MO | 3.0 | 1.0 | 1100 | $1,400 | $1.27 | 43d | 1 | 1.05mi |
| 1861 E 78th St Kansas City, MO | 3.0 | 1.0 | 864 | $1,095 | $1.27 | 16d | 1 | 1.07mi |
| 1702 Bushman Dr Kansas City, MO | 1.0–2.0 | 1.0–2.0 | 895 | $1,065 | $1.19 | 43d | 1 | 1.10mi |
| 6817 Cleveland Ave Kansas City, MO | 2.0 | 1.0 | 779 | $1,100 | $1.41 | 43d | 1 | 1.17mi |
| 662 E 63rd St Kansas City, MO | 2.0 | 2.0 | 951 | $1,655 | $1.74 | 44d | 1 | 1.24mi |
| 6024 Tracy Ave Kansas City, MO | 3.0 | 1.0 | 1000 | $1,250 | $1.25 | 16d | 1 | 1.26mi |
| 7605 Locust St Kansas City, MO | 2.0 | 1.0 | 744 | $1,325 | $1.78 | 7d | 1 | 1.27mi |
| 6014 Virginia Ave Kansas City, MO | 2.0 | 1.0 | 1072 | $1,111 | $1.04 | 7d | 1 | 1.27mi |
Listing history 9 events
-
2026-06-09days on market $122,500 Active 11 DOM
-
2026-06-08days on market $122,500 Active 10 DOM
-
2026-06-07days on market $122,500 Active 9 DOM
-
2026-06-05remarks 394-char remark
-
2026-06-05days on market $122,500 Active 6 DOM
-
2026-06-03days on market $122,500 Active 5 DOM
-
2026-06-02days on market $122,500 Active 4 DOM
-
2026-06-01days on market $122,500 Active 3 DOM
-
2026-05-31days on market $122,500 Active 2 DOM
ⓘ Source: listings_history table (triggers on properties + properties_extension) + one-shot
backfill from property_details.listing_events for pre-trigger history.
Tax reassessment forecast MO · Resets to sale price
- Current annual tax
- $948 · $79/mo
- Projected year-2 tax
- $1,188 · $99/mo
- Expected delta
- +$240/yr (+$20/mo · 25.3%)
ⓘ Screening estimate from a state-policy table — verify with the county assessor before closing.
Climate risk First Street
- Flood 1/10 Low FEMA zone X (unshaded) · 0% chance over 30 yrs
- Wildfire 1/10 Low
- Heat 4/10 Moderate 7 d/yr ≥106°F today · 17 d/yr by 30 yrs out
- Wind 2/10 Low
- Air quality 3/10 Moderate 2 unhealthy d/yr today · 4 by 30 yrs out
Nearby sold comps map
Loading sold comps map…
Walkable amenities ~0.75 mi
Loading nearby amenities…
Taxation est. · year 1
- Rental income
- $16,932
- − Mortgage interest
- −$6,862
- − Property taxes
- −$948
- − Insurance
- −$612
- − Repairs & maintenance
- −$1,355
- − Management
- −$1,355
- − Depreciation
- −$3,564
- Taxable income
- $2,236
- Est. tax owed @ 24.0%
- −$537
- After-tax cash flow
- $3,570/yr
For passive investors: Depreciation is non-cash, so a rental often shows a tax loss while cash-flowing — sheltering income. Rental losses are passive: they offset passive income freely, and up to $25,000/yr can offset ordinary (W-2) income if you actively participate and your MAGI is under $100k (phasing out to $0 by $150k); unused losses carry forward. On sale, claimed depreciation is recaptured at up to 25%, and gains may owe capital-gains tax (a 1031 exchange can defer both). Figures are a year-1 estimate at your 24.0% rate — not tax advice; consult a CPA.
Schools (NCES district)
- District
- Kansas City 33
- NCES district ID
- 2916400
- Math proficiency
- 12% ▼ -8.00%
- Reading proficiency
- 24% ▬ 0.00%
- Median HH income
- $35,227
- Composite
- 14.8/100
- National rank
- #9387
- State rank
- #308 of 324 in MO
Livability — Kansas City
- Score
- 78/100
- State rank
- #28
- US rank
- #2671
Category grades
Schools grade is shown separately in the Schools card above.
Census & demographics
- Census place
- Kansas City, MO
- County
- Jackson County · 687,798 people
- City population
- 439,467
- Metro
- Kansas City, MO-KS
- Population (ZIP)
- 19,644
- Household income
- $42,221
- Rent vs Own
- Severe rent burden
- 1132.0
Population outlook (Jackson County) Hauer SSP2
- Today (2025)
- 719,589 people
- By 2030
- 731,456 · +1.6%
- By 2040
- 746,689 · +3.8%
- By 2050
- 749,289 · +4.1%
- By 2075
- 736,227 · +2.3%
- By 2100
- 668,210 · -7.1%
Race, ethnicity, and origin ACS 2023
- Neighborhood character
- Predominantly Black (80%)
- Race & ethnicity
- Black 80% White 9% Hispanic / Latino 8% Two or more races 6%
- Hispanic origin (detail)
- Mexican 5%
- Common ancestry
- Lithuanian 1% Swedish 0%
- Foreign-born
- 6% · Canada
- Languages at home
- 92% English-only · Spanish 7%
Political lean MEDSL · Jackson
- 2024 margin
- D (+19.3) · D 58.9% · R 39.5% · Other 1.6%
- 2008→2024 swing
- -6.1pp toward R · 2008: 25.4pp · 2024: 19.3pp
- All cycles
- 2024: D+19.3 2020: D+22.0 2016: D+16.6 2012: D+19.0 2008: D+25.4
Not yet ingested
- Civics
- —
Market trends
- HPI YoY
- ▼ -73.32%
- Current HPI
- 267.491
- Rent YoY
- ▲ 4.42%
- Metro
- Kansas City, MO-KS
- State GDP YoY
- ▲ 1.84%
- F500 in state
- 20
Industry mix (Fortune 500 HQ in MO)
| Industry | F500 HQs | Revenue |
|---|---|---|
| Healthcare | 1 | $163B |
|
||
| Insurance | 1 | $21B |
|
||
| Industrial Technology | 1 | $17B |
|
||
| Retail | 1 | $16B |
|
||
| Industrial Distribution | 1 | $10B |
|
||
| Utilities | 1 | $9B |
|
||
Price history
+196.6% since first listed31 events — show timeline
- 2026-05-29 Listed $122,500 Heartland MLS as Distributed by MLS Grid
- 2024-08-23 Rental Removed $1,150 RENTLY
- 2024-08-08 Listed for Rent $1,150 RENTLY
- 2024-07-24 Rental Removed $1,195 RENTLY
- 2024-05-30 Price Changed $1,195 RENTLY
- 2024-04-23 Price Changed $1,250 RENTLY
- 2024-04-17 Price Changed $1,280 RENTLY
- 2024-03-20 Price Changed $1,300 RENTLY
- 2024-01-20 Listed for Rent $1,360 RENTLY
- 2023-10-02 Sold (Public Records) — Public Records
- 2023-09-29 Sold (MLS) — Heartland MLS as Distributed by MLS Grid
- 2023-08-31 Pending — Heartland MLS as Distributed by MLS Grid
- 2023-08-28 Price Changed $120,900 Heartland MLS as Distributed by MLS Grid
- 2023-08-21 Relisted — Heartland MLS as Distributed by MLS Grid
- 2023-08-08 Pending — Heartland MLS as Distributed by MLS Grid
- 2023-07-27 Listed $124,900 Heartland MLS as Distributed by MLS Grid
- 2023-04-24 Sold (Public Records) — Public Records
- 2016-04-01 Sold (Public Records) — Public Records
- 2015-10-20 Sold (Public Records) — Public Records
- 2013-02-12 Sold (Public Records) — Public Records
- 2012-05-01 Sold (Public Records) — Public Records
- 2012-04-23 Sold (Public Records) — Public Records
- 2012-04-17 Sold (MLS) — Heartland MLS as Distributed by MLS Grid
- 2011-09-19 Listed $15,000 Heartland MLS as Distributed by MLS Grid
- 2006-05-16 Sold (Public Records) — Public Records
- 2006-04-11 Sold (MLS) — Heartland MLS as Distributed by MLS Grid
- 2006-01-13 Listed $44,500 Heartland MLS as Distributed by MLS Grid
- 2005-12-28 Sold (Public Records) $41,301 Public Records
- 2002-03-27 Sold (Public Records) — Public Records
- 2000-06-01 Sold (Public Records) — Public Records
- 1992-10-02 Sold (Public Records) — Public Records
Property tax history
+4.3%/yrLatest (2025): $948 · -10.9% YoY. Source: county tax records.
Cash-flow waterfall
monthlySold comps — $/sqft
last 12 mo · ≤1 miLoading sold comps…