 Duplex
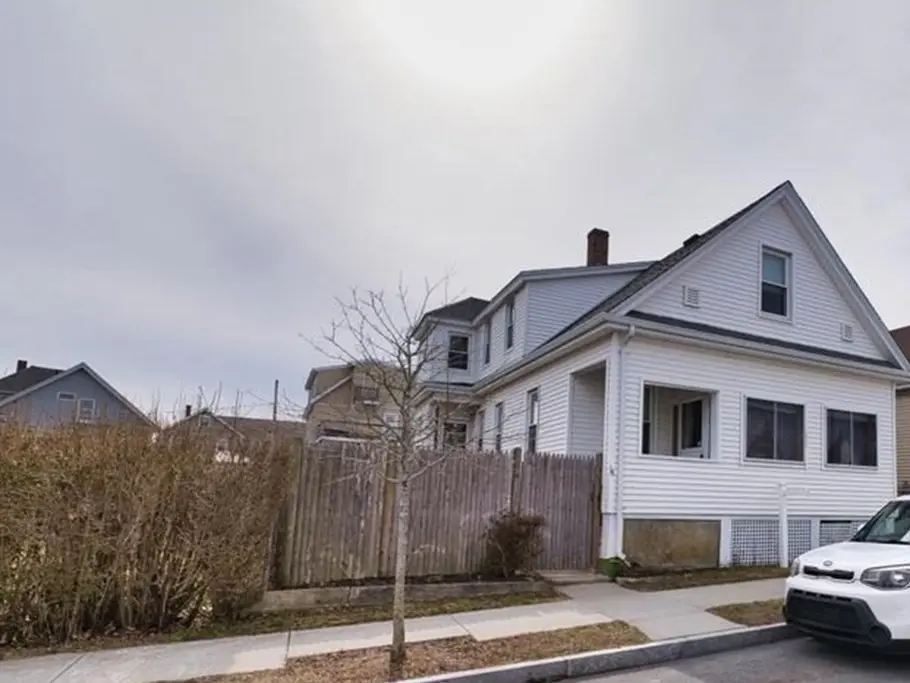
18 Bliss · Bliss Corner, MA
Flood risk 1/10 · Minimal
- FEMA flood zone
- X (unshaded)
- Chance of flooding over 30 yrs
- 0.0%
- Est. flood insurance / yr
- $473 – $860
Fire risk 1/10 · Minimal
- Est. fire insurance / yr
- $915 – $1,699
Heat risk 5/10 · Moderate
- Hot days now (above 94°F)
- 7 days/yr
- Hot days in 30 yrs
- 16 days/yr
Wind risk 8/10 · Major
- Chance of severe wind over 30 yrs
- 80.0%
Air-quality risk 2/10 · Minimal
- Unhealthy air days now
- 1 days/yr
- Unhealthy air days in 30 yrs
- 2 days/yr
Risk factors via First Street. Map © Google.
Why this score? — see what drove the D grade
The composite is a weighted blend of 9 inputs, each scored 0–100. Each bar is that input's sub-score; the figure is the points it added to the 100-point composite (weight × sub-score).
- ARV discount +14.9/15.0
- Cash flow +10.0/30.0
- Schools +4.4/10.0
- Livability +3.1/5.0
- DSCR +2.9/10.0
- Rent growth +2.5/5.0
- Condition / age +2.5/5.0
- 1% rule +1.9/10.0
- Appreciation +0.0/10.0
$494,900
🖨 Deal sheet (PDF) 📄 Offer letter ✓ Due diligence
Multi-family units
County records classify this as Multi-Family (2-4 Unit). Listing-text estimate: 2 units. confirmed
Listing remarks MLS
This is a two unit / multi-family dwelling one up / one on the first floor with a partially separated basement area.The location allows for easy access to the area ameneties including Jones beach which is at the end of the street. Many upgrades have been completed with-in the years to include, whole house insulation - 2016, Roofing shingles and chimney - 2006, New wiring where needed-2000&2010, Vinyl siding- 1994, Side porch - 2019, cellar stairs replaced- 2018, Windows 1999, Full stockaid fence which encloses the back and side yard- 2020. All upgrades are in reasonable to good condition.
Key facts
- New wiring
- Cellar stairs
- Vinyl siding
Tags
Neighborhood map
What this means for you Summary
Snapshot
- This is a 2 × 2-bed/1.0-bath units multifamily listed at $495k.
Deal economics
- At list price, monthly cash flow is $-295 ($-4k/yr) — negative. Per door: $-148/mo.
- To cash-flow at today's rent, offer at most $443k (10.5% below list).
- To meet the 1% rule (rent ≥ 1% of price), the offer needs to be $343k (30.7% below list).
- Recommended offer: $343k (30.7% below list) — sets the bar for 1% rule.
Location & tenants
- Location reads 61/100 on livability (#219 in MA) — a middle-class / working-renter tenant base. Strengths: housing A, employment B+, crime B; Watch: schools C-, amenities F, commute F.
- Dartmouth (suburban): math 44% / reading 55% proficiency, ranked #128 of 302 in MA (top 42%) — families likely to look elsewhere, expect single-tenant / working-renter base with shorter leases.
- Market conditions: 23 active listings in the ZIP; 1 comparable units currently listed for rent nearby; 760 units permitted in Bristol County in 2024 (142 in 5+ unit buildings).
Forward outlook
- Local home prices are declining (-3.0%/yr); year-one equity from $3k of loan paydown is wiped out by about $15k of value loss. Plan a longer hold.
- Bristol County population projected to shrink 3% by 2050 — rents likely to lag national; underwrite the cash flow, not the appreciation.
Negotiation context
- It's been on market 71 days — a 6% lower offer ($465k) is reasonable based on typical stale-listing flexibility.
Risks & watch-outs
- Watch-outs: built in 1900 — expect roof / HVAC / electrical / plumbing capex.
- Climate carrying-cost: severe wind risk, 80% chance of damaging wind over 30y; extreme-heat days projected 7→16/yr by 2055 (HVAC capex compounding) — expect insurance premiums to compound above CPI over the hold.
Questions for the listing agent
- What do current leases actually rent for vs. the listed asking? Can we see a recent rent roll and the last 12 months of T-12 income?
- It's been on market 71 days. Have you received any prior offers? Is the seller open to a 31% concession, seller financing, or rate buy-down credit?
- Can we see the unit-by-unit rent roll, current vacancy, and any below-market leases? What's the average tenancy length?
- What capital expenditures (roof, boiler, parking lot, exteriors) have been made in the last 5 years, and what's planned in the next 2?
- Built in 1900 — when were the roof, HVAC, electrical panel, plumbing, and water heater last replaced?
- Why hasn't it sold? Are there any deal-killer items the seller is aware of (foundation, flood, title, zoning, code violations)?
- Is there a deadline driving the sale (1031 exchange, divorce, estate, relocation)? That informs how much negotiation room exists.
- The area grade is low — what's the realistic commute time and amenity access for the typical tenant pool here? Any planned neighborhood developments (good or bad) we should know about?
- What's the average days-on-market for RENTAL listings here right now (not sales)? A rising rental-DOM trend means longer vacancies and softer asking-rent achievability than the comps imply.
- What's the recent tenant-quality profile in this submarket — average credit score on applications, eviction rate, late-payment / NSF rate, and stable-employment percentage? A property-management company in the area should have these aggregated.
- How much new apartment / multifamily construction is in the pipeline within 1–3 miles? Heavy new supply (>2% of stock underway) typically softens rents 12–24 months out; light construction supports rent growth.
Investment metrics
- 1% rule
- 0.69% ✗
- Cap rate
- 5.58%
- Cash-on-cash
- -2.56%
- DSCR
- 0.89
- GRM
- 12.0
CMA / ARV
- ARV (median comp)
- $591,658
- List price
- $494,900
- Delta
- -16.35%
- Verdict
- UNDERPRICED
- Comps
- 20 within 1.0 mi
Show comp detail 3 sales within ~0.75 mi
| Address | Dist | Beds/Ba | Sqft | Sold | Price | $/sf | Match |
|---|---|---|---|---|---|---|---|
| 16 Garfield St | 0.20mi | 5/3.0 | 1,612 (+3%) | 4mo | $575,000 | $357 | 77 |
| 193 Division St | 0.74mi | 4/2.0 (-1) | 1,569 (+1%) | 10mo | $460,000 | $293 | 51 |
| 1235 Cove Rd | 0.70mi | 4/2.5 (-1) | 1,781 (+14%) | 17mo | $460,000 | $258 | 23 |
Match score weights: distance 35% · size 25% · config 20% · recency 20%. Top-matched comps best support the ARV.
Projected returns pro-forma
-3.0% appreciation · 3.0% rent growth · sell at horizon
- IRR
- -20.6%
- Equity multiple
- 0.28×
- Total profit
- $-99,195
- Equity at exit
- $73,791
- IRR
- -13.9%
- Equity multiple
- 0.20×
- Total profit
- $-111,408
- Equity at exit
- $42,790
Cash invested: $138,572 (down + closing). Projections, not guarantees.
Landlord ↔ Tenant lean methodology
- Overall (STATE)
- 20 Strongly Tenant-Friendly
- State Massachusetts
- 20 Strongly Tenant-Friendly · D+15
- County
- — inherits STATE
- City
- — inherits STATE
ZIP-level market 02748
- Home prices YoY
- -19.9%
- Active inventory
- 23
- Price-to-rent
- 24.1×
Monthly cashflow live
- Estimated rent
- $3,429 high interval (Pro) →
- Mortgage (P&I)
- −$2,595
- Tax from tax record
- −$202 /mo · $2,430/yr
- Insurance
- −$206
- HOA
- −$0
- Vacancy / Maint / Mgmt
- −$720
- Net cashflow
- $-295
Break-even live
Sensitivity live
| Price | -10% $-15 | -5% $-155 | +0% $-295 | +5% $-435 | +10% $-575 |
|---|---|---|---|---|---|
| Rent | -10% $-566 | -5% $-431 | +0% $-295 | +5% $-160 | +10% $-24 |
| Rate | -1.0pp $-46 | -0.5pp $-169 | base $-295 | +0.5pp $-423 | +1.0pp $-554 |
2-unit breakdown (identical units grouped — click to expand)
| Units | Beds | Baths | Est. rent |
|---|---|---|---|
| 2× units | 2 | 1 | $3,430 |
| #1 | 2 | 1 | $1,715 |
| #2 | 2 | 1 | $1,715 |
| Total (2 units) | $3,429 | ||
UW: 25.0% down · 7.5% · 30yr · 1.5% tax · 5.0% vac · 8.0% maint · 8.0% mgmt
Financing live
Cash to close
- Down payment
- $123,725
- Closing costs
- $14,847
- Reserves months
- —
- Total cash needed
- —
Loan-product check · same deal, 3 products live
Conventional
25% down · 7.5% · 30yr
- Down + closing
- —
- Monthly P&I
- —
- Monthly cashflow
- —
- DSCR
- —
- Eligible?
- —
Personal DTI + credit; lowest rate.
DSCR
20% down · 8.5% · 30yr
- Down + closing
- —
- Monthly P&I
- —
- Monthly cashflow
- —
- DSCR
- —
- Eligible?
- —
No personal income docs; deal must DSCR.
Hard money
10% down · 12.0% · 12mo
- Down + closing
- —
- Monthly P&I
- —
- Monthly cashflow
- —
- DSCR
- —
- Eligible?
- —
Short-term bridge; refi at stabilization.
Rent comps 1 comps
| Address | Beds | Baths | Sqft | Rent | $/sqft | DOM | Units | Dist |
|---|---|---|---|---|---|---|---|---|
| 166 Purchase St Unit 1 New Bedford, MA | 4.0 | 1.0 | 1200 | $2,100 | $1.75 | 12d | 1 | 1.05mi |
Listing history 2 events
-
2026-04-18price $494,900 599-char remark
Show marketing remark (599 chars)
This is a two unit / multi-family dwelling one up / one on the first floor with a partially separated basement area.The location allows for easy access to the area ameneties including Jones beach which is at the end of the street. Many upgrades have been completed with-in the years to include, whole house insulation - 2016, Roofing shingles and chimney - 2006, New wiring where needed-2000&2010, Vinyl siding- 1994, Side porch - 2019, cellar stairs replaced- 2018, Windows 1999, Full stockaid fence which encloses the back and side yard- 2020. All upgrades are in reasonable to good condition.
-
2026-03-19$524,900 New 599-char remark
Show marketing remark (599 chars)
This is a two unit / multi-family dwelling one up / one on the first floor with a partially separated basement area.The location allows for easy access to the area ameneties including Jones beach which is at the end of the street. Many upgrades have been completed with-in the years to include, whole house insulation - 2016, Roofing shingles and chimney - 2006, New wiring where needed-2000&2010, Vinyl siding- 1994, Side porch - 2019, cellar stairs replaced- 2018, Windows 1999, Full stockaid fence which encloses the back and side yard- 2020. All upgrades are in reasonable to good condition.
ⓘ Source: listings_history table (triggers on properties + properties_extension) + one-shot
backfill from property_details.listing_events for pre-trigger history.
Tax reassessment forecast MA · Partial reset (capped growth)
- Current annual tax
- $2,430 · $202/mo
- Projected year-2 tax
- $4,259 · $355/mo
- Expected delta
- +$1,829/yr (+$152/mo · 75.3%)
ⓘ Screening estimate from a state-policy table — verify with the county assessor before closing.
Climate risk First Street
- Flood 1/10 Low FEMA zone X (unshaded) · 0% chance over 30 yrs
- Wildfire 1/10 Low
- Heat 5/10 Major 7 d/yr ≥94°F today · 16 d/yr by 30 yrs out
- Wind 8/10 Severe 80% chance of damaging wind over 30 yrs
- Air quality 2/10 Low 1 unhealthy d/yr today · 2 by 30 yrs out
Nearby sold comps map
Loading sold comps map…
Walkable amenities ~0.75 mi
Loading nearby amenities…
Taxation est. · year 1
- Rental income
- $41,148
- − Mortgage interest
- −$27,722
- − Property taxes
- −$2,430
- − Insurance
- −$2,474
- − Repairs & maintenance
- −$3,292
- − Management
- −$3,292
- − Depreciation
- −$14,397
- Taxable loss
- −$12,459
- Est. tax savings @ 24.0%
- +$2,990
- After-tax cash flow
- $-551/yr
For passive investors: Depreciation is non-cash, so a rental often shows a tax loss while cash-flowing — sheltering income. Rental losses are passive: they offset passive income freely, and up to $25,000/yr can offset ordinary (W-2) income if you actively participate and your MAGI is under $100k (phasing out to $0 by $150k); unused losses carry forward. On sale, claimed depreciation is recaptured at up to 25%, and gains may owe capital-gains tax (a 1031 exchange can defer both). Figures are a year-1 estimate at your 24.0% rate — not tax advice; consult a CPA.
Schools (NCES district)
- District
- Dartmouth
- NCES district ID
- 2504020
- Math proficiency
- 44% ▼ -11.00%
- Reading proficiency
- 55% ▼ -5.00%
- Median HH income
- $70,697
- Composite
- 44.31/100
- National rank
- #2830
- State rank
- #128 of 302 in MA
Livability — Bliss Corner
- Score
- 61/100
- State rank
- #219
- US rank
- #18020
Category grades
Schools grade is shown separately in the Schools card above.
Census & demographics
- Census place
- Bliss Corner, MA
- Population (ZIP)
- 11,501
Population outlook (Bristol County) Hauer SSP2
- Today (2025)
- 570,212 people
- By 2030
- 571,181 · +0.2%
- By 2040
- 565,389 · -0.8%
- By 2050
- 552,141 · -3.2%
- By 2075
- 520,923 · -8.6%
- By 2100
- 474,363 · -16.8%
Race, ethnicity, and origin ACS 2023
- Neighborhood character
- Predominantly White (90%)
- Race & ethnicity
- White 90% Two or more races 5% Hispanic / Latino 2% Asian 1%
- Common ancestry
- Russian 39% Lithuanian 6% Romanian 5%
- Foreign-born
- 9% · Vietnam, Canada
- Languages at home
- 82% English-only · Other Indo-European 14% Spanish 2% Vietnamese 1%
Political lean MEDSL · Bristol
- 2024 margin
- Toss-up / Even · D 49.8% · R 48.5% · Other 1.8%
- 2008→2024 swing
- -21.9pp toward R · 2008: 23.2pp · 2024: 1.3pp
- All cycles
- 2024: D+1.3 2020: D+12.0 2016: D+9.3 2012: D+20.5 2008: D+23.2
Not yet ingested
- Civics
- —
Market trends
- HPI YoY
- ▼ -86.28%
- Current HPI
- 347.0123
- Rent YoY
- —
- Metro
- —
- State GDP YoY
- ▲ 2.28%
- F500 in state
- 38
Industry mix (Fortune 500 HQ in MA)
| Industry | F500 HQs | Revenue |
|---|---|---|
| Technology | 3 | $17B |
|
||
| Insurance | 2 | $84B |
|
||
| Retail | 2 | $76B |
|
||
| Life Sciences | 1 | $43B |
|
||
| Energy Technology | 1 | $31B |
|
||
| Aerospace / Defense | 1 | $18B |
|
||
Price history
-5.7% since first listed2 events — show timeline
- 2026-04-18 Price Changed $494,900 MLS PIN
- 2026-03-19 Listed $524,900 MLS PIN
Property tax history
+3.5%/yrLatest (2023): $2,430 · +2.5% YoY. Source: county tax records.
Cash-flow waterfall
monthlySold comps — $/sqft
last 12 mo · ≤1 miLoading sold comps…