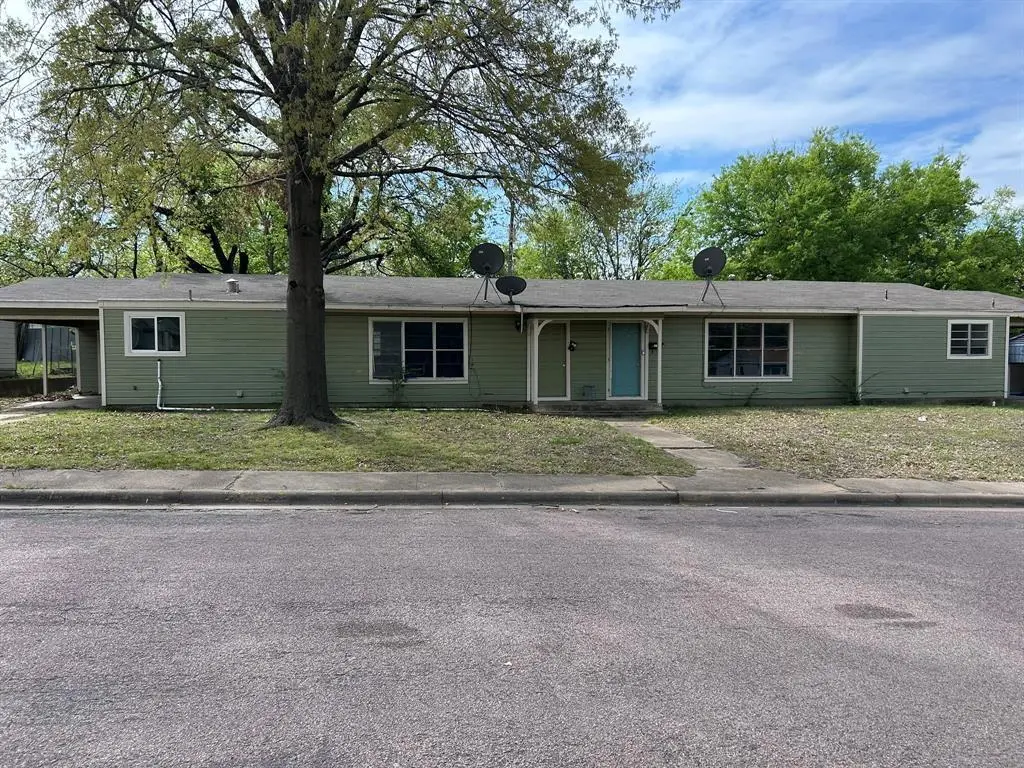
119 Vandenburg Dr · Denison, TX
Flood risk 1/10 · Minimal
- FEMA flood zone
- X (unshaded)
- Chance of flooding over 30 yrs
- 0.0%
- Est. flood insurance / yr
- $507 – $1,088
Fire risk 7/10 · Major
- Est. fire insurance / yr
- $1,222 – $2,270
Heat risk 6/10 · Moderate
- Hot days now (above 107°F)
- 7 days/yr
- Hot days in 30 yrs
- 20 days/yr
Wind risk 4/10 · Minor
- Chance of severe wind over 30 yrs
- 19.0%
Air-quality risk 3/10 · Minor
- Unhealthy air days now
- 2 days/yr
- Unhealthy air days in 30 yrs
- 3 days/yr
Risk factors via First Street. Map © Google.
Why this score? — see what drove the C- grade
The composite is a weighted blend of 9 inputs, each scored 0–100. Each bar is that input's sub-score; the figure is the points it added to the 100-point composite (weight × sub-score).
- ARV discount +15.0/15.0
- Cash flow +14.8/30.0
- 1% rule +5.2/10.0
- DSCR +4.5/10.0
- Livability +3.7/5.0
- Schools +2.9/10.0
- Rent growth +2.5/5.0
- Condition / age +2.5/5.0
- Appreciation +0.0/10.0
$159,000
🖨 Deal sheet 📄 Offer letter ✓ Due diligence
Listing remarks MLS
Income-producing duplex offering a solid investment opportunity! This property features two well-maintained units, each with 2 bedrooms and 1 bathroom. Both sides include an attached carport along with a combination of hardwood flooring and luxury vinyl plank, providing durability and modern appeal. The property also features fenced backyard, adding to overall functionality and tenant appeal. With a practical layout and desirable features, this duplex is well-suited for consistent rental income and long-term investment potential. More properties available as part of a portfolio. Contact the listing agent for more information.
Key facts
- Hardwood flooring
- Attached carport
- Luxury vinyl plank
Tags
Neighborhood map
What this means for you Summary
Snapshot
- This is a 4-bed/2.0-bath other listed at $159k.
Deal economics
- At list price, monthly cash flow is $44 ($526/yr) — positive.
- The deal already cash-flows at list — no discount required.
- Meets the 1% rule at list price ($2k rent vs $159k).
- Recommended offer: $149k (6.0% below list) — sets the bar for market timing.
- Cap rate 6.6% vs local median 3.8% in Denison — top-decile yield for the area; either an underpriced asset or a hidden risk that comps aren't pricing in. Stress-test before assuming the spread holds.
Location & tenants
- Location reads 73/100 on livability (#221 in TX) — a middle-class / working-renter tenant base. Strengths: cost of living A+, housing A+, crime A; Watch: health & safety D+, schools D-, amenities F.
- Sherman ISD (urban): math 31% / reading 37% proficiency, ranked #546 of 826 in TX (top 66%) — families likely to look elsewhere, expect single-tenant / working-renter base with shorter leases.
- Market conditions: Rents flat; 485 active listings in the ZIP; 2 comparable units currently listed for rent nearby; 2,272 units permitted in Grayson County in 2024 (750 in 5+ unit buildings).
Forward outlook
- Local home prices are declining (-3.0%/yr); year-one equity from $1k of loan paydown is wiped out by about $5k of value loss. Plan a longer hold.
- Grayson County population projected at +12% by 2050 — modest demand growth; plan on rents tracking national, not racing it.
Negotiation context
- It's been on market 65 days — a 6% lower offer ($149k) is reasonable based on typical stale-listing flexibility.
- 3 sale attempts since 16y ago; this cycle's ask has dropped $30k (16%) from the opening price — seller is motivated, your offer sets the floor, not the list.
Risks & watch-outs
- Watch-outs: property tax is 2.6% of price; built in 1945 — expect roof / HVAC / electrical / plumbing capex.
- Climate carrying-cost: major wildfire risk; extreme-heat days projected 7→20/yr by 2055 (HVAC capex compounding) — expect insurance premiums to compound above CPI over the hold.
Questions for the listing agent
- It's been on market 65 days. Have you received any prior offers? Is the seller open to a 6% concession, seller financing, or rate buy-down credit?
- Built in 1945 — when were the roof, HVAC, electrical panel, plumbing, and water heater last replaced?
- Property tax is high relative to price — has the assessment been appealed recently, and will the sale trigger a re-assessment?
- Why hasn't it sold? Are there any deal-killer items the seller is aware of (foundation, flood, title, zoning, code violations)?
- Is there a deadline driving the sale (1031 exchange, divorce, estate, relocation)? That informs how much negotiation room exists.
- Schools are D-rated, which usually means shorter tenancies and higher turnover. Who's the typical renter profile here, and what's been the actual vacancy rate?
- What's the average days-on-market for RENTAL listings here right now (not sales)? A rising rental-DOM trend means longer vacancies and softer asking-rent achievability than the comps imply.
- What's the recent tenant-quality profile in this submarket — average credit score on applications, eviction rate, late-payment / NSF rate, and stable-employment percentage? A property-management company in the area should have these aggregated.
- How much new for-sale + rental construction is in the pipeline within 1–3 miles? Heavy new supply typically softens prices + rents 12–24 months out; constrained supply supports both.
Investment metrics
- 1% rule
- 1.02% ✓
- Cap rate
- 6.62%
- Cash-on-cash
- 1.18%
- DSCR
- 1.05
- GRM
- 8.1
CMA / ARV
- ARV (median comp)
- $191,463
- List price
- $159,000
- Delta
- -16.96%
- Verdict
- UNDERPRICED
- Comps
- 13 within 1.0 mi
Projected returns pro-forma
-3.0% appreciation · 0.05% rent growth · sell at horizon
- IRR
- -18.1%
- Equity multiple
- 0.38×
- Total profit
- $-27,551
- Equity at exit
- $23,707
- IRR
- -18.7%
- Equity multiple
- 0.14×
- Total profit
- $-38,086
- Equity at exit
- $13,747
Cash invested: $44,520 (down + closing). Projections, not guarantees.
Landlord ↔ Tenant lean methodology
- Overall (STATE)
- 87 Strongly Landlord-Friendly
- State Texas
- 87 Strongly Landlord-Friendly · R+5
- County
- — inherits STATE
- City
- — inherits STATE
ZIP-level market 75020
- Rents YoY
- 0.1%
- Active inventory
- 485
- Price-to-rent
- 8.1×
Monthly cashflow live
- Estimated rent
- $1,627 medium interval (Pro) →
- Mortgage (P&I)
- −$834
- Tax from tax record
- −$341 /mo · $4,098/yr
- Insurance
- −$66
- HOA
- −$0
- Vacancy / Maint / Mgmt
- −$342
- Net cashflow
- $44
Break-even live
UW: 25.0% down · 7.5% · 30yr · 1.5% tax · 5.0% vac · 8.0% maint · 8.0% mgmt
Financing live
Cash to close
- Down payment
- $39,750
- Closing costs
- $4,770
- Reserves months
- —
- Total cash needed
- —
Loan-product check · same deal, 3 products live
Conventional
25% down · 7.5% · 30yr
- Down + closing
- —
- Monthly P&I
- —
- Monthly cashflow
- —
- DSCR
- —
- Eligible?
- —
Personal DTI + credit; lowest rate.
DSCR
20% down · 8.5% · 30yr
- Down + closing
- —
- Monthly P&I
- —
- Monthly cashflow
- —
- DSCR
- —
- Eligible?
- —
No personal income docs; deal must DSCR.
Hard money
10% down · 12.0% · 12mo
- Down + closing
- —
- Monthly P&I
- —
- Monthly cashflow
- —
- DSCR
- —
- Eligible?
- —
Short-term bridge; refi at stabilization.
Rent comps 2 comps
| Address | Beds | Baths | Sqft | Rent | $/sqft | DOM | Units | Dist |
|---|---|---|---|---|---|---|---|---|
| 62 Pershing Dr Unit 1 Denison, TX | 3.0 | 2.0 | 1650 | $950 | $0.58 | 21d | 1 | 0.25mi |
| 7 Pershing Dr Unit A Denison, TX | 3.0 | 1.0 | 2256 | $1,050 | $0.47 | 21d | 1 | 0.30mi |
Listing history 25 events
-
2026-06-19days on market $159,000 Active 65 DOM
-
2026-06-18days on market $159,000 Active 64 DOM
-
2026-06-17days on market $159,000 Active 63 DOM
-
2026-06-16days on market $159,000 Active 62 DOM
-
2026-06-15days on market $159,000 Active 61 DOM
-
2026-06-14days on market $159,000 Active 59 DOM
-
2026-06-13days on market $159,000 Active 58 DOM
-
2026-06-10days on market $159,000 Active 56 DOM
-
2026-06-09days on market $159,000 Active 55 DOM
-
2026-06-08days on market $159,000 Active 54 DOM
-
2026-06-07days on market $159,000 Active 53 DOM
-
2026-06-03days on market $159,000 Active 49 DOM
-
2026-06-02days on market $159,000 Active 48 DOM
-
2026-06-01days on market $159,000 Active 47 DOM
-
2026-05-31days on market $159,000 Active 46 DOM
-
2026-05-30days on market $159,000 Active 45 DOM
-
2026-04-15$189,000 Active 635-char remark
Show marketing remark (635 chars)
Income-producing duplex offering a solid investment opportunity! This property features two well-maintained units, each with 2 bedrooms and 1 bathroom. Both sides include an attached carport along with a combination of hardwood flooring and luxury vinyl plank, providing durability and modern appeal. The property also features fenced backyard, adding to overall functionality and tenant appeal. With a practical layout and desirable features, this duplex is well-suited for consistent rental income and long-term investment potential. More properties available as part of a portfolio. Contact the listing agent for more information.
-
2025-10-31historical
-
2025-01-10price $246,500
-
2024-09-09$249,500 Active
-
2010-08-23soldstatus
-
2010-08-10historical
-
2010-07-22$19,900
-
2006-12-27soldstatus
-
2003-07-21soldstatus
ⓘ Source: listings_history table (triggers on properties + properties_extension) + one-shot
backfill from property_details.listing_events for pre-trigger history.
Tax reassessment forecast TX · Resets to sale price
- Current annual tax
- $4,098 · $341/mo
- Projected year-2 tax
- $4,098 · $341/mo
- Expected delta
- $0/yr ($0/mo · 0.0%)
ⓘ Screening estimate from a state-policy table — verify with the county assessor before closing.
Climate risk First Street
- Flood 1/10 Low FEMA zone X (unshaded) · 0% chance over 30 yrs
- Wildfire 7/10 Severe
- Heat 6/10 Major 7 d/yr ≥107°F today · 20 d/yr by 30 yrs out
- Wind 4/10 Moderate 19% chance of damaging wind over 30 yrs
- Air quality 3/10 Moderate 2 unhealthy d/yr today · 3 by 30 yrs out
Nearby sold comps map
Loading sold comps map…
Walkable amenities ~0.75 mi
Loading nearby amenities…
Taxation est. · year 1
- Rental income
- $19,525
- − Mortgage interest
- −$8,906
- − Property taxes
- −$4,098
- − Insurance
- −$795
- − Repairs & maintenance
- −$1,562
- − Management
- −$1,562
- − Depreciation
- −$4,625
- Taxable loss
- −$2,024
- Est. tax savings @ 24.0%
- +$486
- After-tax cash flow
- $1,012/yr
For passive investors: Depreciation is non-cash, so a rental often shows a tax loss while cash-flowing — sheltering income. Rental losses are passive: they offset passive income freely, and up to $25,000/yr can offset ordinary (W-2) income if you actively participate and your MAGI is under $100k (phasing out to $0 by $150k); unused losses carry forward. On sale, claimed depreciation is recaptured at up to 25%, and gains may owe capital-gains tax (a 1031 exchange can defer both). Figures are a year-1 estimate at your 24.0% rate — not tax advice; consult a CPA.
Schools (NCES district)
- District
- Sherman ISD
- NCES district ID
- 4840080
- Math proficiency
- 31% ▼ -9.00%
- Reading proficiency
- 37% ▼ -2.00%
- Median HH income
- $42,587
- Composite
- 28.79/100
- National rank
- #6665
- State rank
- #546 of 826 in TX
Livability — Denison
- Score
- 73/100
- State rank
- #221
- US rank
- #5428
Category grades
Schools grade is shown separately in the Schools card above.
Census & demographics
- Census place
- Denison, TX
- County
- Grayson County · 108,053 people
- City population
- 34,008
- Metro
- Sherman-Denison, TX
- Population (ZIP)
- 24,835
- Household income
- $71,605
- Rent vs Own
- Severe rent burden
- 997.0
Population outlook (Grayson County) Hauer SSP2
- Today (2025)
- 134,540 people
- By 2030
- 138,653 · +3.1%
- By 2040
- 145,958 · +8.5%
- By 2050
- 151,218 · +12.4%
- By 2075
- 161,802 · +20.3%
- By 2100
- 159,036 · +18.2%
Race, ethnicity, and origin ACS 2023
- Neighborhood character
- Predominantly White (73%)
- Race & ethnicity
- White 73% Hispanic / Latino 13% Two or more races 9% Black 6%
- Hispanic origin (detail)
- Mexican 11%
- Common ancestry
- Slovak 5% Serbian 2% Portuguese 2%
- Foreign-born
- 4% · Canada
- Languages at home
- 93% English-only · Spanish 6%
Political lean MEDSL · Grayson
- 2024 margin
- Solid R (+54.3) · D 22.5% · R 76.7%
- 2008→2024 swing
- -16.4pp toward R · 2008: -37.9pp · 2024: -54.3pp
- All cycles
- 2024: R+54.3 2020: R+49.9 2016: R+53.1 2012: R+48.0 2008: R+37.9
Not yet ingested
- Civics
- —
Market trends
- HPI YoY
- ▼ -295.96%
- Current HPI
- 257.1806
- Rent YoY
- ▬ 0.05%
- Metro
- Sherman-Denison, TX
- State GDP YoY
- ▲ 3.95%
- F500 in state
- 110
Industry mix (Fortune 500 HQ in TX)
| Industry | F500 HQs | Revenue |
|---|---|---|
| Energy | 16 | $1,198B |
|
||
| Technology | 5 | $198B |
|
||
| Engineering / Construction | 4 | $72B |
|
||
| Energy Services | 3 | $60B |
|
||
| Utilities | 3 | $41B |
|
||
| Healthcare | 2 | $330B |
|
||
Price history
+849.7% since first listed9 events — show timeline
- 2026-04-15 Listed $189,000 NTREIS
- 2025-10-31 Listing Removed — NTREIS
- 2025-01-10 Price Changed $246,500 NTREIS
- 2024-09-09 Listed $249,500 NTREIS
- 2010-08-23 Sold (MLS) — NTREIS
- 2010-08-10 Listing Removed — NTREIS
- 2010-07-22 Listed $19,900 NTREIS
- 2006-12-27 Sold (Public Records) — Public Records
- 2003-07-21 Sold (Public Records) — Public Records
Property tax history
+5.5%/yrLatest (2025): $4,098 · -4.1% YoY. Source: county tax records.
Cash-flow waterfall
monthlySold comps — $/sqft
last 12 mo · ≤1 miLoading sold comps…