 Triplex
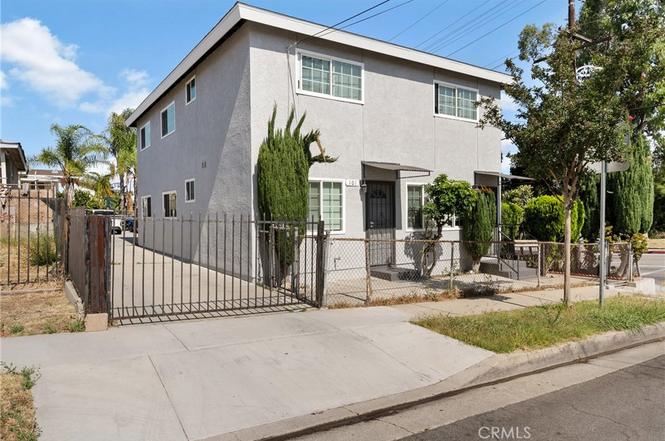
101 S Marianna Ave · East Los Angeles, CA
Flood risk 1/10 · Minimal
- FEMA flood zone
- X (unshaded)
- Chance of flooding over 30 yrs
- 0.0%
- Est. flood insurance / yr
- $507 – $1,088
Fire risk 1/10 · Minimal
- Est. fire insurance / yr
- $659 – $1,223
Heat risk 6/10 · Moderate
- Hot days now (above 95°F)
- 7 days/yr
- Hot days in 30 yrs
- 21 days/yr
Wind risk 1/10 · Minimal
- Chance of severe wind over 30 yrs
- —
Air-quality risk 5/10 · Moderate
- Unhealthy air days now
- 9 days/yr
- Unhealthy air days in 30 yrs
- 9 days/yr
Risk factors via First Street. Map © Google.
Why this score? — see what drove the C grade
The composite is a weighted blend of 9 inputs, each scored 0–100. Each bar is that input's sub-score; the figure is the points it added to the 100-point composite (weight × sub-score).
- Cash flow +20.5/30.0
- ARV discount +13.1/15.0
- DSCR +6.5/10.0
- 1% rule +4.2/10.0
- Schools +3.6/10.0
- Livability +3.0/5.0
- Condition / age +2.5/5.0
- Rent growth +1.7/5.0
- Appreciation +0.0/10.0
$800,000
🖨 Deal sheet (PDF) 📄 Offer letter ✓ Due diligence
Multi-family units
County records classify this as Multi-Family (2-4 Unit). Listing-text estimate: 3 units. confirmed
Listing remarks
101 S Marianna Ave presents a well-located triplex in unincorporated East Los Angeles. The property features an attractive and functional unit mix consisting of (1) 2-bedroom, 1.5-bath townhome-style unit and (2) 2-bedroom, 1-bath units. The property offers strong tenant appeal with in-unit washer and dryer in all units, designated parking, and ample on-site parking, including a covered carport for 5 cars plus additional uncovered parking for up to 3 cars. The landlord pays for water, while tenants pay all other utilities. Recent improvements include a new roof and fascia (2021), newer windows, fresh exterior paint, remodeled bathrooms, copper plumbing in the bathrooms of Units 103 and 105,
Key facts
- Covered carport
- Newer windows
- Designated parking
Tags
Property features AI
Finance
- Financial info: Property contains 3 total units (all leased); Gross scheduled income reported as $60,600; Gross operating income reported as $58,782; Net operating income reported as $42,784; Total operating expenses reported as $15,998 (includes insurance, water/sewer, trash, pest control); Vacancy allowance rate reported as 3%; Individual unit rents reported: $1,300, $1,750, and $2,000
- HOA & community: Rent control applies; Community features include sidewalks
Exterior
- Parking: Assigned parking; Total of 8 parking spaces; 5 carport spaces; 3 uncovered spaces
- Utilities: Public sewer; District/public water; Three separate gas meters; Three separate electric meters; One separate water meter
- Home design: Community apartment (multi-unit); Single building with 2 stories; No common walls between units; No ADU reported
- Construction: Year built reported from public records
- Exterior features: No pool; Paved lot
Interior
- Kitchen: No specific kitchen appliance details provided
- Bedrooms: Three 2-bedroom units (each unit reported as 2 beds)
- Bathrooms: Two units with 1 full bath; One unit with 1 full bath and 1 half bath
- Interior features: Ground-level entry
- Laundry & utility: Laundry inside
Neighborhood map
What this means for you Summary
Snapshot
- This is a 3 × 2-bed/1.2-bath units multifamily listed at $800k.
Deal economics
- At list price, monthly cash flow is $1k ($13k/yr) — positive. Per door: $351/mo.
- The deal already cash-flows at list — no discount required.
- To meet the 1% rule (rent ≥ 1% of price), the offer needs to be $740k (7.5% below list).
- Recommended offer: $740k (7.5% below list) — sets the bar for 1% rule.
- Cap rate 7.9% vs local median 3.5% in East Los Angeles — top-decile yield for the area; either an underpriced asset or a hidden risk that comps aren't pricing in. Stress-test before assuming the spread holds.
Location & tenants
- Location reads 60/100 on livability (#594 in CA) — a middle-class / working-renter tenant base. Strengths: commute A+; Watch: employment C-, health & safety D, crime F.
- Los Angeles Unified (urban): math 29% / reading 54% proficiency, ranked #223 of 517 in CA (top 43%) — families likely to look elsewhere, expect single-tenant / working-renter base with shorter leases; 67% free/reduced lunch — lower-income household profile, screen leases tightly.
- Zoned schools: Marianna Avenue Elementary (295 students, 96% FRL); Belvedere Middle (727 students, 97% FRL); James A. Garfield Senior High (math 32% / reading 59%, grade D-, #417 of 1,170 statewide, top 36%, 2,247 students, 96% FRL) — zoned schools average 96% FRL vs 67% district-wide (29 pts higher); higher-poverty schools than district average — tighter screening recommended.
- Market conditions: Rents falling (-3.3%/yr); 84 active listings in the ZIP; 3 comparable units currently listed for rent nearby; rentals at typical pace (median 21d on market — plan ~3-4 weeks tenant-placement turnaround); 19,697 units permitted in Los Angeles County in 2024 (9,426 in 5+ unit buildings).
- At $7,398/mo this rent would consume 122% of the median local household income ($73k/yr) (locally 1857% of renters already pay >50% of income on rent) — very limited rent-growth headroom before tenants either downsize or default.
Forward outlook
- Local home prices are declining (-3.0%/yr); year-one equity from $6k of loan paydown is wiped out by about $24k of value loss. Plan a longer hold.
- Los Angeles County population projected at +9% by 2050 — modest demand growth; plan on rents tracking national, not racing it.
Negotiation context
- Only 1 days on market — expect competitive offers; lowballing is unlikely to land.
- 2 sale attempts since 26y ago; this cycle's ask is 196% above the opening price — seller raised mid-cycle; expect resistance to lowballs.
Risks & watch-outs
- Climate carrying-cost: extreme-heat days projected 7→21/yr by 2055 (HVAC capex compounding) — expect insurance premiums to compound above CPI over the hold.
Questions for the listing agent
- Can we see the unit-by-unit rent roll, current vacancy, and any below-market leases? What's the average tenancy length?
- What capital expenditures (roof, boiler, parking lot, exteriors) have been made in the last 5 years, and what's planned in the next 2?
- Built in 1967 — when were the roof, HVAC, electrical panel, plumbing, and water heater last replaced?
- Is there a deadline driving the sale (1031 exchange, divorce, estate, relocation)? That informs how much negotiation room exists.
- Schools are B-rated — typically a magnet for longer-tenancy family renters. What's the average tenant stay here, and is there a school-zone premium baked into asking?
- Crime grade is F in this area — have there been break-ins, vandalism, or insurance claims at this property in the last 3 years? What carrier currently insures it and at what premium?
- What's the average days-on-market for RENTAL listings here right now (not sales)? A rising rental-DOM trend means longer vacancies and softer asking-rent achievability than the comps imply.
- What's the recent tenant-quality profile in this submarket — average credit score on applications, eviction rate, late-payment / NSF rate, and stable-employment percentage? A property-management company in the area should have these aggregated.
- How much new apartment / multifamily construction is in the pipeline within 1–3 miles? Heavy new supply (>2% of stock underway) typically softens rents 12–24 months out; light construction supports rent growth.
Investment metrics
- 1% rule
- 0.92% ✗
- Cap rate
- 7.87%
- Cash-on-cash
- 5.64%
- DSCR
- 1.25
- GRM
- 9.0
CMA / ARV
- ARV (on-the-fly)
- $912,576
- Comps found
- 11
Show comp detail 11 sales within ~0.75 mi
| Address | Dist | Beds/Ba | Sqft | Sold | Price | $/sf | Match |
|---|---|---|---|---|---|---|---|
| 221 S Rowan Ave | 0.68mi | 6/4.0 | 2,337 (-1%) | 10mo | $720,000 | $308 | 59 |
| 421 N Brannick Ave | 0.33mi | 7/4.0 (+1) | 2,232 (-5%) | 15mo | $990,000 | $444 | 58 |
| 127-129 S Townsend | 0.72mi | 7/3.5 (+1) | 2,382 (+1%) | 4mo | $925,000 | $388 | 54 |
| 4537 E 2nd St | 0.49mi | 6/3.0 | 2,436 (+4%) | 19mo | $730,000 | $300 | 52 |
| 4307 Dozier St | 0.37mi | 5/3.0 (-1) | 2,152 (-8%) | 14mo | $852,000 | $396 | 48 |
| 146 S Sunol Dr | 0.19mi | 5/3.0 (-1) | 2,123 (-10%) | 22mo | $923,000 | $435 | 48 |
| 4616 Hammel | 0.65mi | 7/5.0 (+1) | 2,116 (-10%) | 1mo | $725,000 | $343 | 43 |
| 145 S Herbert Ave | 0.43mi | 5/5.0 (-1) | 2,604 (+11%) | 13mo | $948,000 | $364 | 43 |
| 410 S Ford Blvd | 0.55mi | 5/2.5 (-1) | 2,152 (-8%) | 9mo | $890,000 | $414 | 42 |
| 4344 Michigan Ave | 0.25mi | 5/2.0 (-1) | 2,037 (-13%) | 22mo | $726,000 | $356 | 34 |
| 601 S Humphreys | 0.68mi | 5/2.0 (-1) | 2,020 (-14%) | 5mo | $925,000 | $458 | 28 |
Match score weights: distance 35% · size 25% · config 20% · recency 20%. Top-matched comps best support the ARV.
Projected returns pro-forma
-3.0% appreciation · 0.0% rent growth · sell at horizon
- IRR
- -10.7%
- Equity multiple
- 0.62×
- Total profit
- $-84,553
- Equity at exit
- $119,283
- IRR
- -5.7%
- Equity multiple
- 0.68×
- Total profit
- $-72,395
- Equity at exit
- $69,169
Cash invested: $224,000 (down + closing). Projections, not guarantees.
Landlord ↔ Tenant lean methodology
- Overall (STATE)
- 18 Strongly Tenant-Friendly
- State California
- 18 Strongly Tenant-Friendly · D+13
- County
- — inherits STATE
- City
- — inherits STATE
ZIP-level market 90063
- Rents YoY
- -3.3%
- Active inventory
- 84
- Price-to-rent
- 27.0×
Monthly cashflow live
- Estimated rent
- $7,398 high interval (Pro) →
- Mortgage (P&I)
- −$4,195
- Tax from tax record
- −$262 /mo · $3,146/yr
- Insurance
- −$333
- HOA
- −$0
- Vacancy / Maint / Mgmt
- −$1,554
- Net cashflow
- $1,054
Break-even live
Sensitivity live
| Price | -10% $1,506 | -5% $1,280 | +0% $1,054 | +5% $827 | +10% $601 |
|---|---|---|---|---|---|
| Rent | -10% $469 | -5% $761 | +0% $1,054 | +5% $1,346 | +10% $1,638 |
| Rate | -1.0pp $1,456 | -0.5pp $1,257 | base $1,054 | +0.5pp $846 | +1.0pp $635 |
3-unit breakdown (identical units grouped — click to expand)
| Units | Beds | Baths | Est. rent |
|---|---|---|---|
| 3× units | 2 | 1.2 | $7,398 |
| #1 | 2 | 1.2 | $2,466 |
| #2 | 2 | 1.2 | $2,466 |
| #3 | 2 | 1.2 | $2,466 |
| Total (3 units) | $7,398 | ||
UW: 25.0% down · 7.5% · 30yr · 1.5% tax · 5.0% vac · 8.0% maint · 8.0% mgmt
Financing live
Cash to close
- Down payment
- $200,000
- Closing costs
- $24,000
- Reserves months
- —
- Total cash needed
- —
Loan-product check · same deal, 3 products live
Conventional
25% down · 7.5% · 30yr
- Down + closing
- —
- Monthly P&I
- —
- Monthly cashflow
- —
- DSCR
- —
- Eligible?
- —
Personal DTI + credit; lowest rate.
DSCR
20% down · 8.5% · 30yr
- Down + closing
- —
- Monthly P&I
- —
- Monthly cashflow
- —
- DSCR
- —
- Eligible?
- —
No personal income docs; deal must DSCR.
Hard money
10% down · 12.0% · 12mo
- Down + closing
- —
- Monthly P&I
- —
- Monthly cashflow
- —
- DSCR
- —
- Eligible?
- —
Short-term bridge; refi at stabilization.
Rent comps 3 comps
| Address | Beds | Baths | Sqft | Rent | $/sqft | DOM | Units | Dist |
|---|---|---|---|---|---|---|---|---|
| 3223 Lanfranco St Los Angeles, CA | 5.0 | 4.5 | 1986 | $4,800 | $2.42 | 20d | 1 | 1.45mi |
| 3223 Lanfranco St Los Angeles, CA | 5.0 | 4.5 | 1986 | $4,900 | $2.47 | 45d | 1 | 1.45mi |
| 2843 Folsom St Unit 2845E Los Angeles, CA | 5.0 | 5.0 | 1825 | $4,495 | $2.46 | 17d | 1 | 1.47mi |
Listing history 2 events
-
2026-06-22remarks 699-char remark
-
2026-06-22$800,000 Coming Soon 1 DOM
ⓘ Source: listings_history table (triggers on properties + properties_extension) + one-shot
backfill from property_details.listing_events for pre-trigger history.
Tax reassessment forecast CA · Resets to sale price
- Current annual tax
- $3,146 · $262/mo
- Projected year-2 tax
- $6,080 · $507/mo
- Expected delta
- +$2,934/yr (+$244/mo · 93.2%)
ⓘ Screening estimate from a state-policy table — verify with the county assessor before closing.
Climate risk First Street
- Flood 1/10 Low FEMA zone X (unshaded) · 0% chance over 30 yrs
- Wildfire 1/10 Low
- Heat 6/10 Major 7 d/yr ≥95°F today · 21 d/yr by 30 yrs out
- Wind 1/10 Low
- Air quality 5/10 Major 9 unhealthy d/yr today · 9 by 30 yrs out
Nearby sold comps map
Loading sold comps map…
Walkable amenities ~0.75 mi
Loading nearby amenities…
Taxation est. · year 1
- Rental income
- $88,776
- − Mortgage interest
- −$44,812
- − Property taxes
- −$3,146
- − Insurance
- −$4,000
- − Repairs & maintenance
- −$7,102
- − Management
- −$7,102
- − Depreciation
- −$23,273
- Taxable loss
- −$660
- Est. tax savings @ 24.0%
- +$158
- After-tax cash flow
- $12,801/yr
For passive investors: Depreciation is non-cash, so a rental often shows a tax loss while cash-flowing — sheltering income. Rental losses are passive: they offset passive income freely, and up to $25,000/yr can offset ordinary (W-2) income if you actively participate and your MAGI is under $100k (phasing out to $0 by $150k); unused losses carry forward. On sale, claimed depreciation is recaptured at up to 25%, and gains may owe capital-gains tax (a 1031 exchange can defer both). Figures are a year-1 estimate at your 24.0% rate — not tax advice; consult a CPA.
Schools (NCES district)
- District
- Los Angeles Unified
- NCES district ID
- 0622710
- Math proficiency
- 29% ▼ -4.00%
- Reading proficiency
- 54% ▲ 10.00%
- Median HH income
- $50,403
- Composite
- 35.67/100
- National rank
- #4875
- State rank
- #223 of 517 in CA
Livability — East Los Angeles
- Score
- 60/100
- State rank
- #594
- US rank
- #19237
Category grades
Schools grade is shown separately in the Schools card above.
Census & demographics
- Census place
- East Los Angeles, CA
- County
- Los Angeles County · 9,444,647 people
- City population
- 108,740
- Metro
- Los Angeles-Long Beach-Anaheim, CA
- Population (ZIP)
- 48,397
- Household income
- $72,942
- Rent vs Own
- Severe rent burden
- 1857.0
Population outlook (Los Angeles County) Hauer SSP2
- Today (2025)
- 10,940,515 people
- By 2030
- 11,256,481 · +2.9%
- By 2040
- 11,729,929 · +7.2%
- By 2050
- 11,948,407 · +9.2%
- By 2075
- 11,818,114 · +8.0%
- By 2100
- 10,842,928 · -0.9%
Race, ethnicity, and origin ACS 2023
- Neighborhood character
- Predominantly Hispanic (94%)
- Race & ethnicity
- Hispanic / Latino 94% Two or more races 13% White 3% Native American 2% Asian 2%
- Hispanic origin (detail)
- Mexican 84%
- Foreign-born
- 40% · Canada, China
- Languages at home
- 17% English-only · Spanish 81%
Political lean MEDSL · Los Angeles
- 2024 margin
- Solid D (+32.9) · D 64.8% · R 31.9% · Other 3.3%
- 2008→2024 swing
- -7.4pp toward R · 2008: 40.4pp · 2024: 32.9pp
- All cycles
- 2024: D+32.9 2020: D+44.2 2016: D+48.0 2012: D+40.0 2008: D+40.4
Not yet ingested
- Civics
- —
Market trends
- HPI YoY
- ▼ -841.41%
- Current HPI
- 476.1519
- Rent YoY
- ▼ -3.30%
- Metro
- Los Angeles-Long Beach-Anaheim, CA
- State GDP YoY
- ▲ 3.21%
- F500 in state
- 116
Industry mix (Fortune 500 HQ in CA)
| Industry | F500 HQs | Revenue |
|---|---|---|
| Technology | 27 | $1,492B |
|
||
| Financial Services | 3 | $174B |
|
||
| Retail | 3 | $44B |
|
||
| Insurance | 3 | $26B |
|
||
| Media / Entertainment | 2 | $115B |
|
||
| Pharmaceuticals / Biotech | 2 | $62B |
|
||
Price history
+150.0% since first listed5 events — show timeline
- 2026-06-21 Coming Soon $800,000 CRMLS
- 2001-08-15 Listing Removed — CRMLS
- 2001-05-15 Listed $270,000 CRMLS
- 2000-09-28 Listing Removed — CRMLS
- 2000-07-24 Listed $320,000 CRMLS
Property tax history
+2.6%/yrLatest (2025): $3,146 · +7.9% YoY. Source: county tax records.
Cash-flow waterfall
monthlySold comps — $/sqft
last 12 mo · ≤1 miLoading sold comps…