15720 Plum Brook Dr · Cut and Shoot, TX
Flood risk No data
- FEMA flood zone
- —
- Chance of flooding over 30 yrs
- —
- Est. flood insurance / yr
- —
Fire risk No data
- Est. fire insurance / yr
- —
Heat risk No data
- Hot days now (above threshold)
- —
- Hot days in 30 yrs
- —
Wind risk No data
- Chance of severe wind over 30 yrs
- —
Air-quality risk No data
- Unhealthy air days now
- —
- Unhealthy air days in 30 yrs
- —
Risk factors via First Street. Map © Google.
Why this score? — see what drove the C- grade
The composite is a weighted blend of 9 inputs, each scored 0–100. Each bar is that input's sub-score; the figure is the points it added to the 100-point composite (weight × sub-score).
- ARV discount +15.0/15.0
- Cash flow +14.5/30.0
- Schools +5.1/10.0
- DSCR +4.4/10.0
- 1% rule +4.0/10.0
- Condition / age +4.0/5.0
- Livability +2.8/5.0
- Rent growth +2.4/5.0
- Appreciation +0.0/10.0
$228,940
🖨 Deal sheet (PDF) 📄 Offer letter ✓ Due diligence
Listing remarks
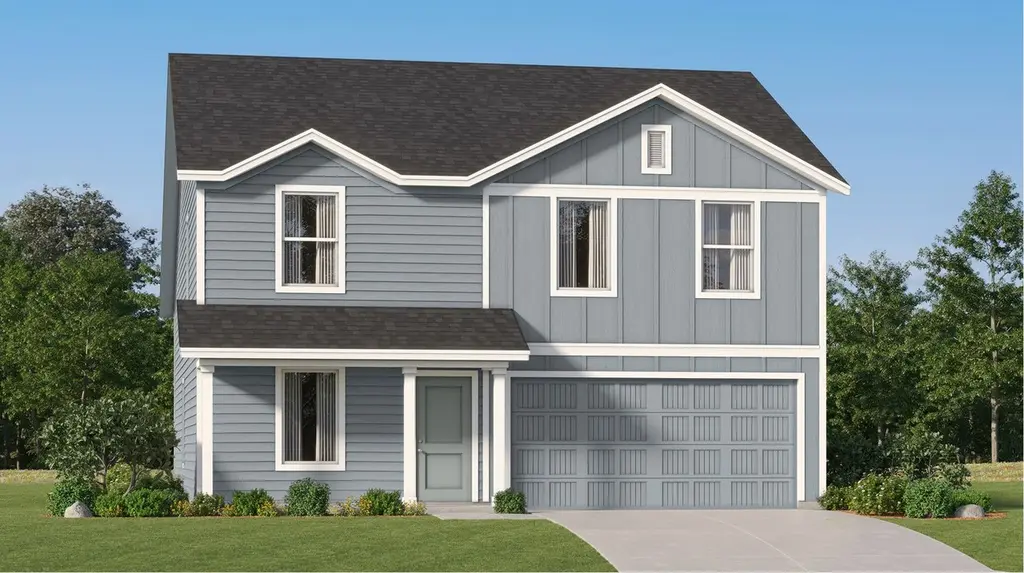
NEW! Lennar Core Watermill Collection "Littleton" Plan with Siding Elevation "C" in Sweetwater Ridge! On the first floor of this spacious two-story home is a convenient and modern layout seamlessly connecting the kitchen, dining room and family room together. In a private corner is the tranquil owner’s suite with an attached bathroom and walk-in closet. Upstairs is a sprawling central game room made for gatherings of all sizes, along with three secondary bedrooms to provide sleeping accommodations to family members and guests.
Key facts
- Central game room
- Attached bathroom
- Walk-in closet
Tags
Neighborhood map
What this means for you Summary
Snapshot
- This is a 4-bed/2.5-bath single-family listed at $229k. Condition is rated good.
Deal economics
- At list price, monthly cash flow is $50 ($603/yr) — positive.
- The deal already cash-flows at list — no discount required.
- To meet the 1% rule (rent ≥ 1% of price), the offer needs to be $207k (9.7% below list).
- Recommended offer: $207k (9.7% below list) — sets the bar for 1% rule.
- Cap rate 6.6% vs local median 4.9% in Cut and Shoot — top-decile yield for the area; either an underpriced asset or a hidden risk that comps aren't pricing in. Stress-test before assuming the spread holds.
Location & tenants
- Location reads 56/100 on livability (#1,326 in TX) — a working-class tenant base; expect higher turnover. Strengths: cost of living A+, housing A+; Watch: crime D-, amenities F, commute F.
- Conroe ISD (other): math 57% / reading 57% proficiency, ranked #69 of 826 in TX (top 8%) — acceptable for families but not a draw, mixed tenant base, ~2y average lease.
- Zoned schools: Austin El (math 39% / reading 29%, grade F, #2,149 of 4,322 statewide, top 50%, 950 students, 81% FRL); Moorhead J H (math 35% / reading 42%, grade F, #704 of 1,662 statewide, top 43%, 1,391 students, 82% FRL); Caney Creek H S (math 33% / reading 42%, grade F, #888 of 1,632 statewide, top 55%, 2,504 students, 79% FRL) — zoned schools average 81% FRL vs 34% district-wide (46 pts higher); higher-poverty schools than district average — tighter screening recommended.
- Zoned-school proficiency averages 37% at this address vs 57% district-wide (-20 pts) — the specific schools serving this property underperform the Conroe ISD average; the district grade overstates school quality for this exact location.
- Market conditions: Rents soft (-0.3%/yr); 721 active listings in the ZIP; 6 comparable units currently listed for rent nearby; rentals leasing fast (median 0d on market — plan ~1-2 weeks tenant-placement turnaround); solid renter incomes; 13,259 units permitted in Montgomery County in 2024 (1,402 in 5+ unit buildings).
- This rent runs 33% of the median local income ($75k/yr) — at the standard rent-burdened threshold; future hikes will face affordability resistance.
Forward outlook
- Local home prices are declining (-3.0%/yr); year-one equity from $2k of loan paydown is wiped out by about $7k of value loss. Plan a longer hold.
- Montgomery County population projected at +65% by 2050 — long-run rental-demand tailwind backs the buy-and-hold thesis.
Negotiation context
- It's been on market 27 days — a 2% lower offer ($226k) is reasonable based on typical stale-listing flexibility.
Questions for the listing agent
- Is there a deadline driving the sale (1031 exchange, divorce, estate, relocation)? That informs how much negotiation room exists.
- Schools are F-rated, which usually means shorter tenancies and higher turnover. Who's the typical renter profile here, and what's been the actual vacancy rate?
- Crime grade is D in this area — have there been break-ins, vandalism, or insurance claims at this property in the last 3 years? What carrier currently insures it and at what premium?
- What's the average days-on-market for RENTAL listings here right now (not sales)? A rising rental-DOM trend means longer vacancies and softer asking-rent achievability than the comps imply.
- What's the recent tenant-quality profile in this submarket — average credit score on applications, eviction rate, late-payment / NSF rate, and stable-employment percentage? A property-management company in the area should have these aggregated.
- How much new for-sale + rental construction is in the pipeline within 1–3 miles? Heavy new supply typically softens prices + rents 12–24 months out; constrained supply supports both.
Investment metrics
- 1% rule
- 0.90% ✗
- Cap rate
- 6.56%
- Cash-on-cash
- 0.94%
- DSCR
- 1.04
- GRM
- 9.2
CMA / ARV
- ARV (median comp)
- $278,490
- List price
- $228,940
- Delta
- -17.79%
- Verdict
- UNDERPRICED
- Comps
- 20 within 1.0 mi
Show comp detail 12 sales within ~0.75 mi
| Address | Dist | Beds/Ba | Sqft | Sold | Price | $/sf | Match |
|---|---|---|---|---|---|---|---|
| 15713 Plum Brook Dr | 0.03mi | 4/2.5 | 1,891 (0%) | 1mo | $287,990 | $152 | 98 |
| 15704 Plum Brook Dr | 0.00mi | 4/2.0 | 1,891 (0%) | 2mo | $287,990 | $152 | 97 |
| 15693 Plum Brook Dr | 0.03mi | 4/2.5 | 1,891 (0%) | 3mo | $287,990 | $152 | 96 |
| 15678 Plum Brook Dr | 0.00mi | 4/2.5 | 1,891 (0%) | 5mo | $291,990 | $154 | 96 |
| 16423 Blossom Grove Dr | 0.03mi | 4/2.0 | 1,793 (-5%) | 0mo | $289,900 | $162 | 88 |
| 15712 Plum Brook Dr | 0.00mi | 4/2.0 | 1,707 (-10%) | 1mo | $277,990 | $163 | 81 |
| 15705 Plum Brook Dr | 0.03mi | 4/2.0 | 1,707 (-10%) | 2mo | $279,990 | $164 | 79 |
| 15697 Plum Brook Dr | 0.03mi | 4/2.0 | 1,707 (-10%) | 2mo | $277,990 | $163 | 79 |
| 15689 Plum Brook Dr | 0.03mi | 4/2.0 | 1,707 (-10%) | 4mo | $283,990 | $166 | 77 |
| 15679 Plum Brook Dr | 0.03mi | 4/2.0 | 1,707 (-10%) | 5mo | $278,990 | $163 | 77 |
| 15690 Plum Brook Dr | 0.00mi | 4/2.0 | 1,667 (-12%) | 3mo | $277,990 | $167 | 76 |
| 15701 Plum Brook Dr | 0.03mi | 4/2.0 | 1,667 (-12%) | 1mo | $275,990 | $166 | 76 |
Match score weights: distance 35% · size 25% · config 20% · recency 20%. Top-matched comps best support the ARV.
Projected returns pro-forma
-3.0% appreciation · 0.0% rent growth · sell at horizon
- IRR
- -18.2%
- Equity multiple
- 0.38×
- Total profit
- $-39,923
- Equity at exit
- $34,136
- IRR
- -17.8%
- Equity multiple
- 0.16×
- Total profit
- $-53,919
- Equity at exit
- $19,795
Cash invested: $64,103 (down + closing). Projections, not guarantees.
Landlord ↔ Tenant lean methodology
- Overall (STATE)
- 87 Strongly Landlord-Friendly
- State Texas
- 87 Strongly Landlord-Friendly · R+5
- County
- — inherits STATE
- City
- — inherits STATE
ZIP-level market 77303
- Home prices YoY
- -22.4%
- Rents YoY
- -0.3%
- Active inventory
- 721
- Price-to-rent
- 9.2×
Monthly cashflow live
- Estimated rent
- $2,066 high interval (Pro) →
- Mortgage (P&I)
- −$1,201
- Tax est. 1.5%
- −$286 /mo · $3,434/yr
- Insurance
- −$95
- HOA
- −$0
- Vacancy / Maint / Mgmt
- −$434
- Net cashflow
- $50
Break-even live
Sensitivity live
| Price | -10% $208 | -5% $129 | +0% $50 | +5% $-29 | +10% $-108 |
|---|---|---|---|---|---|
| Rent | -10% $-113 | -5% $-31 | +0% $50 | +5% $132 | +10% $213 |
| Rate | -1.0pp $166 | -0.5pp $108 | base $50 | +0.5pp $-9 | +1.0pp $-69 |
UW: 25.0% down · 7.5% · 30yr · 1.5% tax · 5.0% vac · 8.0% maint · 8.0% mgmt
Financing live
Cash to close
- Down payment
- $57,235
- Closing costs
- $6,868
- Reserves months
- —
- Total cash needed
- —
Loan-product check · same deal, 3 products live
Conventional
25% down · 7.5% · 30yr
- Down + closing
- —
- Monthly P&I
- —
- Monthly cashflow
- —
- DSCR
- —
- Eligible?
- —
Personal DTI + credit; lowest rate.
DSCR
20% down · 8.5% · 30yr
- Down + closing
- —
- Monthly P&I
- —
- Monthly cashflow
- —
- DSCR
- —
- Eligible?
- —
No personal income docs; deal must DSCR.
Hard money
10% down · 12.0% · 12mo
- Down + closing
- —
- Monthly P&I
- —
- Monthly cashflow
- —
- DSCR
- —
- Eligible?
- —
Short-term bridge; refi at stabilization.
Rent comps 6 comps
| Address | Beds | Baths | Sqft | Rent | $/sqft | DOM | Units | Dist |
|---|---|---|---|---|---|---|---|---|
| 15648 Plum Brook Dr Conroe, TX | 4.0 | 2.0 | 1793 | $1,930 | $1.08 | 0d | 1 | 0.02mi |
| 15642 Plum Brook Dr Conroe, TX | 3.0 | 2.0 | 1306 | $1,610 | $1.23 | 0d | 1 | 0.02mi |
| 15652 Plum Brook Dr Conroe, TX | 4.0 | 2.5 | 2203 | $2,135 | $0.97 | 0d | 1 | 0.02mi |
| 15667 Plum Brook Dr Conroe, TX | 4.0 | 2.0 | 1793 | $1,930 | $1.08 | 0d | 1 | 0.02mi |
| 15663 Plum Brook Dr Conroe, TX | 3.0 | 2.0 | 1306 | $1,610 | $1.23 | 0d | 1 | 0.02mi |
| 15793 Bayberry Trace Dr Conroe, TX | 3.0–4.0 | 2.0–2.5 | 1639 | $2,240 | $1.37 | 0d | 1 | 0.22mi |
Listing history 9 events
-
2026-06-04days on market $228,940 Active 27 DOM
-
2026-06-03days on market $228,940 Active 26 DOM
-
2026-06-02days on market $228,940 Active 25 DOM
-
2026-06-01days on market $228,940 Active 24 DOM
-
2026-05-31days on market $228,940 Active 23 DOM
-
2026-05-12price $245,790 430-char remark
-
2026-05-11price $245,790 558-char remark
-
2026-05-08$242,240 Active 430-char remark
-
2026-05-08$242,240 Active 558-char remark
ⓘ Source: listings_history table (triggers on properties + properties_extension) + one-shot
backfill from property_details.listing_events for pre-trigger history.
Nearby sold comps map
Loading sold comps map…
Walkable amenities ~0.75 mi
Loading nearby amenities…
Taxation est. · year 1
- Rental income
- $24,796
- − Mortgage interest
- −$12,824
- − Property taxes
- −$3,434
- − Insurance
- −$1,145
- − Repairs & maintenance
- −$1,984
- − Management
- −$1,984
- − Depreciation
- −$6,660
- Taxable loss
- −$3,235
- Est. tax savings @ 24.0%
- +$776
- After-tax cash flow
- $1,379/yr
For passive investors: Depreciation is non-cash, so a rental often shows a tax loss while cash-flowing — sheltering income. Rental losses are passive: they offset passive income freely, and up to $25,000/yr can offset ordinary (W-2) income if you actively participate and your MAGI is under $100k (phasing out to $0 by $150k); unused losses carry forward. On sale, claimed depreciation is recaptured at up to 25%, and gains may owe capital-gains tax (a 1031 exchange can defer both). Figures are a year-1 estimate at your 24.0% rate — not tax advice; consult a CPA.
Condition & rehab AI · 11 photos
This home is in excellent condition with a modern and well-maintained interior and exterior. It is move-in ready with minor cosmetic updates that would further enhance its value.
Value-add opportunities
- Both Paint exterior trim — Enhances curb appeal and value
- Both Replace window screens — Improves energy efficiency and aesthetics
Renovation cost estimate screening
Value-add ROI direction
- Both Paint exterior trim — Enhances curb appeal and value ↑
- Both Replace window screens — Improves energy efficiency and aesthetics ↑
ⓘ Cost ranges are severity-bucket heuristics (US national rule-of-thumb). Get contractor quotes + a written scope before underwriting a rehab budget.
Schools (NCES district)
- District
- Conroe ISD
- NCES district ID
- 4815000
- Math proficiency
- 57% ▼ -6.00%
- Reading proficiency
- 57% ▼ -1.00%
- Median HH income
- $71,541
- Composite
- 50.65/100
- National rank
- #1833
- State rank
- #69 of 826 in TX
Livability — Cut and Shoot
- Score
- 56/100
- State rank
- #1326
- US rank
- #22835
Category grades
Schools grade is shown separately in the Schools card above.
Census & demographics
- County
- Montgomery County · 663,713 people
- Metro
- Houston-The Woodlands-Sugar Land, TX
- Population (ZIP)
- 28,854
- Household income
- $75,348
- Rent vs Own
- Severe rent burden
- 464.0
Population outlook (Montgomery County) Hauer SSP2
- Today (2025)
- 713,896 people
- By 2030
- 805,263 · +12.8%
- By 2040
- 992,708 · +39.1%
- By 2050
- 1,179,590 · +65.2%
- By 2075
- 1,628,084 · +128.1%
- By 2100
- 1,937,880 · +171.5%
Race, ethnicity, and origin ACS 2023
- Neighborhood character
- Diverse neighborhood (Simpson 0.56)
- Race & ethnicity
- White 54% Hispanic / Latino 38% Two or more races 17% Black 4%
- Hispanic origin (detail)
- Mexican 25%
- Common ancestry
- Lithuanian 1% Romanian 1% Slovak 1%
- Foreign-born
- 13% · Canada, Jamaica
- Languages at home
- 69% English-only · Spanish 31%
Political lean MEDSL · Montgomery
- 2024 margin
- Solid R (+45.5) · D 26.8% · R 72.3%
- 2008→2024 swing
- +7.2pp toward D · 2008: -52.7pp · 2024: -45.5pp
- All cycles
- 2024: R+45.5 2020: R+43.8 2016: R+51.4 2012: R+60.7 2008: R+52.7
Not yet ingested
- Civics
- —
Market trends
- HPI YoY
- ▼ -77.71%
- Current HPI
- 269.5367
- Rent YoY
- ▼ -0.31%
- Metro
- Houston-The Woodlands-Sugar Land, TX
- State GDP YoY
- ▲ 3.95%
- F500 in state
- 110
Industry mix (Fortune 500 HQ in TX)
| Industry | F500 HQs | Revenue |
|---|---|---|
| Energy | 16 | $1,198B |
|
||
| Technology | 5 | $198B |
|
||
| Engineering / Construction | 4 | $72B |
|
||
| Energy Services | 3 | $60B |
|
||
| Utilities | 3 | $41B |
|
||
| Healthcare | 2 | $330B |
|
||
Price history
-5.5% since first listed4 events — show timeline
- 2026-06-02 Listing Removed — HARMLS
- 2026-05-28 Price Changed $228,940 HARMLS
- 2026-05-11 Price Changed $245,790 HARMLS
- 2026-05-08 Listed $242,240 HARMLS
Cash-flow waterfall
monthlySold comps — $/sqft
last 12 mo · ≤1 miLoading sold comps…