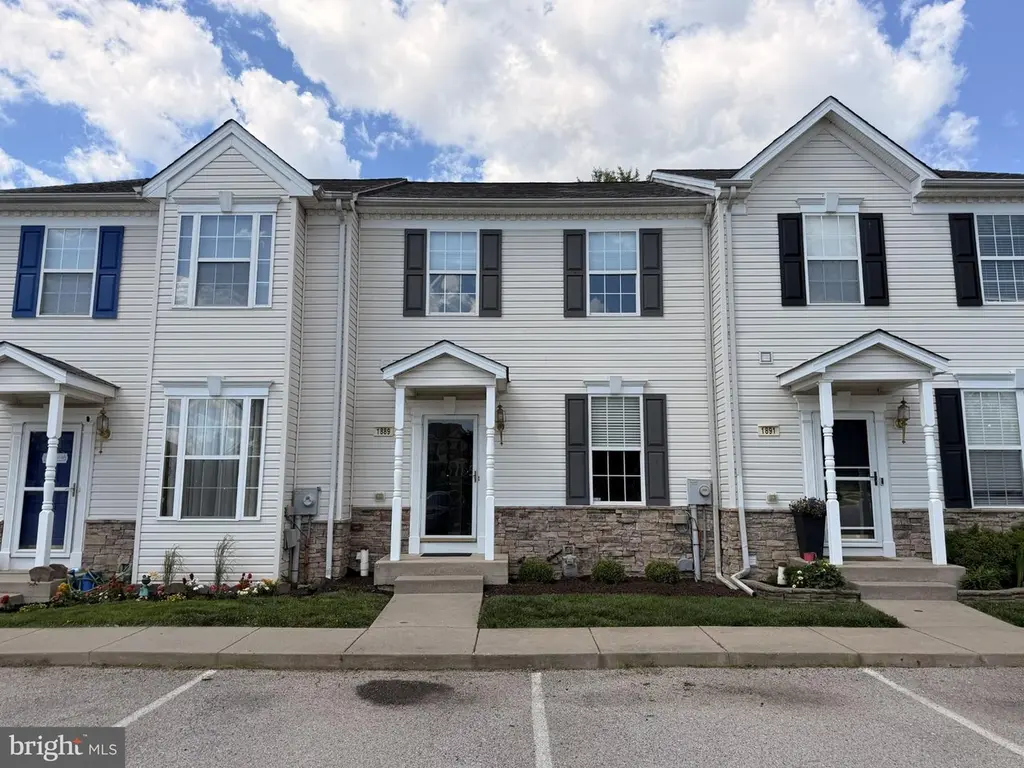
1889 Jamestown Ln #1889 · North Codorus, PA
Flood risk 1/10 · Minimal
- FEMA flood zone
- X (unshaded)
- Chance of flooding over 30 yrs
- 0.0%
- Est. flood insurance / yr
- $473 – $860
Fire risk 3/10 · Minor
- Est. fire insurance / yr
- $511 – $949
Heat risk 5/10 · Moderate
- Hot days now (above 102°F)
- 7 days/yr
- Hot days in 30 yrs
- 15 days/yr
Wind risk 4/10 · Minor
- Chance of severe wind over 30 yrs
- 12.0%
Air-quality risk 3/10 · Minor
- Unhealthy air days now
- 2 days/yr
- Unhealthy air days in 30 yrs
- 4 days/yr
Risk factors via First Street. Map © Google.
Why this score? — see what drove the C- grade
The composite is a weighted blend of 9 inputs, each scored 0–100. Each bar is that input's sub-score; the figure is the points it added to the 100-point composite (weight × sub-score).
- Cash flow +20.4/30.0
- DSCR +6.5/10.0
- 1% rule +6.1/10.0
- ARV discount +5.7/15.0
- Schools +4.8/10.0
- Rent growth +2.5/5.0
- Livability +2.5/5.0
- Condition / age +2.5/5.0
- Appreciation +0.0/10.0
$225,000
🖨 Deal sheet 📄 Offer letter ✓ Due diligence
Listing remarks
Discover the charm of this inviting Colonial-style townhouse in the desirable Colonial Crossings community. With 1,690 sq. ft. of thoughtfully designed living space, this home features a warm combination dining and living area, perfect for gatherings. This home is updated with new flooring and paint throughout. The well-appointed kitchen boasts under 5-year-old modern appliances, including a dishwasher, microwave, and refrigerator, making meal prep a breeze. Enjoy the convenience of three spacious bedrooms and two and a half baths, ensuring comfort for everyone. The partially finished walkout basement offers endless possibilities for an extra bedroom with a walk in closet, home office, gym,
Key facts
- $110 HOA
- Built 2006
- Listed 5 days
Property features AI
Finance
- Other: Pets allowed with size/weight restrictions
- HOA & community: Monthly condo fee of $110; HOA covers common area maintenance, exterior building maintenance, insurance, lawn maintenance and management; Community jogging/walking path
Exterior
- Parking: Off-street parking
- Utilities: Public water; Public sewer; Electric cooling; Natural gas for heating and hot water
- Home design: Interior townhouse/rowhouse; Condominium ownership; Level entry to main floor
- Construction: Stone and vinyl siding exterior; Block foundation; Insulated windows; Full basement with walkout level — partially finished (below grade finished area estimated)
- Exterior features: Level lot; Deck(s); Porch(es); Not in a federal flood zone
Interior
- Kitchen: Dishwasher; Disposal; Microwave; Single oven; Refrigerator
- Bedrooms: Three bedrooms on the upper level
- Bathrooms: Two full bathrooms (upper levels); One half bathroom on the main level
- Heating & cooling: Forced air heating; Natural gas heating and hot water; Central air conditioning (electric)
- Interior features: Combination dining and living area; Dining area; Storm door
- Laundry & utility: Washer; Dryer
Neighborhood map
What this means for you Summary
Snapshot
- This is a 3-bed/2.5-bath townhouse listed at $225k.
Deal economics
- At list price, monthly cash flow is $294 ($4k/yr) — positive.
- The deal already cash-flows at list — no discount required.
- Meets the 1% rule at list price ($2k rent vs $225k).
Location & tenants
- Location reads: area grade C — affects rentability + tenant quality, not the cash-flow math above.
- Spring Grove Area SD (suburban): math 45% / reading 65% proficiency, ranked #98 of 539 in PA (top 18%) — acceptable for families but not a draw, mixed tenant base, ~2y average lease.
- Zoned schools: Spring Grove Area Hs (math 71%, 1,166 students, 32% FRL).
- Market conditions: 146 active listings in the ZIP; 2 comparable units currently listed for rent nearby; solid renter incomes; 1,328 units permitted in York County in 2024 (338 in 5+ unit buildings).
- This rent runs 32% of the median local income ($95k/yr) — at the standard rent-burdened threshold; future hikes will face affordability resistance.
Forward outlook
- Local home prices are declining (-3.0%/yr); year-one equity from $2k of loan paydown is wiped out by about $7k of value loss. Plan a longer hold.
Negotiation context
- Only 5 days on market — expect competitive offers; lowballing is unlikely to land.
- 2 sale attempts since 20y ago; this cycle's ask is 29% above the opening price — seller raised mid-cycle; expect resistance to lowballs.
- Current owner paid $150k; list at $225k implies a 50% gain — meaningful room to come down on a strong offer.
Risks & watch-outs
- Climate carrying-cost: extreme-heat days projected 7→15/yr by 2055 (HVAC capex compounding) — expect insurance premiums to compound above CPI over the hold.
Questions for the listing agent
- What does the HOA fee cover, when was the last increase, and are there any pending special assessments or reserve-fund shortfalls?
- Is there a deadline driving the sale (1031 exchange, divorce, estate, relocation)? That informs how much negotiation room exists.
- What's the average days-on-market for RENTAL listings here right now (not sales)? A rising rental-DOM trend means longer vacancies and softer asking-rent achievability than the comps imply.
- What's the recent tenant-quality profile in this submarket — average credit score on applications, eviction rate, late-payment / NSF rate, and stable-employment percentage? A property-management company in the area should have these aggregated.
- How much new for-sale + rental construction is in the pipeline within 1–3 miles? Heavy new supply typically softens prices + rents 12–24 months out; constrained supply supports both.
Investment metrics
- 1% rule
- 1.11% ✓
- Cap rate
- 7.86%
- Cash-on-cash
- 5.60%
- DSCR
- 1.25
- GRM
- 7.5
CMA / ARV
- ARV (on-the-fly)
- $216,320
- Comps found
- 7
Show comp detail 7 sales within ~0.75 mi
| Address | Dist | Beds/Ba | Sqft | Sold | Price | $/sf | Match |
|---|---|---|---|---|---|---|---|
| 1905 Jamestown Ln | 0.04mi | 3/2.5 | 1,855 (+10%) | 1mo | $216,750 | $117 | 81 |
| 3892 Cannon Ct #3892 | 0.30mi | 3/2.5 | 1,600 (-5%) | 2mo | $200,000 | $125 | 76 |
| 1879 Jamestown Ln #1879 | 0.02mi | 3/2.5 | 1,929 (+14%) | 4mo | $215,000 | $111 | 72 |
| 3590 Cannon Ln #3590 | 0.25mi | 3/2.5 | 1,628 (-4%) | 19mo | $230,000 | $141 | 66 |
| 3596 Cannon Ln | 0.26mi | 3/2.0 | 1,600 (-5%) | 23mo | $212,000 | $133 | 58 |
| 3595 Armory Ln Unit 3595A | 0.35mi | 3/2.5 | 1,485 (-12%) | 12mo | $190,000 | $128 | 53 |
| 3709 Armory Ln #3709 | 0.42mi | 3/2.5 | 1,592 (-6%) | 21mo | $219,900 | $138 | 53 |
Match score weights: distance 35% · size 25% · config 20% · recency 20%. Top-matched comps best support the ARV.
Projected returns pro-forma
-3.0% appreciation · 3.0% rent growth · sell at horizon
- IRR
- -7.6%
- Equity multiple
- 0.72×
- Total profit
- $-17,622
- Equity at exit
- $33,548
- IRR
- 2.0%
- Equity multiple
- 1.15×
- Total profit
- $9,225
- Equity at exit
- $19,454
Cash invested: $63,000 (down + closing). Projections, not guarantees.
Landlord ↔ Tenant lean methodology
- Overall (STATE)
- 62 Landlord-Friendly
- State Pennsylvania
- 62 Landlord-Friendly · EVEN
- County
- — inherits STATE
- City
- — inherits STATE
ZIP-level market 17408
- Home prices YoY
- -26.6%
- Active inventory
- 146
- Price-to-rent
- 7.5×
Monthly cashflow live
- Estimated rent
- $2,495 medium interval (Pro) →
- Mortgage (P&I)
- −$1,180
- Tax from tax record
- −$294 /mo · $3,522/yr
- Insurance
- −$94
- HOA
- −$110
- Vacancy / Maint / Mgmt
- −$524
- Net cashflow
- $294
Break-even live
UW: 25.0% down · 7.5% · 30yr · 1.5% tax · 5.0% vac · 8.0% maint · 8.0% mgmt
Financing live
Cash to close
- Down payment
- $56,250
- Closing costs
- $6,750
- Reserves months
- —
- Total cash needed
- —
Loan-product check · same deal, 3 products live
Conventional
25% down · 7.5% · 30yr
- Down + closing
- —
- Monthly P&I
- —
- Monthly cashflow
- —
- DSCR
- —
- Eligible?
- —
Personal DTI + credit; lowest rate.
DSCR
20% down · 8.5% · 30yr
- Down + closing
- —
- Monthly P&I
- —
- Monthly cashflow
- —
- DSCR
- —
- Eligible?
- —
No personal income docs; deal must DSCR.
Hard money
10% down · 12.0% · 12mo
- Down + closing
- —
- Monthly P&I
- —
- Monthly cashflow
- —
- DSCR
- —
- Eligible?
- —
Short-term bridge; refi at stabilization.
Rent comps 2 comps
| Address | Beds | Baths | Sqft | Rent | $/sqft | DOM | Units | Dist |
|---|---|---|---|---|---|---|---|---|
| 1867 Buck Hill Dr York, PA | 4.0 | 2.5 | 2000 | $3,250 | $1.62 | 43d | 1 | 0.24mi |
| 3906 Tunnel Hill Rd York, PA | 2.0 | 1.0 | 1100 | $1,595 | $1.45 | 13d | 15 | 0.77mi |
HOA detail
- Monthly dues
- $110 · $1,320/yr
- Likely covers
- gym
Listing history 11 events
-
2026-06-17status $225,000 Pending 5 DOM
-
2026-06-17days on market $225,000 Active 5 DOM
-
2026-06-16days on market $225,000 Active 4 DOM
-
2026-06-15days on market $225,000 Active 3 DOM
-
2026-06-13statusdays on market $225,000 Active 1 DOM
-
2026-06-10days on market $225,000 Coming Soon 7 DOM
-
2026-06-09days on market $225,000 Coming Soon 6 DOM
-
2026-06-08days on market $225,000 Coming Soon 5 DOM
-
2026-06-07days on market $225,000 Coming Soon 4 DOM
-
2026-06-05remarks 699-char remark
-
2026-06-05$225,000 Coming Soon 1 DOM
ⓘ Source: listings_history table (triggers on properties + properties_extension) + one-shot
backfill from property_details.listing_events for pre-trigger history.
Tax reassessment forecast PA · Partial reset (capped growth)
- Current annual tax
- $3,522 · $294/mo
- Projected year-2 tax
- $3,539 · $295/mo
- Expected delta
- +$16/yr (+$1/mo · 0.5%)
ⓘ Screening estimate from a state-policy table — verify with the county assessor before closing.
Climate risk First Street
- Flood 1/10 Low FEMA zone X (unshaded) · 0% chance over 30 yrs
- Wildfire 3/10 Moderate
- Heat 5/10 Major 7 d/yr ≥102°F today · 15 d/yr by 30 yrs out
- Wind 4/10 Moderate 12% chance of damaging wind over 30 yrs
- Air quality 3/10 Moderate 2 unhealthy d/yr today · 4 by 30 yrs out
Nearby sold comps map
Loading sold comps map…
Walkable amenities ~0.75 mi
Loading nearby amenities…
Taxation est. · year 1
- Rental income
- $29,942
- − Mortgage interest
- −$12,603
- − Property taxes
- −$3,522
- − Insurance
- −$1,125
- − Repairs & maintenance
- −$2,395
- − Management
- −$2,395
- − HOA
- −$1,320
- − Depreciation
- −$6,545
- Taxable income
- $35
- Est. tax owed @ 24.0%
- −$8
- After-tax cash flow
- $3,520/yr
For passive investors: Depreciation is non-cash, so a rental often shows a tax loss while cash-flowing — sheltering income. Rental losses are passive: they offset passive income freely, and up to $25,000/yr can offset ordinary (W-2) income if you actively participate and your MAGI is under $100k (phasing out to $0 by $150k); unused losses carry forward. On sale, claimed depreciation is recaptured at up to 25%, and gains may owe capital-gains tax (a 1031 exchange can defer both). Figures are a year-1 estimate at your 24.0% rate — not tax advice; consult a CPA.
Schools (NCES district)
- District
- Spring Grove Area SD
- NCES district ID
- 4222590
- Math proficiency
- 45% ▼ -14.00%
- Reading proficiency
- 65% ▼ -9.00%
- Median HH income
- $64,950
- Composite
- 48.28/100
- National rank
- #2155
- State rank
- #98 of 539 in PA
Livability — North Codorus
No livability data for this city. (Only ~50 U.S. cities are tracked.)
Census & demographics
- County
- York County · 278,806 people
- Metro
- York-Hanover, PA
- Population (ZIP)
- 25,431
- Household income
- $94,565
- Rent vs Own
- Severe rent burden
- 435.0
Population outlook (York County) Hauer SSP2
- Today (2025)
- 454,205 people
- By 2030
- 457,407 · +0.7%
- By 2040
- 457,529 · +0.7%
- By 2050
- 448,261 · -1.3%
- By 2075
- 427,388 · -5.9%
- By 2100
- 384,218 · -15.4%
Race, ethnicity, and origin ACS 2023
- Neighborhood character
- Predominantly White (78%)
- Race & ethnicity
- White 78% Hispanic / Latino 8% Two or more races 6% Black 5% Asian 4%
- Hispanic origin (detail)
- Mexican 1% Puerto Rican 6%
- Common ancestry
- Romanian 2% Slovak 2% Italian 1%
- Foreign-born
- 5% · Canada, Vietnam
- Languages at home
- 89% English-only · Spanish 6% Other Indo-European 2% Vietnamese 1%
Political lean MEDSL · York
- 2024 margin
- Strong R (+25.3) · D 36.9% · R 62.1%
- 2008→2024 swing
- -11.7pp toward R · 2008: -13.6pp · 2024: -25.3pp
- All cycles
- 2024: R+25.3 2020: R+24.6 2016: R+29.3 2012: R+21.2 2008: R+13.6
Not yet ingested
- Civics
- —
Market trends
- HPI YoY
- ▼ -86.74%
- Current HPI
- 239.5179
- Rent YoY
- —
- Metro
- York-Hanover, PA
- State GDP YoY
- ▲ 1.68%
- F500 in state
- 34
Industry mix (Fortune 500 HQ in PA)
| Industry | F500 HQs | Revenue |
|---|---|---|
| Healthcare | 2 | $309B |
|
||
| Insurance | 2 | $27B |
|
||
| Telecommunications / Media | 1 | $124B |
|
||
| Industrial Distribution | 1 | $22B |
|
||
| Financial Services | 1 | $20B |
|
||
| Chemicals / Materials | 1 | $18B |
|
||
Price history
+27.2% since first listed6 events — show timeline
- 2026-06-03 Coming Soon $225,000 BRIGHT MLS
- 2008-06-30 Listing Removed — BRIGHT MLS
- 2007-09-23 Listed $175,000 BRIGHT MLS
- 2006-08-17 Sold (Public Records) $149,900 Public Records
- 2006-07-01 Listing Removed — BRIGHT MLS
- 2006-02-16 Listed $176,900 BRIGHT MLS
Property tax history
-1.3%/yrLatest (2025): $3,522 · +1.1% YoY. Source: county tax records.
Cash-flow waterfall
monthlySold comps — $/sqft
last 12 mo · ≤1 miLoading sold comps…