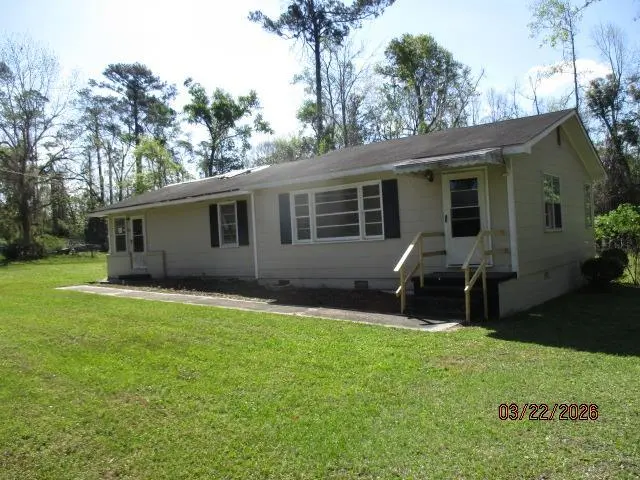
503 Canna Dr · Valdosta, GA
Flood risk 6/10 · Moderate
- FEMA flood zone
- X (unshaded)
- Chance of flooding over 30 yrs
- 0.68%
- Est. flood insurance / yr
- $507 – $1,088
Fire risk 5/10 · Moderate
- Est. fire insurance / yr
- $963 – $1,789
Heat risk 7/10 · Major
- Hot days now (above 108°F)
- 6 days/yr
- Hot days in 30 yrs
- 16 days/yr
Wind risk 8/10 · Major
- Chance of severe wind over 30 yrs
- 99.0%
Air-quality risk 6/10 · Moderate
- Unhealthy air days now
- 10 days/yr
- Unhealthy air days in 30 yrs
- 11 days/yr
Risk factors via First Street. Map © Google.
Why this score? — see what drove the C+ grade
The composite is a weighted blend of 9 inputs, each scored 0–100. Each bar is that input's sub-score; the figure is the points it added to the 100-point composite (weight × sub-score).
- Cash flow +23.3/30.0
- ARV discount +15.0/15.0
- DSCR +7.5/10.0
- 1% rule +5.7/10.0
- Rent growth +3.5/5.0
- Livability +3.0/5.0
- Condition / age +2.5/5.0
- Schools +1.5/10.0
- Appreciation +0.0/10.0
$131,750
🖨 Deal sheet 📄 Offer letter ✓ Due diligence
Listing remarks MLS
This is a great opportunity for a rental property investment or first-time homebuyer to purchase a home at a great price point in a very central location! 3 bedrooms and 1 updated bathroom. The kitchen was partially updated but not finished. Fenced backyard and nice screened back porch. 2-car carport with utility/storage room. The living room is very spacious and has a lot of windows and natural light! Cash or conventional financing only.
Key facts
- Screened back porch
- Fenced backyard
- Utility storage room
Tags
Neighborhood map
What this means for you Summary
Snapshot
- This is a 3-bed/1.0-bath single-family listed at $132k.
Deal economics
- At list price, monthly cash flow is $241 ($3k/yr) — positive.
- The deal already cash-flows at list — no discount required.
- Meets the 1% rule at list price ($1k rent vs $132k).
- Recommended offer: $124k (6.0% below list) — sets the bar for market timing.
- Cap rate 8.5% vs local median 4.3% in Valdosta — top-decile yield for the area; either an underpriced asset or a hidden risk that comps aren't pricing in. Stress-test before assuming the spread holds.
Location & tenants
- Location reads 60/100 on livability (#392 in GA) — a middle-class / working-renter tenant base. Strengths: cost of living A+, health & safety A+, housing A-; Watch: schools F, crime F, amenities F.
- Valdosta City (urban): math 15% / reading 22% proficiency, ranked #149 of 174 in GA (top 86%) — low school quality limits family demand, transient renter base, plan for 1-2y turnover; 74% free/reduced lunch — lower-income household profile, screen leases tightly.
- Market conditions: Rents rising fast (+4.2%/yr); 267 active listings in the ZIP; 40 comparable units currently listed for rent nearby; rentals lingering (median 44d on market — plan ~5-8 weeks vacancy on turnover, expect pricing pressure); 65% of comp listings sitting > 30 days — soft ceiling on asking rent; 896 units permitted in Lowndes County in 2024 (0 in 5+ unit buildings).
Forward outlook
- Local home prices are declining (-3.0%/yr); year-one equity from $910 of loan paydown is wiped out by about $4k of value loss. Plan a longer hold.
- Lowndes County population projected at +10% by 2050 — modest demand growth; plan on rents tracking national, not racing it.
Negotiation context
- It's been on market 84 days — a 6% lower offer ($124k) is reasonable based on typical stale-listing flexibility.
- 2 sale attempts since 6y ago; this cycle's ask has dropped $25k (16%) from the opening price — seller is motivated, your offer sets the floor, not the list.
Risks & watch-outs
- Climate carrying-cost: major flood risk; severe wind risk, 99% chance of damaging wind over 30y; moderate wildfire risk; extreme-heat days projected 6→16/yr by 2055 (HVAC capex compounding) — expect insurance premiums to compound above CPI over the hold.
Questions for the listing agent
- It's been on market 84 days. Have you received any prior offers? Is the seller open to a 6% concession, seller financing, or rate buy-down credit?
- Why hasn't it sold? Are there any deal-killer items the seller is aware of (foundation, flood, title, zoning, code violations)?
- Is there a deadline driving the sale (1031 exchange, divorce, estate, relocation)? That informs how much negotiation room exists.
- Schools are F-rated, which usually means shorter tenancies and higher turnover. Who's the typical renter profile here, and what's been the actual vacancy rate?
- Crime grade is F in this area — have there been break-ins, vandalism, or insurance claims at this property in the last 3 years? What carrier currently insures it and at what premium?
- What's the average days-on-market for RENTAL listings here right now (not sales)? A rising rental-DOM trend means longer vacancies and softer asking-rent achievability than the comps imply.
- What's the recent tenant-quality profile in this submarket — average credit score on applications, eviction rate, late-payment / NSF rate, and stable-employment percentage? A property-management company in the area should have these aggregated.
- How much new for-sale + rental construction is in the pipeline within 1–3 miles? Heavy new supply typically softens prices + rents 12–24 months out; constrained supply supports both.
Investment metrics
- 1% rule
- 1.07% ✓
- Cap rate
- 8.49%
- Cash-on-cash
- 7.85%
- DSCR
- 1.35
- GRM
- 7.8
CMA / ARV
- ARV (median comp)
- $175,114
- List price
- $131,750
- Delta
- -24.76%
- Verdict
- UNDERPRICED
- Comps
- 20 within 1.0 mi
Show comp detail 12 sales within ~0.75 mi
| Address | Dist | Beds/Ba | Sqft | Sold | Price | $/sf | Match |
|---|---|---|---|---|---|---|---|
| 36 Loganberry Cir | 0.43mi | 3/1.5 | 1,377 (-1%) | 7mo | $144,000 | $105 | 70 |
| 2302 Glynndale Dr | 0.58mi | 2/1.5 (-1) | 1,402 (+1%) | 1mo | $200,000 | $143 | 64 |
| 507 Mack Dr | 0.35mi | 3/2.0 | 1,511 (+8%) | 3mo | $190,000 | $126 | 63 |
| 2211 Jerry Jones Dr | 0.68mi | 3/1.0 | 1,327 (-5%) | 2mo | $169,000 | $127 | 59 |
| 2323 White Oak Dr | 0.44mi | 3/1.5 | 1,264 (-9%) | 7mo | $190,000 | $150 | 57 |
| 700 W Park Ave | 0.71mi | 3/2.0 | 1,324 (-5%) | 3mo | $202,500 | $153 | 52 |
| 2908 Fawnwood Cir | 0.43mi | 3/2.0 | 1,574 (+13%) | 4mo | $188,040 | $119 | 51 |
| 315 Canna Dr | 0.41mi | 3/2.0 | 1,206 (-13%) | 5mo | $169,900 | $141 | 50 |
| 1 Loganberry Cir | 0.50mi | 3/2.0 | 1,566 (+12%) | 3mo | $199,000 | $127 | 49 |
| 309 Betty Jo Dr | 0.60mi | 3/2.0 | 1,240 (-11%) | 4mo | $217,000 | $175 | 46 |
| 410 Georgetown Cir | 0.44mi | 2/2.0 (-1) | 1,586 (+14%) | 5mo | $170,000 | $107 | 43 |
| 307 W Park Ave | 0.68mi | 3/2.0 | 1,555 (+12%) | 6mo | $195,000 | $125 | 40 |
Match score weights: distance 35% · size 25% · config 20% · recency 20%. Top-matched comps best support the ARV.
Projected returns pro-forma
-3.0% appreciation · 4.19% rent growth · sell at horizon
- IRR
- -3.0%
- Equity multiple
- 0.88×
- Total profit
- $-4,281
- Equity at exit
- $19,644
- IRR
- 7.9%
- Equity multiple
- 1.63×
- Total profit
- $23,216
- Equity at exit
- $11,391
Cash invested: $36,890 (down + closing). Projections, not guarantees.
Landlord ↔ Tenant lean methodology
- Overall (STATE)
- 90 Strongly Landlord-Friendly
- State Georgia
- 90 Strongly Landlord-Friendly · R+3
- County
- — inherits STATE
- City
- — inherits STATE
ZIP-level market 31602
- Rents YoY
- 4.2%
- Active inventory
- 267
- Price-to-rent
- 7.8×
Monthly cashflow live
- Estimated rent
- $1,408 high interval (Pro) →
- Mortgage (P&I)
- −$691
- Tax from tax record
- −$125 /mo · $1,502/yr
- Insurance
- −$55
- HOA
- −$0
- Vacancy / Maint / Mgmt
- −$296
- Net cashflow
- $241
Break-even live
UW: 25.0% down · 7.5% · 30yr · 1.5% tax · 5.0% vac · 8.0% maint · 8.0% mgmt
Financing live
Cash to close
- Down payment
- $32,938
- Closing costs
- $3,952
- Reserves months
- —
- Total cash needed
- —
Loan-product check · same deal, 3 products live
Conventional
25% down · 7.5% · 30yr
- Down + closing
- —
- Monthly P&I
- —
- Monthly cashflow
- —
- DSCR
- —
- Eligible?
- —
Personal DTI + credit; lowest rate.
DSCR
20% down · 8.5% · 30yr
- Down + closing
- —
- Monthly P&I
- —
- Monthly cashflow
- —
- DSCR
- —
- Eligible?
- —
No personal income docs; deal must DSCR.
Hard money
10% down · 12.0% · 12mo
- Down + closing
- —
- Monthly P&I
- —
- Monthly cashflow
- —
- DSCR
- —
- Eligible?
- —
Short-term bridge; refi at stabilization.
Rent comps 40 comps
| Address | Beds | Baths | Sqft | Rent | $/sqft | DOM | Units | Dist |
|---|---|---|---|---|---|---|---|---|
| 2502 Berkley Dr Valdosta, GA | 3.0 | 2.0 | 1484 | $1,650 | $1.11 | 21d | 1 | 0.14mi |
| 2859 Fawnwood Cir Valdosta, GA | 2.0 | 2.0 | 1173 | $1,400 | $1.19 | 21d | 1 | 0.31mi |
| 2878 Fawnwood Cir Valdosta, GA | 3.0 | 2.0 | 1400 | $3,000 | $2.14 | 43d | 1 | 0.34mi |
| 413 Georgetown Cir Valdosta, GA | 2.0 | 2.0 | 1178 | $1,400 | $1.19 | 43d | 1 | 0.42mi |
| 702 Pineridge Dr Valdosta, GA | 3.0 | 2.0 | 1736 | $1,650 | $0.95 | 43d | 1 | 0.48mi |
| 2219 White Oak Dr Valdosta, GA | 2.0 | 1.0 | 1100 | $2,250 | $2.05 | 43d | 1 | 0.59mi |
| 407 Northfield Rd Valdosta, GA | 3.0 | 2.0 | 1505 | $1,395 | $0.93 | 21d | 1 | 0.64mi |
| 200 W Cranford Ave Valdosta, GA | 2.0 | 2.0 | 950 | $1,225 | $1.29 | 21d | 3 | 0.84mi |
| 100 Garden Dr Valdosta, GA | 1.0–3.0 | 1.0–3.0 | 885 | $2,075 | $2.34 | 21d | 13 | 0.96mi |
| 807 Cherokee Ave Unit A Valdosta, GA | 2.0 | 2.5 | 1200 | $2,000 | $1.67 | 43d | 1 | 1.02mi |
| 1612 Garland Pl Valdosta, GA | 3.0 | 2.0 | 1268 | $1,295 | $1.02 | 43d | 1 | 1.04mi |
| 2437 University Dr Valdosta, GA | 3.0 | 1.0 | 879 | $1,175 | $1.34 | 43d | 1 | 1.05mi |
| 1704 N Patterson St Unit 4 Valdosta, GA | 2.0 | 2.0 | 1100 | $950 | $0.86 | 43d | 1 | 1.06mi |
| 1018 Cherokee St Valdosta, GA | 3.0 | 1.5 | 1225 | $1,375 | $1.12 | 21d | 1 | 1.09mi |
| 1213 McRee Dr Valdosta, GA | 4.0 | 2.0 | 1588 | $1,895 | $1.19 | 43d | 1 | 1.14mi |
| 6 Meadow Run Cir Unit F Valdosta, GA | 2.0 | 1.0 | 920 | $895 | $0.97 | 43d | 1 | 1.17mi |
| 304 E Cranford Ave Valdosta, GA | 2.0 | 1.0 | 980 | $850 | $0.87 | 43d | 1 | 1.17mi |
| 3 Meadow Run Cir Unit F Valdosta, GA | 2.0 | 1.0 | 920 | $895 | $0.97 | 43d | 1 | 1.23mi |
| 360 Brookfield Rd Valdosta, GA | 3.0 | 2.5 | 1278 | $1,100 | $0.86 | 43d | 1 | 1.24mi |
| 420 Connell Rd Valdosta, GA | 1.0–3.0 | 1.0–2.0 | 1051 | $1,375 | $1.31 | 21d | 8 | 1.25mi |
| 1308 W Alden Ave Valdosta, GA | 3.0 | 1.5 | 1204 | $1,050 | $0.87 | 43d | 1 | 1.26mi |
| 1400 Baytree Dr Valdosta, GA | 2.0–4.0 | 2.0–4.0 | 1277 | $614 | $0.48 | 43d | 1 | 1.27mi |
| 411 Northside Dr Unit G5 Valdosta, GA | 2.0 | 1.5 | 950 | $795 | $0.84 | 43d | 1 | 1.27mi |
| 411 Northside Dr Valdosta, GA | 2.0 | 2.0 | 950 | $795 | $0.84 | 43d | 1 | 1.27mi |
| 2 Westbrook Cir Apt B Valdosta, GA | 3.0 | 2.0 | 1469 | $1,350 | $0.92 | 43d | 1 | 1.28mi |
| 2305 Bemiss Rd Unit T16 Valdosta, GA | 2.0 | 1.5 | 896 | $850 | $0.95 | 43d | 1 | 1.32mi |
| 2205 Bemiss Rd Valdosta, GA | 2.0 | 1.0 | 880 | $1,095 | $1.24 | 43d | 3 | 1.33mi |
| 1506 Slater St Unit 7 Valdosta, GA | 2.0 | 1.5 | 1037 | $695 | $0.67 | 43d | 1 | 1.33mi |
| 1307 Baytree Dr Apt E Valdosta, GA | 3.0 | 2.0 | 1756 | $1,250 | $0.71 | 43d | 1 | 1.33mi |
| 1307 Melody Ln Valdosta, GA | 2.0 | 1.0 | 1025 | $1,050 | $1.02 | 21d | 1 | 1.34mi |
| 334 Sawgrass Dr Valdosta, GA | 3.0 | 2.0 | 1150 | $1,595 | $1.39 | 21d | 1 | 1.34mi |
| 422 Connell Rd Valdosta, GA | 2.0 | 3.0 | 1125 | $1,050 | $0.93 | 21d | 1 | 1.34mi |
| 611 Pineview Dr Valdosta, GA | 1.0–3.0 | 1.0–2.5 | 1204 | $1,600 | $1.33 | 21d | 3 | 1.37mi |
| 439 Heritage Pl Valdosta, GA | 2.0 | 1.0 | 983 | $1,025 | $1.04 | 21d | 1 | 1.39mi |
| 2092 S Sherwood Dr Valdosta, GA | 2.0 | 2.0 | 1156 | $1,350 | $1.17 | 21d | 1 | 1.39mi |
| 707 Baytree Dr Apt 1 Valdosta, GA | 3.0 | 3.0 | 1222 | $675 | $0.55 | 43d | 1 | 1.39mi |
| 2092 S Sherwood Dr Valdosta, GA | 2.0 | 2.0 | 1156 | $1,238 | $1.07 | 43d | 2 | 1.43mi |
| 713 Lakeland Ave Valdosta, GA | 2.0 | 1.0 | 1047 | $895 | $0.85 | 43d | 1 | 1.46mi |
| 1455 Green St Unit A Valdosta, GA | 2.0 | 1.5 | 1048 | $900 | $0.86 | 21d | 1 | 1.46mi |
| 1314 Hastings Dr Unit C4 Valdosta, GA | 2.0 | 2.5 | 1200 | $1,095 | $0.91 | 43d | 1 | 1.47mi |
Listing history 24 events
-
2026-06-19days on market $131,750 Active 84 DOM
-
2026-06-18days on market $131,750 Active 83 DOM
-
2026-06-17days on market $131,750 Active 82 DOM
-
2026-06-16days on market $131,750 Active 81 DOM
-
2026-06-15price $131,750 Active 80 DOM
-
2026-06-15days on market $146,750 Active 80 DOM
-
2026-06-14days on market $146,750 Active 78 DOM
-
2026-06-13days on market $146,750 Active 77 DOM
-
2026-06-10days on market $146,750 Active 75 DOM
-
2026-06-09days on market $146,750 Active 74 DOM
-
2026-06-08days on market $146,750 Active 73 DOM
-
2026-06-07days on market $146,750 Active 72 DOM
-
2026-06-05days on market $146,750 Active 69 DOM
-
2026-06-03days on market $146,750 Active 68 DOM
-
2026-06-02days on market $146,750 Active 67 DOM
-
2026-06-01days on market $146,750 Active 66 DOM
-
2026-05-31days on market $146,750 Active 65 DOM
-
2026-05-30days on market $146,750 Active 64 DOM
-
2026-04-29price $146,750 444-char remark
Show marketing remark (444 chars)
This is a great opportunity for a rental property investment or first-time homebuyer to purchase a home at a great price point in a very central location! 3 bedrooms and 1 updated bathroom. The kitchen was partially updated but not finished. Fenced backyard and nice screened back porch. 2-car carport with utility/storage room. The living room is very spacious and has a lot of windows and natural light! Cash or conventional financing only.
-
2026-03-27$156,750 Active 444-char remark
Show marketing remark (444 chars)
This is a great opportunity for a rental property investment or first-time homebuyer to purchase a home at a great price point in a very central location! 3 bedrooms and 1 updated bathroom. The kitchen was partially updated but not finished. Fenced backyard and nice screened back porch. 2-car carport with utility/storage room. The living room is very spacious and has a lot of windows and natural light! Cash or conventional financing only.
-
2021-04-07soldstatus $138,000
-
2021-04-05soldstatus $138,000
-
2020-11-09$138,000
-
1983-03-25soldstatus $27,000
ⓘ Source: listings_history table (triggers on properties + properties_extension) + one-shot
backfill from property_details.listing_events for pre-trigger history.
Tax reassessment forecast GA · Resets to sale price
- Current annual tax
- $1,502 · $125/mo
- Projected year-2 tax
- $1,502 · $125/mo
- Expected delta
- $0/yr ($0/mo · 0.0%)
ⓘ Screening estimate from a state-policy table — verify with the county assessor before closing.
Climate risk First Street
- Flood 6/10 Major FEMA zone X (unshaded) · 68% chance over 30 yrs
- Wildfire 5/10 Major
- Heat 7/10 Severe 6 d/yr ≥108°F today · 16 d/yr by 30 yrs out
- Wind 8/10 Severe 99% chance of damaging wind over 30 yrs
- Air quality 6/10 Major 10 unhealthy d/yr today · 11 by 30 yrs out
Nearby sold comps map
Loading sold comps map…
Walkable amenities ~0.75 mi
Loading nearby amenities…
Taxation est. · year 1
- Rental income
- $16,895
- − Mortgage interest
- −$7,380
- − Property taxes
- −$1,502
- − Insurance
- −$659
- − Repairs & maintenance
- −$1,352
- − Management
- −$1,352
- − Depreciation
- −$3,833
- Taxable income
- $818
- Est. tax owed @ 24.0%
- −$196
- After-tax cash flow
- $2,699/yr
For passive investors: Depreciation is non-cash, so a rental often shows a tax loss while cash-flowing — sheltering income. Rental losses are passive: they offset passive income freely, and up to $25,000/yr can offset ordinary (W-2) income if you actively participate and your MAGI is under $100k (phasing out to $0 by $150k); unused losses carry forward. On sale, claimed depreciation is recaptured at up to 25%, and gains may owe capital-gains tax (a 1031 exchange can defer both). Figures are a year-1 estimate at your 24.0% rate — not tax advice; consult a CPA.
Schools (NCES district)
- District
- Valdosta City
- NCES district ID
- 1305310
- Math proficiency
- 15% ▼ -12.00%
- Reading proficiency
- 22% ▼ -7.00%
- Median HH income
- $30,634
- Composite
- 14.79/100
- National rank
- #9388
- State rank
- #149 of 174 in GA
Livability — Valdosta
- Score
- 60/100
- State rank
- #392
- US rank
- #19544
Category grades
Schools grade is shown separately in the Schools card above.
Census & demographics
- Census place
- Valdosta, GA
- County
- Lowndes County · 107,801 people
- City population
- 91,859
- Metro
- Valdosta, GA
- Population (ZIP)
- 35,728
- Household income
- $56,939
- Rent vs Own
- Severe rent burden
- 2034.0
Population outlook (Lowndes County) Hauer SSP2
- Today (2025)
- 120,348 people
- By 2030
- 123,469 · +2.6%
- By 2040
- 128,482 · +6.8%
- By 2050
- 131,907 · +9.6%
- By 2075
- 139,080 · +15.6%
- By 2100
- 133,649 · +11.1%
Race, ethnicity, and origin ACS 2023
- Neighborhood character
- Diverse neighborhood (Simpson 0.61)
- Race & ethnicity
- White 45% Black 42% Hispanic / Latino 7% Two or more races 5% Asian 2%
- Hispanic origin (detail)
- Mexican 3% Puerto Rican 1%
- Common ancestry
- Italian 1% Slovak 1% Lithuanian 1%
- Foreign-born
- 4% · Canada
- Languages at home
- 94% English-only · Spanish 3% Other Indo-European 1% French/Haitian/Cajun 1%
Political lean MEDSL · Lowndes
- 2024 margin
- R (+18.0) · D 40.8% · R 58.8%
- 2008→2024 swing
- -8.6pp toward R · 2008: -9.4pp · 2024: -18.0pp
- All cycles
- 2024: R+18.0 2020: R+12.0 2016: R+18.2 2012: R+10.5 2008: R+9.4
Not yet ingested
- Civics
- —
Market trends
- HPI YoY
- ▼ -150.60%
- Current HPI
- 188.2012
- Rent YoY
- ▲ 4.19%
- Metro
- Valdosta, GA
- State GDP YoY
- ▲ 2.66%
- F500 in state
- 28
Industry mix (Fortune 500 HQ in GA)
| Industry | F500 HQs | Revenue |
|---|---|---|
| Paper / Packaging | 2 | $29B |
|
||
| Retail | 1 | $160B |
|
||
| Transportation / Logistics | 1 | $91B |
|
||
| Airlines | 1 | $62B |
|
||
| Consumer Goods | 1 | $47B |
|
||
| Utilities | 1 | $25B |
|
||
Price history
+443.5% since first listed6 events — show timeline
- 2026-04-29 Price Changed $146,750 SGMLS
- 2026-03-27 Listed $156,750 SGMLS
- 2021-04-07 Sold (Public Records) $138,000 Public Records
- 2021-04-05 Sold (MLS) $138,000 SGMLS
- 2020-11-09 Listed $138,000 SGMLS
- 1983-03-25 Sold (Public Records) $27,000 Public Records
Property tax history
+4.7%/yrLatest (2025): $1,502 · +11.9% YoY. Source: county tax records.
Cash-flow waterfall
monthlySold comps — $/sqft
last 12 mo · ≤1 miLoading sold comps…