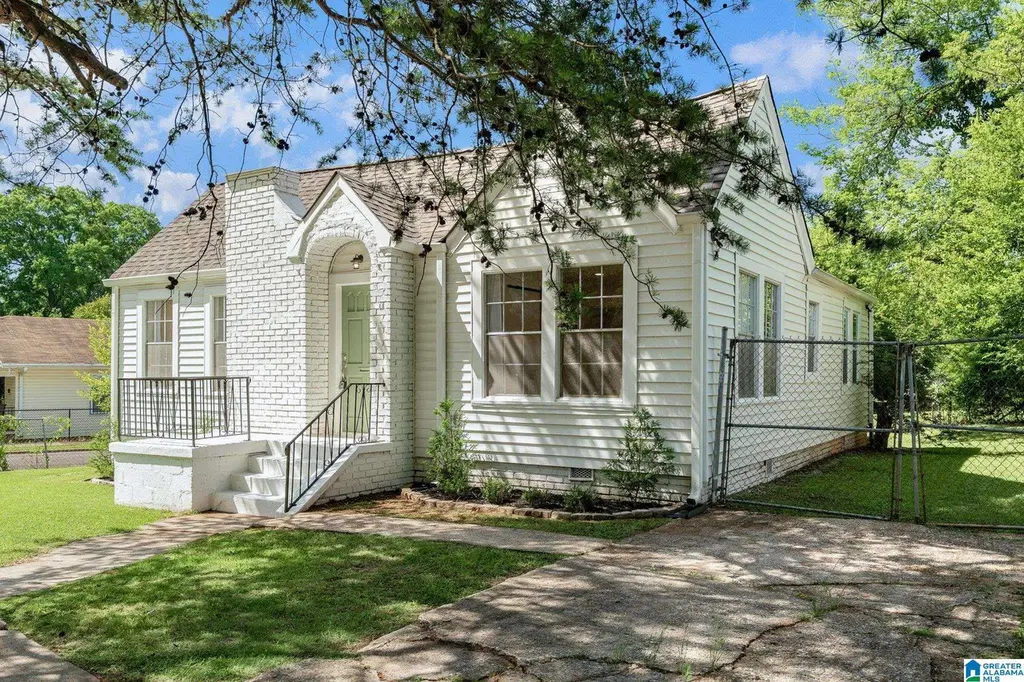
1130 16th St SW · Birmingham, AL
Flood risk 1/10 · Minimal
- FEMA flood zone
- X (unshaded)
- Chance of flooding over 30 yrs
- 0.0%
- Est. flood insurance / yr
- $507 – $1,088
Fire risk 1/10 · Minimal
- Est. fire insurance / yr
- $916 – $1,700
Heat risk 6/10 · Moderate
- Hot days now (above 106°F)
- 7 days/yr
- Hot days in 30 yrs
- 19 days/yr
Wind risk 6/10 · Moderate
- Chance of severe wind over 30 yrs
- 27.0%
Air-quality risk 4/10 · Minor
- Unhealthy air days now
- 5 days/yr
- Unhealthy air days in 30 yrs
- 5 days/yr
Risk factors via First Street. Map © Google.
Why this score? — see what drove the D grade
The composite is a weighted blend of 9 inputs, each scored 0–100. Each bar is that input's sub-score; the figure is the points it added to the 100-point composite (weight × sub-score).
- Cash flow +20.4/30.0
- DSCR +6.5/10.0
- 1% rule +4.4/10.0
- Livability +3.4/5.0
- Rent growth +2.5/5.0
- Condition / age +2.5/5.0
- Schools +0.9/10.0
- ARV discount +0.0/15.0
- Appreciation +0.0/10.0
$130,000
🖨 Deal sheet 📄 Offer letter ✓ Due diligence
Listing remarks MLS
Come see this 3 bedroom 1 bath home featuring living room, dining room, kitchen and laundry room. Diamond in the rough. This home has potential to be a cottage with arches and charming details - just bring your imagination. A great investment opportunity!
Key facts
- New plumbing
- New hvac
- New water heater
Tags
Property features AI
Finance
- Other: Lot is approximately 0.1 acre; Not in a flood plain
- HOA & community: No association fees
Exterior
- Parking: Driveway parking; Off-street parking; On-street parking; Uncovered parking
- Security: Security system
- Utilities: Public water; Connected sewer; Electric water heater; LED lighting (energy-efficient features); Internet service available (provider TBA)
- Home design: Existing single-family property; Crawl space foundation; Siding with Hardiplank exterior
- Construction: Hardiplank siding; Crawl space foundation
- Exterior features: Porch; Open deck; Sidewalks; Paved, public road access
Interior
- Kitchen: Stone countertops; Pantry; Refrigerator; Freezer; Some stainless appliances; Electric stove
- Bedrooms: Three bedrooms on the main level
- Flooring: Hardwood laminate; Tile flooring
- Bathrooms: One full bathroom; Garden tub and tub/shower combo; Shared bath layout
- Heating & cooling: Central electric heating; Central electric cooling
- Interior features: Smooth ceilings; Recessed lighting; Security system; Electric fireplace insert in the living room; Pantry; Walk-in attic
- Laundry & utility: Laundry on the main level; Washer hookup; Electric dryer hookup; Laundry located in a closet
Neighborhood map
What this means for you Summary
Snapshot
- This is a 3-bed/1.0-bath single-family listed at $130k.
Deal economics
- At list price, monthly cash flow is $168 ($2k/yr) — positive.
- The deal already cash-flows at list — no discount required.
- To meet the 1% rule (rent ≥ 1% of price), the offer needs to be $122k (6.0% below list).
- Recommended offer: $122k (6.0% below list) — sets the bar for 1% rule.
- Cap rate 7.8% vs local median 6.2% in Birmingham — meaningfully above typical; check what's discounted (condition, days-on-market, listing class) to confirm the premium yield is real.
Location & tenants
- Location reads 67/100 on livability (#78 in AL) — a middle-class / working-renter tenant base. Strengths: commute A+, cost of living A+, housing A+; Watch: amenities C-, crime F, employment F.
- Birmingham City (urban): math 4% / reading 20% proficiency, ranked #116 of 129 in AL (top 90%) — low school quality limits family demand, transient renter base, plan for 1-2y turnover; 82% free/reduced lunch — lower-income household profile, screen leases tightly.
- Zoned schools: Hemphill Elementary School (math 5% / reading 24%, grade F, #508 of 627 statewide, top 84%, 336 students, 87% FRL); Wenonah High School (math 2% / reading 2%, grade F, #291 of 305 statewide, top 100%, 656 students, 85% FRL) — zoned schools at 86% FRL track the district average.
- Market conditions: Rents soft (-0.0%/yr); 152 active listings in the ZIP; 40 comparable units currently listed for rent nearby; rentals at typical pace (median 24d on market — plan ~3-4 weeks tenant-placement turnaround); 48% of comp listings sitting > 30 days — soft ceiling on asking rent; lower-income renter base — watch delinquency; 2,114 units permitted in Jefferson County in 2024 (556 in 5+ unit buildings).
- This rent runs 42% of the median local income ($35k/yr) — at the standard rent-burdened threshold; future hikes will face affordability resistance.
Forward outlook
- Local home prices are declining (-3.0%/yr); year-one equity from $899 of loan paydown is wiped out by about $4k of value loss. Plan a longer hold.
- Jefferson County population projected to shrink 4% by 2050 — rents likely to lag national; underwrite the cash flow, not the appreciation.
Negotiation context
- Only 3 days on market — expect competitive offers; lowballing is unlikely to land.
- Current owner paid $40k; list at $130k implies a 225% gain — meaningful room to come down on a strong offer.
Risks & watch-outs
- Watch-outs: built in 1945 — expect roof / HVAC / electrical / plumbing capex.
- Climate carrying-cost: major wind risk, 27% chance of damaging wind over 30y; extreme-heat days projected 7→19/yr by 2055 (HVAC capex compounding) — expect insurance premiums to compound above CPI over the hold.
Questions for the listing agent
- Built in 1945 — when were the roof, HVAC, electrical panel, plumbing, and water heater last replaced?
- Is there a deadline driving the sale (1031 exchange, divorce, estate, relocation)? That informs how much negotiation room exists.
- Schools are F-rated, which usually means shorter tenancies and higher turnover. Who's the typical renter profile here, and what's been the actual vacancy rate?
- Crime grade is F in this area — have there been break-ins, vandalism, or insurance claims at this property in the last 3 years? What carrier currently insures it and at what premium?
- The area grade is low — what's the realistic commute time and amenity access for the typical tenant pool here? Any planned neighborhood developments (good or bad) we should know about?
- What's the average days-on-market for RENTAL listings here right now (not sales)? A rising rental-DOM trend means longer vacancies and softer asking-rent achievability than the comps imply.
- What's the recent tenant-quality profile in this submarket — average credit score on applications, eviction rate, late-payment / NSF rate, and stable-employment percentage? A property-management company in the area should have these aggregated.
- How much new for-sale + rental construction is in the pipeline within 1–3 miles? Heavy new supply typically softens prices + rents 12–24 months out; constrained supply supports both.
Investment metrics
- 1% rule
- 0.94% ✗
- Cap rate
- 7.85%
- Cash-on-cash
- 5.55%
- DSCR
- 1.25
- GRM
- 8.9
CMA / ARV
- ARV (on-the-fly)
- $97,440
- Comps found
- 12
Show comp detail 12 sales within ~0.75 mi
| Address | Dist | Beds/Ba | Sqft | Sold | Price | $/sf | Match |
|---|---|---|---|---|---|---|---|
| 1257 16th Pl SW | 0.15mi | 3/1.0 | 1,036 (-8%) | 15mo | $40,000 | $39 | 68 |
| 1744 Lincoln Pl SW | 0.63mi | 3/1.0 | 1,140 (+2%) | 1mo | $99,000 | $87 | 67 |
| 1245 15th St SW | 0.29mi | 3/1.0 | 1,002 (-10%) | 6mo | $12,500 | $12 | 64 |
| 600 Pride Way SW | 0.54mi | 3/1.0 | 1,191 (+6%) | 6mo | $80,000 | $67 | 60 |
| 700 18th Place Ln SW | 0.68mi | 3/2.0 | 1,152 (+3%) | 3mo | $100,833 | $88 | 57 |
| 1516 16th Way SW | 0.50mi | 3/1.0 | 1,038 (-7%) | 9mo | $125,000 | $120 | 57 |
| 1527 14th St | 0.66mi | 3/2.0 | 1,088 (-3%) | 5mo | $105,000 | $97 | 56 |
| 1651 Waco Ave SW | 0.51mi | 4/1.0 (+1) | 1,153 (+3%) | 12mo | $65,000 | $56 | 56 |
| 704 18th Way Ln SW | 0.73mi | 3/2.0 | 1,128 (+1%) | 13mo | $119,900 | $106 | 50 |
| 540 Francis St SW | 0.59mi | 3/2.0 | 1,225 (+9%) | 4mo | $82,500 | $67 | 50 |
| 722 SW 18th Pl | 0.63mi | 3/1.0 | 1,204 (+8%) | 12mo | $30,000 | $25 | 48 |
| 1501 Princeton Ave SW | 0.58mi | 3/2.0 | 1,260 (+12%) | 14mo | $129,900 | $103 | 37 |
Match score weights: distance 35% · size 25% · config 20% · recency 20%. Top-matched comps best support the ARV.
Projected returns pro-forma
-3.0% appreciation · 0.0% rent growth · sell at horizon
- IRR
- -10.8%
- Equity multiple
- 0.62×
- Total profit
- $-13,962
- Equity at exit
- $19,383
- IRR
- -6.0%
- Equity multiple
- 0.66×
- Total profit
- $-12,361
- Equity at exit
- $11,240
Cash invested: $36,400 (down + closing). Projections, not guarantees.
Landlord ↔ Tenant lean methodology
- Overall (STATE)
- 90 Strongly Landlord-Friendly
- State Alabama
- 90 Strongly Landlord-Friendly · R+15
- County
- — inherits STATE
- City
- — inherits STATE
ZIP-level market 35211
- Rents YoY
- -0.0%
- Active inventory
- 152
- Price-to-rent
- 8.9×
Monthly cashflow live
- Estimated rent
- $1,222 high interval (Pro) →
- Mortgage (P&I)
- −$682
- Tax from tax record
- −$61 /mo · $732/yr
- Insurance
- −$54
- HOA
- −$0
- Vacancy / Maint / Mgmt
- −$257
- Net cashflow
- $168
Break-even live
UW: 25.0% down · 7.5% · 30yr · 1.5% tax · 5.0% vac · 8.0% maint · 8.0% mgmt
Financing live
Cash to close
- Down payment
- $32,500
- Closing costs
- $3,900
- Reserves months
- —
- Total cash needed
- —
Loan-product check · same deal, 3 products live
Conventional
25% down · 7.5% · 30yr
- Down + closing
- —
- Monthly P&I
- —
- Monthly cashflow
- —
- DSCR
- —
- Eligible?
- —
Personal DTI + credit; lowest rate.
DSCR
20% down · 8.5% · 30yr
- Down + closing
- —
- Monthly P&I
- —
- Monthly cashflow
- —
- DSCR
- —
- Eligible?
- —
No personal income docs; deal must DSCR.
Hard money
10% down · 12.0% · 12mo
- Down + closing
- —
- Monthly P&I
- —
- Monthly cashflow
- —
- DSCR
- —
- Eligible?
- —
Short-term bridge; refi at stabilization.
Rent comps 40 comps
| Address | Beds | Baths | Sqft | Rent | $/sqft | DOM | Units | Dist |
|---|---|---|---|---|---|---|---|---|
| 1620 Alemeda Ave SW Birmingham, AL | 3.0 | 2.0 | 1314 | $1,295 | $0.99 | 2d | 1 | 0.11mi |
| 1233 15th Way SW Birmingham, AL | 3.0 | 1.0 | 1119 | $1,050 | $0.94 | 43d | 1 | 0.15mi |
| 1136 15th St SW Birmingham, AL | 4.0 | 2.0 | 1296 | $1,395 | $1.08 | 23d | 1 | 0.17mi |
| 1256 15th St SW Birmingham, AL | 3.0 | 1.0 | 1206 | $1,300 | $1.08 | 3d | 1 | 0.27mi |
| 1332 15th Pl SW Birmingham, AL | 2.0 | 1.0 | 1115 | $950 | $0.85 | 3d | 1 | 0.31mi |
| 916 14th St SW Unit F Birmingham, AL | 2.0 | 1.0 | 870 | $800 | $0.92 | 43d | 1 | 0.38mi |
| 916 14th St SW Unit F Birmingham, AL | 2.0 | 1.0 | 800 | $800 | $1.00 | 11d | 1 | 0.38mi |
| 916 14th St SW Unit A Birmingham, AL | 2.0 | 1.0 | 870 | $800 | $0.92 | 23d | 1 | 0.38mi |
| 1000 17th Pl SW Birmingham, AL | 3.0 | 2.0 | 1200 | $1,275 | $1.06 | 19d | 1 | 0.38mi |
| 1508 Dennison Ave SW Birmingham, AL | 2.0 | 1.0 | 924 | $890 | $0.96 | 43d | 1 | 0.42mi |
| 1501 Princeton Ave SW Birmingham, AL | 3.0 | 2.0 | 1260 | $1,350 | $1.07 | 44d | 1 | 0.56mi |
| 521 16th St SW Unit 523 Birmingham, AL | 2.0 | 1.0 | 800 | $800 | $1.00 | 43d | 1 | 0.57mi |
| 1734 Lee Ave SW Birmingham, AL | 4.0 | 1.0 | 1142 | $1,150 | $1.01 | 19d | 1 | 0.58mi |
| 1728 Princeton Ave SW Birmingham, AL | 4.0 | 2.0 | 1334 | $1,300 | $0.97 | 43d | 1 | 0.63mi |
| 1816 Saint Charles Ave SW Birmingham, AL | 3.0 | 1.0 | 1395 | $1,295 | $0.93 | 23d | 1 | 0.74mi |
| 1645 Woodland Ave SW Birmingham, AL | 4.0 | 2.0 | 1298 | $1,300 | $1.00 | 19d | 1 | 0.79mi |
| 1100 Cotton Ave SW Unit b Birmingham, AL | 2.0 | 1.5 | 816 | $988 | $1.21 | 43d | 1 | 0.79mi |
| 1217 Fulton Ave SW Birmingham, AL | 4.0 | 2.0 | 1397 | $1,395 | $1.00 | 43d | 1 | 0.80mi |
| 1228 Fulton Ave SW Birmingham, AL | 2.0 | 1.0 | 900 | $800 | $0.89 | 44d | 1 | 0.81mi |
| 1437 Woodland Ave SW Birmingham, AL | 3.0 | 1.0 | 1369 | $1,100 | $0.80 | 3d | 1 | 0.82mi |
| 1252 18th Pl SW Birmingham, AL | 3.0 | 1.0 | 950 | $1,000 | $1.05 | 16d | 1 | 0.84mi |
| 1012 Cotton Ave SW Birmingham, AL | 3.0 | 1.0 | 1232 | $1,000 | $0.81 | 43d | 1 | 0.84mi |
| 1800 Woodland Ave SW Birmingham, AL | 4.0 | 1.0 | 1411 | $1,195 | $0.85 | 2d | 1 | 0.85mi |
| 1220 Alabama Ave SW Birmingham, AL | 3.0 | 1.5 | 1175 | $1,350 | $1.15 | 43d | 1 | 0.89mi |
| 1319 18th Way SW Birmingham, AL | 4.0 | 2.0 | 1337 | $1,345 | $1.01 | 23d | 1 | 0.90mi |
| 132 17th St SW Birmingham, AL | 2.0 | 1.0 | 738 | $945 | $1.28 | 43d | 1 | 0.92mi |
| 1520 17th Way SW Birmingham, AL | 3.0 | 1.0 | 900 | $900 | $1.00 | 11d | 1 | 0.93mi |
| 1520 17th Way SW Birmingham, AL | 3.0 | 1.0 | 900 | $900 | $1.00 | 21d | 1 | 0.93mi |
| 914 21st St SW Birmingham, AL | 3.0 | 1.0 | 784 | $1,200 | $1.53 | 21d | 1 | 0.95mi |
| 1209 19th Pl SW Birmingham, AL | 3.0 | 1.0 | 1050 | $1,275 | $1.21 | 43d | 1 | 0.98mi |
| 405 11th St SW Unit B Birmingham, AL | 2.0 | 1.0 | 1065 | $800 | $0.75 | 43d | 1 | 0.98mi |
| 2028 Lee Ter SW Birmingham, AL | 2.0 | 1.0 | 884 | $695 | $0.79 | 43d | 1 | 1.00mi |
| 2026 Lee Ct SW Birmingham, AL | 3.0 | 1.0 | 1204 | $1,100 | $0.91 | 43d | 1 | 1.01mi |
| 1228 19th Pl SW Birmingham, AL | 3.0 | 2.0 | 978 | $1,195 | $1.22 | 3d | 1 | 1.03mi |
| 1537 18th St SW Birmingham, AL | 3.0 | 1.0 | 1049 | $1,130 | $1.08 | 43d | 1 | 1.03mi |
| 1933 Saint Charles Ct SW Birmingham, AL | 3.0 | 1.0 | 1106 | $1,050 | $0.95 | 23d | 1 | 1.05mi |
| 2216 Lee Ave SW Birmingham, AL | 3.0 | 1.0 | 902 | $900 | $1.00 | 23d | 1 | 1.06mi |
| 1544 18th St SW Birmingham, AL | 3.0 | 1.0 | 950 | $1,130 | $1.19 | 43d | 1 | 1.06mi |
| 208 22nd St SW Birmingham, AL | 2.0 | 1.0 | 926 | $1,050 | $1.13 | 3d | 1 | 1.09mi |
| 407 S Park Rd SW Birmingham, AL | 3.0 | 1.0 | 1050 | $900 | $0.86 | 43d | 1 | 1.12mi |
Listing history 4 events
-
2026-06-18days on market $130,000 Coming Soon 3 DOM
-
2026-06-17days on market $130,000 Coming Soon 2 DOM
-
2026-06-16remarks 699-char remark
-
2026-06-16$130,000 Coming Soon 1 DOM
ⓘ Source: listings_history table (triggers on properties + properties_extension) + one-shot
backfill from property_details.listing_events for pre-trigger history.
Tax reassessment forecast AL · Resets to sale price
- Current annual tax
- $732 · $61/mo
- Projected year-2 tax
- $732 · $61/mo
- Expected delta
- $0/yr ($0/mo · 0.0%)
ⓘ Screening estimate from a state-policy table — verify with the county assessor before closing.
Climate risk First Street
- Flood 1/10 Low FEMA zone X (unshaded) · 0% chance over 30 yrs
- Wildfire 1/10 Low
- Heat 6/10 Major 7 d/yr ≥106°F today · 19 d/yr by 30 yrs out
- Wind 6/10 Major 27% chance of damaging wind over 30 yrs
- Air quality 4/10 Moderate 5 unhealthy d/yr today · 5 by 30 yrs out
Nearby sold comps map
Loading sold comps map…
Walkable amenities ~0.75 mi
Loading nearby amenities…
Taxation est. · year 1
- Rental income
- $14,664
- − Mortgage interest
- −$7,282
- − Property taxes
- −$732
- − Insurance
- −$650
- − Repairs & maintenance
- −$1,173
- − Management
- −$1,173
- − Depreciation
- −$3,782
- Taxable loss
- −$128
- Est. tax savings @ 24.0%
- +$31
- After-tax cash flow
- $2,052/yr
For passive investors: Depreciation is non-cash, so a rental often shows a tax loss while cash-flowing — sheltering income. Rental losses are passive: they offset passive income freely, and up to $25,000/yr can offset ordinary (W-2) income if you actively participate and your MAGI is under $100k (phasing out to $0 by $150k); unused losses carry forward. On sale, claimed depreciation is recaptured at up to 25%, and gains may owe capital-gains tax (a 1031 exchange can defer both). Figures are a year-1 estimate at your 24.0% rate — not tax advice; consult a CPA.
Schools (NCES district)
- District
- Birmingham City
- NCES district ID
- 0100390
- Math proficiency
- 4% ▼ -17.00%
- Reading proficiency
- 20% ▼ -4.00%
- Median HH income
- $31,988
- Composite
- 9.49/100
- National rank
- #9850
- State rank
- #116 of 129 in AL
Livability — Birmingham
- Score
- 67/100
- State rank
- #78
- US rank
- #10412
Category grades
Schools grade is shown separately in the Schools card above.
Census & demographics
- Census place
- Birmingham, AL
- County
- Jefferson County · 527,445 people
- City population
- 210,422
- Metro
- Birmingham-Hoover, AL
- Population (ZIP)
- 24,924
- Household income
- $34,884
- Rent vs Own
- Severe rent burden
- 2161.0
Population outlook (Jefferson County) Hauer SSP2
- Today (2025)
- 669,185 people
- By 2030
- 669,694 · +0.1%
- By 2040
- 661,388 · -1.2%
- By 2050
- 643,086 · -3.9%
- By 2075
- 577,267 · -13.7%
- By 2100
- 474,758 · -29.1%
Race, ethnicity, and origin ACS 2023
- Neighborhood character
- Predominantly Black (77%)
- Race & ethnicity
- Black 77% White 10% Hispanic / Latino 10% Two or more races 4%
- Hispanic origin (detail)
- Mexican 7%
- Foreign-born
- 6% · Canada
- Languages at home
- 91% English-only · Spanish 8% French/Haitian/Cajun 1%
Political lean MEDSL · Jefferson
- 2024 margin
- D (+10.4) · D 54.6% · R 44.2% · Other 1.2%
- 2008→2024 swing
- +5.4pp toward D · 2008: 5.1pp · 2024: 10.4pp
- All cycles
- 2024: D+10.4 2020: D+13.2 2016: D+7.2 2012: D+6.0 2008: D+5.1
Not yet ingested
- Civics
- —
Market trends
- HPI YoY
- ▼ -49.29%
- Current HPI
- 91.2903
- Rent YoY
- ▬ -0.01%
- Metro
- Birmingham-Hoover, AL
- State GDP YoY
- ▲ 2.94%
- F500 in state
- 4
Industry mix (Fortune 500 HQ in AL)
| Industry | F500 HQs | Revenue |
|---|---|---|
| Financial Services | 1 | $8B |
|
||
| Healthcare | 1 | $5B |
|
||
Price history
+233.3% since first listed7 events — show timeline
- 2026-06-16 Coming Soon $130,000 Greater Alabama MLS
- 2025-06-13 Price Changed $158,000 Greater Alabama MLS
- 2023-08-02 Sold (MLS) $40,000 Greater Alabama MLS
- 2023-07-18 Pending — Greater Alabama MLS
- 2023-06-21 Contingent — Greater Alabama MLS
- 2023-06-08 Price Changed $29,500 Greater Alabama MLS
- 2023-05-04 Listed $39,000 Greater Alabama MLS
Property tax history
+11.3%/yrLatest (2025): $732 · +0.8% YoY. Source: county tax records.
Cash-flow waterfall
monthlySold comps — $/sqft
last 12 mo · ≤1 miLoading sold comps…