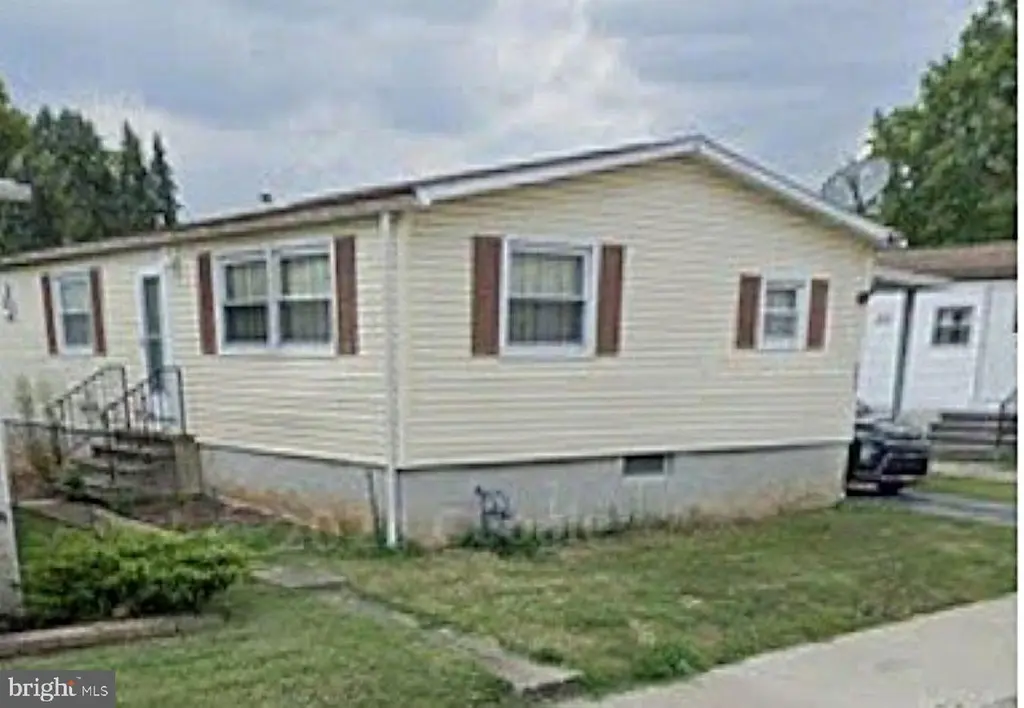
303 W Walnut St · Hanover, PA
Flood risk 1/10 · Minimal
- FEMA flood zone
- X (unshaded)
- Chance of flooding over 30 yrs
- 0.0%
- Est. flood insurance / yr
- $473 – $860
Fire risk 1/10 · Minimal
- Est. fire insurance / yr
- $511 – $949
Heat risk 6/10 · Moderate
- Hot days now (above 102°F)
- 7 days/yr
- Hot days in 30 yrs
- 15 days/yr
Wind risk 3/10 · Minor
- Chance of severe wind over 30 yrs
- 7.0%
Air-quality risk 2/10 · Minimal
- Unhealthy air days now
- 1 days/yr
- Unhealthy air days in 30 yrs
- 3 days/yr
Risk factors via First Street. Map © Google.
Why this score? — see what drove the B- grade
The composite is a weighted blend of 9 inputs, each scored 0–100. Each bar is that input's sub-score; the figure is the points it added to the 100-point composite (weight × sub-score).
- Cash flow +26.5/30.0
- 1% rule +9.5/10.0
- DSCR +9.0/10.0
- ARV discount +7.5/15.0
- Livability +3.8/5.0
- Rent growth +3.7/5.0
- Schools +3.7/10.0
- Condition / age +2.5/5.0
- Appreciation +0.0/10.0
$95,000
🖨 Deal sheet 📄 Offer letter ✓ Due diligence
Listing remarks MLS
Cozy 3 bedroom 1 1/2 bath rancher in quiet neighborhood- newer carpet in LR and FR - new paint in kitchen and bedrooms- 5 year old roof- full basement with outside entrance.
Key facts
- 4,282 sq ft lot
- Built 1983
Neighborhood map
What this means for you Summary
Snapshot
- This is a 3-bed/1.0-bath single-family listed at $95k.
Deal economics
- At list price, monthly cash flow is $251 ($3k/yr) — positive.
- The deal already cash-flows at list — no discount required.
- Meets the 1% rule at list price ($1k rent vs $95k).
- Cap rate 9.5% vs local median 3.9% in Hanover — top-decile yield for the area; either an underpriced asset or a hidden risk that comps aren't pricing in. Stress-test before assuming the spread holds.
Location & tenants
- Location reads 76/100 on livability (#373 in PA, #3,295 nationally) — a middle-class / working-renter tenant base. Strengths: cost of living A+, housing A+, health & safety A+; Watch: amenities C-, employment D, commute F.
- Hanover Public SD (urban): math 34% / reading 54% proficiency, ranked #294 of 539 in PA (top 54%) — families likely to look elsewhere, expect single-tenant / working-renter base with shorter leases.
- Market conditions: Rents rising fast (+4.7%/yr); 386 active listings in the ZIP; 15 comparable units currently listed for rent nearby; rentals at typical pace (median 21d on market — plan ~3-4 weeks tenant-placement turnaround); solid renter incomes; 1,328 units permitted in York County in 2024 (338 in 5+ unit buildings).
Forward outlook
- Local home prices are declining (-3.0%/yr); year-one equity from $657 of loan paydown is wiped out by about $3k of value loss. Plan a longer hold.
- At projected returns (-3.0% appreciation + 4.7% rent growth), your $27k cash investment doubles in ~9 years — after that, you're playing with house money.
Negotiation context
- Only 0 days on market — expect competitive offers; lowballing is unlikely to land.
- 4 sale attempts since 20y ago with the ask held roughly flat each time — persistent listings suggest the price (not the market) is what's stuck; bring a comps-based counter.
Risks & watch-outs
- Watch-outs: property tax is 3.7% of price.
- Climate carrying-cost: extreme-heat days projected 7→15/yr by 2055 (HVAC capex compounding) — expect insurance premiums to compound above CPI over the hold.
Questions for the listing agent
- Property tax is high relative to price — has the assessment been appealed recently, and will the sale trigger a re-assessment?
- Is there a deadline driving the sale (1031 exchange, divorce, estate, relocation)? That informs how much negotiation room exists.
- What's the average days-on-market for RENTAL listings here right now (not sales)? A rising rental-DOM trend means longer vacancies and softer asking-rent achievability than the comps imply.
- What's the recent tenant-quality profile in this submarket — average credit score on applications, eviction rate, late-payment / NSF rate, and stable-employment percentage? A property-management company in the area should have these aggregated.
- How much new for-sale + rental construction is in the pipeline within 1–3 miles? Heavy new supply typically softens prices + rents 12–24 months out; constrained supply supports both.
Investment metrics
- 1% rule
- 1.45% ✓
- Cap rate
- 9.46%
- Cash-on-cash
- 11.32%
- DSCR
- 1.50
- GRM
- 5.8
CMA / ARV
- ARV (on-the-fly)
- $225,792
- Comps found
- 12
Show comp detail 12 sales within ~0.75 mi
| Address | Dist | Beds/Ba | Sqft | Sold | Price | $/sf | Match |
|---|---|---|---|---|---|---|---|
| 303 W Walnut St | 0.00mi | 3/1.0 | 1,152 (0%) | 0mo | $95,000 | $82 | 100 |
| 77 2nd Ave | 0.01mi | 3/2.0 | 1,152 (0%) | 2mo | $185,000 | $161 | 94 |
| 832 Hartman Ave | 0.64mi | 3/1.0 | 1,134 (-2%) | 0mo | $251,000 | $221 | 67 |
| 15 Westminster Ave | 0.49mi | 3/2.0 | 1,104 (-4%) | 3mo | $221,000 | $200 | 64 |
| 541 S Franklin St | 0.64mi | 3/1.0 | 1,124 (-2%) | 6mo | $220,000 | $196 | 61 |
| 221 Locust St | 0.49mi | 2/1.0 (-1) | 1,176 (+2%) | 9mo | $200,000 | $170 | 61 |
| 3 Sprenkle Ave | 0.48mi | 3/2.0 | 1,232 (+7%) | 1mo | $250,000 | $203 | 61 |
| 538 York St | 0.74mi | 3/1.5 | 1,237 (+7%) | 1mo | $245,000 | $198 | 51 |
| 254 Princess St | 0.71mi | 3/1.0 | 1,238 (+8%) | 7mo | $236,000 | $191 | 48 |
| 47 Sprenkle Ave | 0.60mi | 2/1.0 (-1) | 1,260 (+9%) | 6mo | $215,000 | $171 | 46 |
| 522 S High St | 0.67mi | 3/1.0 | 988 (-14%) | 2mo | $244,900 | $248 | 43 |
| 324 E Pleasant St | 0.70mi | 2/1.5 (-1) | 1,294 (+12%) | 6mo | $235,000 | $182 | 34 |
Match score weights: distance 35% · size 25% · config 20% · recency 20%. Top-matched comps best support the ARV.
Projected returns pro-forma
-3.0% appreciation · 4.67% rent growth · sell at horizon
- IRR
- 2.9%
- Equity multiple
- 1.12×
- Total profit
- $3,068
- Equity at exit
- $14,165
- IRR
- 14.4%
- Equity multiple
- 2.27×
- Total profit
- $33,749
- Equity at exit
- $8,214
Cash invested: $26,600 (down + closing). Projections, not guarantees.
Landlord ↔ Tenant lean methodology
- Overall (STATE)
- 62 Landlord-Friendly
- State Pennsylvania
- 62 Landlord-Friendly · EVEN
- County
- — inherits STATE
- City
- — inherits STATE
ZIP-level market 17331
- Home prices YoY
- -33.8%
- Rents YoY
- 4.7%
- Active inventory
- 386
- Price-to-rent
- 5.8×
Monthly cashflow live
- Estimated rent
- $1,374 high interval (Pro) →
- Mortgage (P&I)
- −$498
- Tax from tax record
- −$297 /mo · $3,560/yr
- Insurance
- −$40
- HOA
- −$0
- Vacancy / Maint / Mgmt
- −$289
- Net cashflow
- $251
Break-even live
UW: 25.0% down · 7.5% · 30yr · 1.5% tax · 5.0% vac · 8.0% maint · 8.0% mgmt
Financing live
Cash to close
- Down payment
- $23,750
- Closing costs
- $2,850
- Reserves months
- —
- Total cash needed
- —
Loan-product check · same deal, 3 products live
Conventional
25% down · 7.5% · 30yr
- Down + closing
- —
- Monthly P&I
- —
- Monthly cashflow
- —
- DSCR
- —
- Eligible?
- —
Personal DTI + credit; lowest rate.
DSCR
20% down · 8.5% · 30yr
- Down + closing
- —
- Monthly P&I
- —
- Monthly cashflow
- —
- DSCR
- —
- Eligible?
- —
No personal income docs; deal must DSCR.
Hard money
10% down · 12.0% · 12mo
- Down + closing
- —
- Monthly P&I
- —
- Monthly cashflow
- —
- DSCR
- —
- Eligible?
- —
Short-term bridge; refi at stabilization.
Rent comps 15 comps
| Address | Beds | Baths | Sqft | Rent | $/sqft | DOM | Units | Dist |
|---|---|---|---|---|---|---|---|---|
| 261 N Franklin St Unit 302 Hanover, PA | 3.0 | 2.0 | 1398 | $1,130 | $0.81 | 43d | 1 | 0.43mi |
| 261 N Franklin St Unit 212 Hanover, PA | 2.0 | 1.0 | 1187 | $1,139 | $0.96 | 21d | 1 | 0.43mi |
| 342 E Walnut St Unit 29 Hanover, PA | 2.0 | 1.0 | 700 | $945 | $1.35 | 21d | 1 | 0.64mi |
| 514 Broadway Unit 1st Floor Hanover, PA | 2.0 | 1.0 | 1130 | $1,320 | $1.17 | 13d | 1 | 0.73mi |
| 11 Penn St Unit 2nd Fl Hanover, PA | 2.0 | 1.0 | 1000 | $1,050 | $1.05 | 13d | 1 | 0.80mi |
| 285 South St Hanover, PA | 3.0 | 1.5 | 1000 | $1,350 | $1.35 | 13d | 1 | 1.03mi |
| 807 W Alvin St Unit 835 Hanover, PA | 2.0 | 1.0 | 700 | $1,000 | $1.43 | 21d | 1 | 1.19mi |
| 807 W Alvin St Hanover, PA | 1.0–2.0 | 1.0 | 625 | $1,000 | $1.60 | 13d | 2 | 1.19mi |
| 607 3rd St Hanover, PA | 3.0 | 1.0 | 1276 | $1,400 | $1.10 | 21d | 1 | 1.20mi |
| 612 Maple Ave Hanover, PA | 2.0 | 2.0 | 900 | $1,295 | $1.44 | 13d | 1 | 1.27mi |
| 203 W Clearview Rd Hanover, PA | 1.0–2.0 | 1.0 | 844 | $1,660 | $1.97 | 13d | 14 | 1.29mi |
| 125 Grant Dr Hanover, PA | 3.0 | 2.0 | 780 | $1,445 | $1.85 | 21d | 1 | 1.36mi |
| 101 Pacer Dr Unit M Hanover, PA | 3.0 | 2.5 | 1252 | $1,751 | $1.40 | 43d | 1 | 1.39mi |
| 101 Pacer Dr Unit L Hanover, PA | 3.0 | 2.5 | 1252 | $1,901 | $1.52 | 13d | 1 | 1.39mi |
| 101 Pacer Dr Unit K Hanover, PA | 3.0 | 2.5 | 1252 | $1,846 | $1.47 | 43d | 1 | 1.39mi |
Listing history 11 events
-
2026-05-14$95,000
-
2026-05-14historical
-
2008-05-09soldstatus $119,900
-
2008-03-25soldstatus $119,900 173-char remark
Show marketing remark (173 chars)
Cozy 3 bedroom 1 1/2 bath rancher in quiet neighborhood- newer carpet in LR and FR - new paint in kitchen and bedrooms- 5 year old roof- full basement with outside entrance.
-
2008-02-08historical 173-char remark
Show marketing remark (173 chars)
Cozy 3 bedroom 1 1/2 bath rancher in quiet neighborhood- newer carpet in LR and FR - new paint in kitchen and bedrooms- 5 year old roof- full basement with outside entrance.
-
2007-09-15$129,900 173-char remark
Show marketing remark (173 chars)
Cozy 3 bedroom 1 1/2 bath rancher in quiet neighborhood- newer carpet in LR and FR - new paint in kitchen and bedrooms- 5 year old roof- full basement with outside entrance.
-
2006-10-19historical
-
2006-07-19$139,995
-
2006-07-17historical
-
2006-04-17$144,900
-
1988-02-04soldstatus $45,900
ⓘ Source: listings_history table (triggers on properties + properties_extension) + one-shot
backfill from property_details.listing_events for pre-trigger history.
Tax reassessment forecast PA · Partial reset (capped growth)
- Current annual tax
- $3,560 · $297/mo
- Projected year-2 tax
- $3,560 · $297/mo
- Expected delta
- $0/yr ($0/mo · 0.0%)
ⓘ Screening estimate from a state-policy table — verify with the county assessor before closing.
Climate risk First Street
- Flood 1/10 Low FEMA zone X (unshaded) · 0% chance over 30 yrs
- Wildfire 1/10 Low
- Heat 6/10 Major 7 d/yr ≥102°F today · 15 d/yr by 30 yrs out
- Wind 3/10 Moderate 7% chance of damaging wind over 30 yrs
- Air quality 2/10 Low 1 unhealthy d/yr today · 3 by 30 yrs out
Nearby sold comps map
Loading sold comps map…
Walkable amenities ~0.75 mi
Loading nearby amenities…
Taxation est. · year 1
- Rental income
- $16,488
- − Mortgage interest
- −$5,321
- − Property taxes
- −$3,560
- − Insurance
- −$475
- − Repairs & maintenance
- −$1,319
- − Management
- −$1,319
- − Depreciation
- −$2,764
- Taxable income
- $1,729
- Est. tax owed @ 24.0%
- −$415
- After-tax cash flow
- $2,597/yr
For passive investors: Depreciation is non-cash, so a rental often shows a tax loss while cash-flowing — sheltering income. Rental losses are passive: they offset passive income freely, and up to $25,000/yr can offset ordinary (W-2) income if you actively participate and your MAGI is under $100k (phasing out to $0 by $150k); unused losses carry forward. On sale, claimed depreciation is recaptured at up to 25%, and gains may owe capital-gains tax (a 1031 exchange can defer both). Figures are a year-1 estimate at your 24.0% rate — not tax advice; consult a CPA.
Schools (NCES district)
- District
- Hanover Public SD
- NCES district ID
- 4211450
- Math proficiency
- 34% ▼ -11.00%
- Reading proficiency
- 54% ▼ -8.00%
- Median HH income
- $45,022
- Composite
- 37.26/100
- National rank
- #4457
- State rank
- #294 of 539 in PA
Livability — Hanover
- Score
- 76/100
- State rank
- #373
- US rank
- #3295
Category grades
Schools grade is shown separately in the Schools card above.
Census & demographics
- Census place
- Hanover, PA
- County
- York County · 278,806 people
- City population
- 56,443
- Metro
- York-Hanover, PA
- Population (ZIP)
- 56,443
- Household income
- $79,488
- Rent vs Own
- Severe rent burden
- 1076.0
Population outlook (York County) Hauer SSP2
- Today (2025)
- 454,205 people
- By 2030
- 457,407 · +0.7%
- By 2040
- 457,529 · +0.7%
- By 2050
- 448,261 · -1.3%
- By 2075
- 427,388 · -5.9%
- By 2100
- 384,218 · -15.4%
Race, ethnicity, and origin ACS 2023
- Neighborhood character
- Predominantly White (86%)
- Race & ethnicity
- White 86% Hispanic / Latino 7% Two or more races 7% Black 3% Asian 1%
- Hispanic origin (detail)
- Mexican 3% Puerto Rican 2%
- Common ancestry
- Romanian 3% Lithuanian 2% Slovak 2%
- Foreign-born
- 4% · Canada
- Languages at home
- 95% English-only · Spanish 3%
Political lean MEDSL · York
- 2024 margin
- Strong R (+25.3) · D 36.9% · R 62.1%
- 2008→2024 swing
- -11.7pp toward R · 2008: -13.6pp · 2024: -25.3pp
- All cycles
- 2024: R+25.3 2020: R+24.6 2016: R+29.3 2012: R+21.2 2008: R+13.6
Not yet ingested
- Civics
- —
Market trends
- HPI YoY
- ▼ -128.48%
- Current HPI
- 251.8974
- Rent YoY
- ▲ 4.67%
- Metro
- York-Hanover, PA
- State GDP YoY
- ▲ 1.68%
- F500 in state
- 34
Industry mix (Fortune 500 HQ in PA)
| Industry | F500 HQs | Revenue |
|---|---|---|
| Healthcare | 2 | $309B |
|
||
| Insurance | 2 | $27B |
|
||
| Telecommunications / Media | 1 | $124B |
|
||
| Industrial Distribution | 1 | $22B |
|
||
| Financial Services | 1 | $20B |
|
||
| Chemicals / Materials | 1 | $18B |
|
||
Price history
+107.0% since first listed11 events — show timeline
- 2026-05-14 Listing Removed — BRIGHT MLS
- 2026-05-14 Listed $95,000 BRIGHT MLS
- 2008-05-09 Sold (Public Records) $119,900 Public Records
- 2008-03-25 Sold (MLS) $119,900 BRIGHT MLS
- 2008-02-08 Listing Removed — BRIGHT MLS
- 2007-09-15 Listed $129,900 BRIGHT MLS
- 2006-10-19 Listing Removed — BRIGHT MLS
- 2006-07-19 Listed $139,995 BRIGHT MLS
- 2006-07-17 Listing Removed — BRIGHT MLS
- 2006-04-17 Listed $144,900 BRIGHT MLS
- 1988-02-04 Sold (Public Records) $45,900 Public Records
Property tax history
+1.9%/yrLatest (2025): $3,560 · +0.8% YoY. Source: county tax records.
Cash-flow waterfall
monthlySold comps — $/sqft
last 12 mo · ≤1 miLoading sold comps…