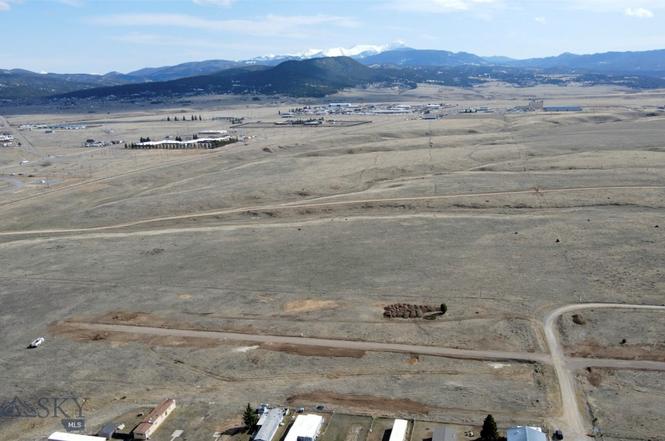
TBD S Warren Ave Lot 20-28B · Butte-Silver Bow (balance), MT
Flood risk 3/10 · Minor
- FEMA flood zone
- X (unshaded)
- Chance of flooding over 30 yrs
- 0.2%
- Est. flood insurance / yr
- $507 – $1,088
Fire risk 6/10 · Moderate
- Est. fire insurance / yr
- $918 – $1,706
Heat risk 2/10 · Minimal
- Hot days now (above 86°F)
- 7 days/yr
- Hot days in 30 yrs
- 18 days/yr
Wind risk 1/10 · Minimal
- Chance of severe wind over 30 yrs
- —
Air-quality risk 8/10 · Major
- Unhealthy air days now
- 13 days/yr
- Unhealthy air days in 30 yrs
- 19 days/yr
Risk factors via First Street. Map © Google.
Why this score? — see what drove the B grade
The composite is a weighted blend of 9 inputs, each scored 0–100. Each bar is that input's sub-score; the figure is the points it added to the 100-point composite (weight × sub-score).
- Cash flow +30.0/30.0
- 1% rule +10.0/10.0
- DSCR +10.0/10.0
- ARV discount +7.5/15.0
- Rent growth +5.0/5.0
- Schools +3.1/10.0
- Livability +2.5/5.0
- Condition / age +2.5/5.0
- Appreciation +0.0/10.0
$95,000
🖨 Deal sheet 📄 Offer letter ✓ Due diligence
Key facts
- 1 acre lots
- Approved for well
- Approved for septic
Tags
Property features AI
Finance
- Other: Tax annual amount reported
Exterior
- Parking: Has garage; Garage door opener
- Utilities: Electricity available; Natural gas available
- Home design: Unimproved land; Zoned R2 (Residential Two-Household Medium Density)
- Exterior features: Property has a view; Directions: From Harrison — west on Motor View, south on S Warren; follow until you see signs. Property on the east side.
Interior
- Kitchen: Dishwasher; Microwave; Range; Refrigerator
- Flooring: Laminate
- Bathrooms: 2 full bathrooms
- Heating & cooling: Forced air heating (natural gas); Ceiling fan(s)
- Interior features: Vaulted ceilings; Walk-in closet(s)
Neighborhood map
What this means for you Summary
Snapshot
- This is a 3-bed/2.0-bath single-family listed at $95k.
Deal economics
- At list price, monthly cash flow is $599 ($7k/yr) — positive.
- The deal already cash-flows at list — no discount required.
- Meets the 1% rule at list price ($2k rent vs $95k).
- Recommended offer: $84k (12.0% below list) — sets the bar for market timing.
- Cap rate 13.9% vs local median 2.9% in Butte-Silver Bow (balance) — top-decile yield for the area; either an underpriced asset or a hidden risk that comps aren't pricing in. Stress-test before assuming the spread holds.
Location & tenants
- Location reads: area grade B — affects rentability + tenant quality, not the cash-flow math above.
- Butte H S (town): math 24% / reading 50% proficiency, ranked #73 of 116 in MT (top 63%) — families likely to look elsewhere, expect single-tenant / working-renter base with shorter leases.
- Market conditions: Rents rising fast (+10.4%/yr); 320 active listings in the ZIP; 109 units permitted in Silver Bow County in 2024 (25 in 5+ unit buildings).
- This rent runs 32% of the median local income ($60k/yr) — at the standard rent-burdened threshold; future hikes will face affordability resistance.
Forward outlook
- Local home prices are declining (-3.0%/yr); year-one equity from $657 of loan paydown is wiped out by about $3k of value loss. Plan a longer hold.
- Silver Bow County population projected at +8% by 2050 — modest demand growth; plan on rents tracking national, not racing it.
- At projected returns (-3.0% appreciation + 8.0% rent growth), your $27k cash investment doubles in ~4 years — after that, you're playing with house money.
Negotiation context
- It's been on market 332 days — a 12% lower offer ($84k) is reasonable based on typical stale-listing flexibility.
- 2 sale attempts with the ask held roughly flat each time — persistent listings suggest the price (not the market) is what's stuck; bring a comps-based counter.
Risks & watch-outs
- Climate carrying-cost: major wildfire risk — expect insurance premiums to compound above CPI over the hold.
Questions for the listing agent
- It's been on market 332 days. Have you received any prior offers? Is the seller open to a 12% concession, seller financing, or rate buy-down credit?
- Why hasn't it sold? Are there any deal-killer items the seller is aware of (foundation, flood, title, zoning, code violations)?
- Is there a deadline driving the sale (1031 exchange, divorce, estate, relocation)? That informs how much negotiation room exists.
- What's the average days-on-market for RENTAL listings here right now (not sales)? A rising rental-DOM trend means longer vacancies and softer asking-rent achievability than the comps imply.
- What's the recent tenant-quality profile in this submarket — average credit score on applications, eviction rate, late-payment / NSF rate, and stable-employment percentage? A property-management company in the area should have these aggregated.
- How much new for-sale + rental construction is in the pipeline within 1–3 miles? Heavy new supply typically softens prices + rents 12–24 months out; constrained supply supports both.
Investment metrics
- 1% rule
- 1.67% ✓
- Cap rate
- 13.85%
- Cash-on-cash
- 27.00%
- DSCR
- 2.20
- GRM
- 5.0
CMA / ARV
- ARV (on-the-fly)
- $331,200
- Comps found
- 3
Show comp detail 3 sales within ~0.75 mi
| Address | Dist | Beds/Ba | Sqft | Sold | Price | $/sf | Match |
|---|---|---|---|---|---|---|---|
| 1160 Water Line Rd | 0.41mi | 3/2.0 | 1,632 (+13%) | 3mo | $497,000 | $305 | 56 |
| 1351 Motor View Rd | 0.50mi | 3/2.0 | 1,560 (+8%) | 8mo | $359,000 | $230 | 56 |
| 1435 Sage St | 0.60mi | 2/2.0 (-1) | 1,296 (-10%) | 1mo | $295,000 | $228 | 49 |
Match score weights: distance 35% · size 25% · config 20% · recency 20%. Top-matched comps best support the ARV.
Projected returns pro-forma
-3.0% appreciation · 8.0% rent growth · sell at horizon
- IRR
- 26.5%
- Equity multiple
- 2.17×
- Total profit
- $31,147
- Equity at exit
- $14,165
- IRR
- 37.0%
- Equity multiple
- 5.31×
- Total profit
- $114,520
- Equity at exit
- $8,214
Cash invested: $26,600 (down + closing). Projections, not guarantees.
Landlord ↔ Tenant lean methodology
- Overall (STATE)
- 82 Strongly Landlord-Friendly
- State Montana
- 82 Strongly Landlord-Friendly · R+11
- County
- — inherits STATE
- City
- — inherits STATE
ZIP-level market 59701
- Home prices YoY
- -30.7%
- Rents YoY
- 10.4%
- Active inventory
- 320
- Price-to-rent
- 5.0×
Monthly cashflow live
- Estimated rent
- $1,589 medium interval (Pro) →
- Mortgage (P&I)
- −$498
- Tax est. 1.5%
- −$119 /mo · $1,425/yr
- Insurance
- −$40
- HOA
- −$0
- Vacancy / Maint / Mgmt
- −$334
- Net cashflow
- $599
Break-even live
UW: 25.0% down · 7.5% · 30yr · 1.5% tax · 5.0% vac · 8.0% maint · 8.0% mgmt
Financing live
Cash to close
- Down payment
- $23,750
- Closing costs
- $2,850
- Reserves months
- —
- Total cash needed
- —
Loan-product check · same deal, 3 products live
Conventional
25% down · 7.5% · 30yr
- Down + closing
- —
- Monthly P&I
- —
- Monthly cashflow
- —
- DSCR
- —
- Eligible?
- —
Personal DTI + credit; lowest rate.
DSCR
20% down · 8.5% · 30yr
- Down + closing
- —
- Monthly P&I
- —
- Monthly cashflow
- —
- DSCR
- —
- Eligible?
- —
No personal income docs; deal must DSCR.
Hard money
10% down · 12.0% · 12mo
- Down + closing
- —
- Monthly P&I
- —
- Monthly cashflow
- —
- DSCR
- —
- Eligible?
- —
Short-term bridge; refi at stabilization.
Listing history 18 events
-
2026-06-19days on market $95,000 Active 332 DOM
-
2026-06-18days on market $95,000 Active 331 DOM
-
2026-06-17days on market $95,000 Active 330 DOM
-
2026-06-16days on market $95,000 Active 329 DOM
-
2026-06-15days on market $95,000 Active 328 DOM
-
2026-06-14days on market $95,000 Active 326 DOM
-
2026-06-12days on market $95,000 Active 325 DOM
-
2026-06-09days on market $95,000 Active 322 DOM
-
2026-06-08days on market $95,000 Active 321 DOM
-
2026-06-07days on market $95,000 Active 320 DOM
-
2026-06-05days on market $95,000 Active 317 DOM
-
2026-06-03days on market $95,000 Active 316 DOM
-
2026-06-02days on market $95,000 Active 315 DOM
-
2026-06-01days on market $95,000 Active 314 DOM
-
2026-05-31days on market $95,000 Active 313 DOM
-
2026-05-30days on market $95,000 Active 312 DOM
-
2025-07-21$533,560 Active
-
2025-07-21$95,000 Active
ⓘ Source: listings_history table (triggers on properties + properties_extension) + one-shot
backfill from property_details.listing_events for pre-trigger history.
Climate risk First Street
- Flood 3/10 Moderate FEMA zone X (unshaded) · 20% chance over 30 yrs
- Wildfire 6/10 Major
- Heat 2/10 Low 7 d/yr ≥86°F today · 18 d/yr by 30 yrs out
- Wind 1/10 Low
- Air quality 8/10 Severe 13 unhealthy d/yr today · 19 by 30 yrs out
Nearby sold comps map
Loading sold comps map…
Walkable amenities ~0.75 mi
Loading nearby amenities…
Taxation est. · year 1
- Rental income
- $19,064
- − Mortgage interest
- −$5,321
- − Property taxes
- −$1,425
- − Insurance
- −$475
- − Repairs & maintenance
- −$1,525
- − Management
- −$1,525
- − Depreciation
- −$2,764
- Taxable income
- $6,029
- Est. tax owed @ 24.0%
- −$1,447
- After-tax cash flow
- $5,736/yr
For passive investors: Depreciation is non-cash, so a rental often shows a tax loss while cash-flowing — sheltering income. Rental losses are passive: they offset passive income freely, and up to $25,000/yr can offset ordinary (W-2) income if you actively participate and your MAGI is under $100k (phasing out to $0 by $150k); unused losses carry forward. On sale, claimed depreciation is recaptured at up to 25%, and gains may owe capital-gains tax (a 1031 exchange can defer both). Figures are a year-1 estimate at your 24.0% rate — not tax advice; consult a CPA.
Schools (NCES district)
- District
- Butte H S
- NCES district ID
- 3005310
- Math proficiency
- 24% ▼ -7.00%
- Reading proficiency
- 50% ▲ 1.00%
- Median HH income
- $37,852
- Composite
- 30.74/100
- National rank
- #6162
- State rank
- #73 of 116 in MT
Livability — Butte-Silver Bow (balance)
No livability data for this city. (Only ~50 U.S. cities are tracked.)
Census & demographics
- Census place
- Butte-Silver Bow (balance), MT
- County
- Silver Bow County · 34,232 people
- City population
- 35,306
- Metro
- Butte-Silver Bow, MT
- Population (ZIP)
- 34,232
- Household income
- $60,437
- Rent vs Own
- Severe rent burden
- 1060.0
Population outlook (Silver Bow County) Hauer SSP2
- Today (2025)
- 35,745 people
- By 2030
- 36,359 · +1.7%
- By 2040
- 37,490 · +4.9%
- By 2050
- 38,593 · +8.0%
- By 2075
- 43,773 · +22.5%
- By 2100
- 48,513 · +35.7%
Race, ethnicity, and origin ACS 2023
- Neighborhood character
- Predominantly White (89%)
- Race & ethnicity
- White 89% Two or more races 6% Hispanic / Latino 5% Native American 2%
- Common ancestry
- Portuguese 5% Lithuanian 3% Slovak 2%
- Foreign-born
- 1%
- Languages at home
- 97% English-only · Korean 1% Arabic 1%
Political lean MEDSL · Silver Bow
- 2024 margin
- Lean D (+7.0) · D 51.5% · R 44.5% · Other 4.0%
- 2008→2024 swing
- -33.4pp toward R · 2008: 40.4pp · 2024: 7.0pp
- All cycles
- 2024: D+7.0 2020: D+14.1 2016: D+14.2 2012: D+32.5 2008: D+40.4
Not yet ingested
- Civics
- —
Market trends
- HPI YoY
- ▼ -119.08%
- Current HPI
- 268.4972
- Rent YoY
- ▲ 10.44%
- Metro
- Butte-Silver Bow, MT
- State GDP YoY
- ▲ 3.41%
- F500 in state
- 2
Industry mix (Fortune 500 HQ in MT)
| Industry | F500 HQs | Revenue |
|---|---|---|
| Technology / Analytics | 1 | $2B |
|
||
Price history
-82.2% since first listed2 events — show timeline
- 2025-07-21 Listed $95,000 BSCMLS
- 2025-07-21 Listed $533,560 BSCMLS
Cash-flow waterfall
monthlySold comps — $/sqft
last 12 mo · ≤1 miLoading sold comps…