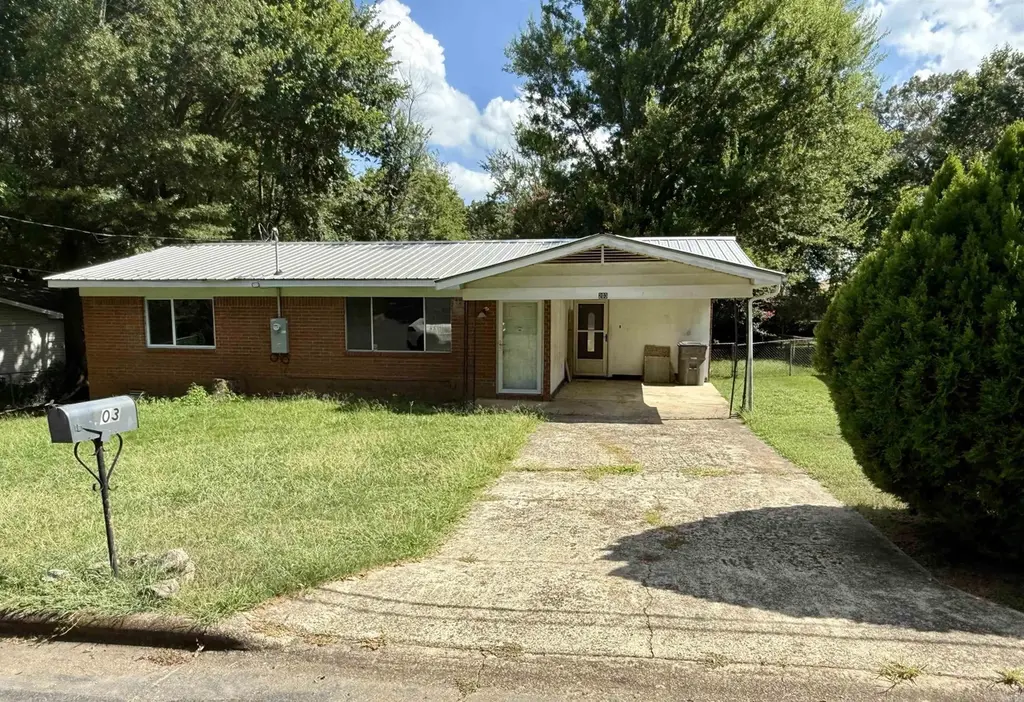
203 Lary St · Hot Springs, AR
Flood risk 1/10 · Minimal
- FEMA flood zone
- X (unshaded)
- Chance of flooding over 30 yrs
- 0.0%
- Est. flood insurance / yr
- $507 – $1,088
Fire risk 1/10 · Minimal
- Est. fire insurance / yr
- $1,499 – $2,785
Heat risk 6/10 · Moderate
- Hot days now (above 111°F)
- 7 days/yr
- Hot days in 30 yrs
- 20 days/yr
Wind risk 4/10 · Minor
- Chance of severe wind over 30 yrs
- 9.0%
Air-quality risk 1/10 · Minimal
- Unhealthy air days now
- 0 days/yr
- Unhealthy air days in 30 yrs
- 0 days/yr
Risk factors via First Street. Map © Google.
Why this score? — see what drove the C grade
The composite is a weighted blend of 9 inputs, each scored 0–100. Each bar is that input's sub-score; the figure is the points it added to the 100-point composite (weight × sub-score).
- Cash flow +20.3/30.0
- ARV discount +15.0/15.0
- DSCR +6.4/10.0
- 1% rule +4.4/10.0
- Rent growth +4.1/5.0
- Livability +3.2/5.0
- Condition / age +2.5/5.0
- Schools +2.0/10.0
- Appreciation +0.0/10.0
$130,000
🖨 Deal sheet (PDF) 📄 Offer letter ✓ Due diligence
Listing remarks MLS
Charming 2-bedroom, 1-bath home with loads of potential. Spacious layout, great bones, and a large, fenced backyard. Prime location-Just minutes from CHI Hospital, Walmart, Sam's, and major attractions. Needs updates -- perfect for a flip, rental, or buyers with a vision.
Key facts
- Fenced backyard
- Prime location
- Detached
Tags
Neighborhood map
What this means for you Summary
Snapshot
- This is a 2-bed/1.0-bath single-family listed at $130k.
Deal economics
- At list price, monthly cash flow is $166 ($2k/yr) — positive.
- The deal already cash-flows at list — no discount required.
- To meet the 1% rule (rent ≥ 1% of price), the offer needs to be $123k (5.7% below list).
- Recommended offer: $114k (12.0% below list) — sets the bar for market timing.
- Cap rate 7.8% vs local median 2.8% in Hot Springs — top-decile yield for the area; either an underpriced asset or a hidden risk that comps aren't pricing in. Stress-test before assuming the spread holds.
Location & tenants
- Location reads 65/100 on livability (#140 in AR) — a middle-class / working-renter tenant base. Strengths: cost of living A+, housing A+, health & safety A-; Watch: schools D, crime F, amenities F.
- Hot Springs School District (urban): math 24% / reading 25% proficiency, ranked #195 of 238 in AR (top 82%) — low school quality limits family demand, transient renter base, plan for 1-2y turnover; 72% free/reduced lunch — lower-income household profile, screen leases tightly.
- Market conditions: Rents rising fast (+6.4%/yr); 981 active listings in the ZIP; 7 comparable units currently listed for rent nearby; rentals lingering (median 45d on market — plan ~5-8 weeks vacancy on turnover, expect pricing pressure); 100% of comp listings sitting > 30 days — soft ceiling on asking rent; 117 units permitted in Garland County in 2024 (24 in 5+ unit buildings).
Forward outlook
- Local home prices are declining (-3.0%/yr); year-one equity from $899 of loan paydown is wiped out by about $4k of value loss. Plan a longer hold.
- Garland County population projected at +7% by 2050 — modest demand growth; plan on rents tracking national, not racing it.
- At projected returns (-3.0% appreciation + 6.4% rent growth), your $36k cash investment doubles in ~10 years — after that, you're playing with house money.
Negotiation context
- It's been on market 324 days — a 12% lower offer ($114k) is reasonable based on typical stale-listing flexibility.
- 2 sale attempts with the ask held roughly flat each time — persistent listings suggest the price (not the market) is what's stuck; bring a comps-based counter.
- Current owner paid $35k; list at $130k implies a 271% gain — meaningful room to come down on a strong offer.
Risks & watch-outs
- Climate carrying-cost: extreme-heat days projected 7→20/yr by 2055 (HVAC capex compounding) — expect insurance premiums to compound above CPI over the hold.
Questions for the listing agent
- It's been on market 324 days. Have you received any prior offers? Is the seller open to a 12% concession, seller financing, or rate buy-down credit?
- Built in 1970 — when were the roof, HVAC, electrical panel, plumbing, and water heater last replaced?
- Why hasn't it sold? Are there any deal-killer items the seller is aware of (foundation, flood, title, zoning, code violations)?
- Is there a deadline driving the sale (1031 exchange, divorce, estate, relocation)? That informs how much negotiation room exists.
- Schools are D-rated, which usually means shorter tenancies and higher turnover. Who's the typical renter profile here, and what's been the actual vacancy rate?
- Crime grade is F in this area — have there been break-ins, vandalism, or insurance claims at this property in the last 3 years? What carrier currently insures it and at what premium?
- What's the average days-on-market for RENTAL listings here right now (not sales)? A rising rental-DOM trend means longer vacancies and softer asking-rent achievability than the comps imply.
- What's the recent tenant-quality profile in this submarket — average credit score on applications, eviction rate, late-payment / NSF rate, and stable-employment percentage? A property-management company in the area should have these aggregated.
- How much new for-sale + rental construction is in the pipeline within 1–3 miles? Heavy new supply typically softens prices + rents 12–24 months out; constrained supply supports both.
Investment metrics
- 1% rule
- 0.94% ✗
- Cap rate
- 7.83%
- Cash-on-cash
- 5.48%
- DSCR
- 1.24
- GRM
- 8.8
CMA / ARV
- ARV (median comp)
- $173,524
- List price
- $130,000
- Delta
- -25.08%
- Verdict
- UNDERPRICED
- Comps
- 20 within 1.0 mi
Projected returns pro-forma
-3.0% appreciation · 6.43% rent growth · sell at horizon
- IRR
- -4.4%
- Equity multiple
- 0.83×
- Total profit
- $-6,138
- Equity at exit
- $19,383
- IRR
- 8.6%
- Equity multiple
- 1.75×
- Total profit
- $27,405
- Equity at exit
- $11,240
Cash invested: $36,400 (down + closing). Projections, not guarantees.
Landlord ↔ Tenant lean methodology
- Overall (STATE)
- 92 Strongly Landlord-Friendly
- State Arkansas
- 92 Strongly Landlord-Friendly · R+14
- County
- — inherits STATE
- City
- — inherits STATE
ZIP-level market 71913
- Home prices YoY
- -33.9%
- Rents YoY
- 6.4%
- Active inventory
- 981
- Price-to-rent
- 8.8×
Monthly cashflow live
- Estimated rent
- $1,226 high interval (Pro) →
- Mortgage (P&I)
- −$682
- Tax from tax record
- −$67 /mo · $799/yr
- Insurance
- −$54
- HOA
- −$0
- Vacancy / Maint / Mgmt
- −$258
- Net cashflow
- $166
Break-even live
Sensitivity live
| Price | -10% $240 | -5% $203 | +0% $166 | +5% $129 | +10% $93 |
|---|---|---|---|---|---|
| Rent | -10% $69 | -5% $118 | +0% $166 | +5% $215 | +10% $263 |
| Rate | -1.0pp $232 | -0.5pp $199 | base $166 | +0.5pp $133 | +1.0pp $98 |
UW: 25.0% down · 7.5% · 30yr · 1.5% tax · 5.0% vac · 8.0% maint · 8.0% mgmt
Financing live
Cash to close
- Down payment
- $32,500
- Closing costs
- $3,900
- Reserves months
- —
- Total cash needed
- —
Loan-product check · same deal, 3 products live
Conventional
25% down · 7.5% · 30yr
- Down + closing
- —
- Monthly P&I
- —
- Monthly cashflow
- —
- DSCR
- —
- Eligible?
- —
Personal DTI + credit; lowest rate.
DSCR
20% down · 8.5% · 30yr
- Down + closing
- —
- Monthly P&I
- —
- Monthly cashflow
- —
- DSCR
- —
- Eligible?
- —
No personal income docs; deal must DSCR.
Hard money
10% down · 12.0% · 12mo
- Down + closing
- —
- Monthly P&I
- —
- Monthly cashflow
- —
- DSCR
- —
- Eligible?
- —
Short-term bridge; refi at stabilization.
Rent comps 7 comps
| Address | Beds | Baths | Sqft | Rent | $/sqft | DOM | Units | Dist |
|---|---|---|---|---|---|---|---|---|
| 210 Carl Dr Unit B6 Hot Springs National Park, AR | 2.0 | 2.0 | 1350 | $1,350 | $1.00 | 45d | 1 | 0.31mi |
| 600 Higdon Ferry Rd #300 Hot Springs, AR | 2.0 | 2.0 | 1388 | $1,250 | $0.90 | 45d | 1 | 0.70mi |
| 143 Alpine St Hot Springs National Park, AR | 2.0 | 1.0 | 1000 | $995 | $0.99 | 45d | 1 | 0.99mi |
| 180 Lakeland Dr Hot Springs, AR | 2.0 | 2.0 | 1116 | $1,500 | $1.34 | 45d | 1 | 1.32mi |
| 410 Oakwood Ave Hot Springs, AR | 2.0–3.0 | 2.0 | 1000 | $999 | $1.00 | 45d | 6 | 1.34mi |
| 200 Lakeland Dr Hot Springs National Park, AR | 1.0–3.0 | 1.0–2.0 | 888 | $1,070 | $1.20 | 45d | 10 | 1.40mi |
| 122 Chambers Pt Hot Springs, AR | 2.0 | 2.0 | 1242 | $2,100 | $1.69 | 45d | 1 | 1.48mi |
Listing history 23 events
-
2026-06-19days on market $130,000 Active 324 DOM
-
2026-06-18days on market $130,000 Active 323 DOM
-
2026-06-17days on market $130,000 Active 322 DOM
-
2026-06-16days on market $130,000 Active 321 DOM
-
2026-06-15days on market $130,000 Active 320 DOM
-
2026-06-14days on market $130,000 Active 318 DOM
-
2026-06-13days on market $130,000 Active 317 DOM
-
2026-06-10days on market $130,000 Active 315 DOM
-
2026-06-09days on market $130,000 Active 314 DOM
-
2026-06-08days on market $130,000 Active 313 DOM
-
2026-06-07days on market $130,000 Active 312 DOM
-
2026-06-05days on market $130,000 Active 309 DOM
-
2026-06-02days on market $130,000 Active 307 DOM
-
2026-06-01days on market $130,000 Active 306 DOM
-
2026-05-31days on market $130,000 Active 305 DOM
-
2026-05-30days on market $130,000 Active 304 DOM
-
2025-08-22price $130,000 272-char remark
Show marketing remark (272 chars)
Charming 2-bedroom, 1-bath home with loads of potential. Spacious layout, great bones, and a large, fenced backyard. Prime location-Just minutes from CHI Hospital, Walmart, Sam's, and major attractions. Needs updates -- perfect for a flip, rental, or buyers with a vision.
-
2025-07-30$135,000 Active 272-char remark
Show marketing remark (272 chars)
Charming 2-bedroom, 1-bath home with loads of potential. Spacious layout, great bones, and a large, fenced backyard. Prime location-Just minutes from CHI Hospital, Walmart, Sam's, and major attractions. Needs updates -- perfect for a flip, rental, or buyers with a vision.
-
2025-07-25$135,000 New Listing 272-char remark
Show marketing remark (272 chars)
Charming 2-bedroom, 1-bath home with loads of potential. Spacious layout, great bones, and a large, fenced backyard. Prime location-Just minutes from CHI Hospital, Walmart, Sam's, and major attractions. Needs updates -- perfect for a flip, rental, or buyers with a vision.
-
2003-02-20soldstatus $35,000
-
1996-10-10soldstatus $59,000
-
1996-04-30soldstatus $55,000
ⓘ Source: listings_history table (triggers on properties + properties_extension) + one-shot
backfill from property_details.listing_events for pre-trigger history.
Tax reassessment forecast AR · Resets to sale price
- Current annual tax
- $799 · $67/mo
- Projected year-2 tax
- $832 · $69/mo
- Expected delta
- +$33/yr (+$3/mo · 4.1%)
ⓘ Screening estimate from a state-policy table — verify with the county assessor before closing.
Climate risk First Street
- Flood 1/10 Low FEMA zone X (unshaded) · 0% chance over 30 yrs
- Wildfire 1/10 Low
- Heat 6/10 Major 7 d/yr ≥111°F today · 20 d/yr by 30 yrs out
- Wind 4/10 Moderate 9% chance of damaging wind over 30 yrs
- Air quality 1/10 Low 0 unhealthy d/yr today · 0 by 30 yrs out
Nearby sold comps map
Loading sold comps map…
Walkable amenities ~0.75 mi
Loading nearby amenities…
Taxation est. · year 1
- Rental income
- $14,716
- − Mortgage interest
- −$7,282
- − Property taxes
- −$799
- − Insurance
- −$650
- − Repairs & maintenance
- −$1,177
- − Management
- −$1,177
- − Depreciation
- −$3,782
- Taxable loss
- −$152
- Est. tax savings @ 24.0%
- +$36
- After-tax cash flow
- $2,032/yr
For passive investors: Depreciation is non-cash, so a rental often shows a tax loss while cash-flowing — sheltering income. Rental losses are passive: they offset passive income freely, and up to $25,000/yr can offset ordinary (W-2) income if you actively participate and your MAGI is under $100k (phasing out to $0 by $150k); unused losses carry forward. On sale, claimed depreciation is recaptured at up to 25%, and gains may owe capital-gains tax (a 1031 exchange can defer both). Figures are a year-1 estimate at your 24.0% rate — not tax advice; consult a CPA.
Schools (NCES district)
- District
- Hot Springs School District
- NCES district ID
- 0507890
- Math proficiency
- 24% ▼ -15.00%
- Reading proficiency
- 25% ▼ -12.00%
- Median HH income
- $28,817
- Composite
- 19.62/100
- National rank
- #8746
- State rank
- #195 of 238 in AR
Livability — Hot Springs
- Score
- 65/100
- State rank
- #140
- US rank
- #12498
Category grades
Schools grade is shown separately in the Schools card above.
Census & demographics
- Census place
- Hot Springs, AR
- County
- Garland County · 76,414 people
- City population
- 76,414
- Metro
- Hot Springs, AR
- Population (ZIP)
- 47,477
- Household income
- $56,010
- Rent vs Own
- Severe rent burden
- 1442.0
Population outlook (Garland County) Hauer SSP2
- Today (2025)
- 100,343 people
- By 2030
- 101,880 · +1.5%
- By 2040
- 104,804 · +4.4%
- By 2050
- 107,292 · +6.9%
- By 2075
- 113,182 · +12.8%
- By 2100
- 112,247 · +11.9%
Race, ethnicity, and origin ACS 2023
- Neighborhood character
- Predominantly White (79%)
- Race & ethnicity
- White 79% Hispanic / Latino 8% Black 8% Two or more races 6% Asian 1%
- Hispanic origin (detail)
- Mexican 6%
- Common ancestry
- Italian 3% Lithuanian 2% Slovak 2%
- Foreign-born
- 5% · Canada
- Languages at home
- 91% English-only · Spanish 7% Other Indo-European 1%
Political lean MEDSL · Garland
- 2024 margin
- Solid R (+36.2) · D 30.8% · R 67.0% · Other 2.2%
- 2008→2024 swing
- -11.3pp toward R · 2008: -25.0pp · 2024: -36.2pp
- All cycles
- 2024: R+36.2 2020: R+34.0 2016: R+34.1 2012: R+29.9 2008: R+25.0
Not yet ingested
- Civics
- —
Market trends
- HPI YoY
- ▼ -137.67%
- Current HPI
- 268.5228
- Rent YoY
- ▲ 6.43%
- Metro
- Hot Springs, AR
- State GDP YoY
- ▲ 3.80%
- F500 in state
- 10
Industry mix (Fortune 500 HQ in AR)
| Industry | F500 HQs | Revenue |
|---|---|---|
| Retail | 1 | $681B |
|
||
| Food / Agriculture | 1 | $53B |
|
||
| Retail / Energy | 1 | $22B |
|
||
| Transportation / Logistics | 1 | $12B |
|
||
| Energy | 1 | $4B |
|
||
Price history
+136.4% since first listed7 events — show timeline
- 2025-08-22 Price Changed $130,000 CARMLS
- 2025-08-22 Price Changed $130,000 HSBOR
- 2025-07-30 Listed $135,000 HSBOR
- 2025-07-25 Listed $135,000 CARMLS
- 2003-02-20 Sold (Public Records) $35,000 Public Records
- 1996-10-10 Sold (Public Records) $59,000 Public Records
- 1996-04-30 Sold (Public Records) $55,000 Public Records
Property tax history
+21.0%/yrLatest (2025): $799 · +6.3% YoY. Source: county tax records.
Cash-flow waterfall
monthlySold comps — $/sqft
last 12 mo · ≤1 miLoading sold comps…