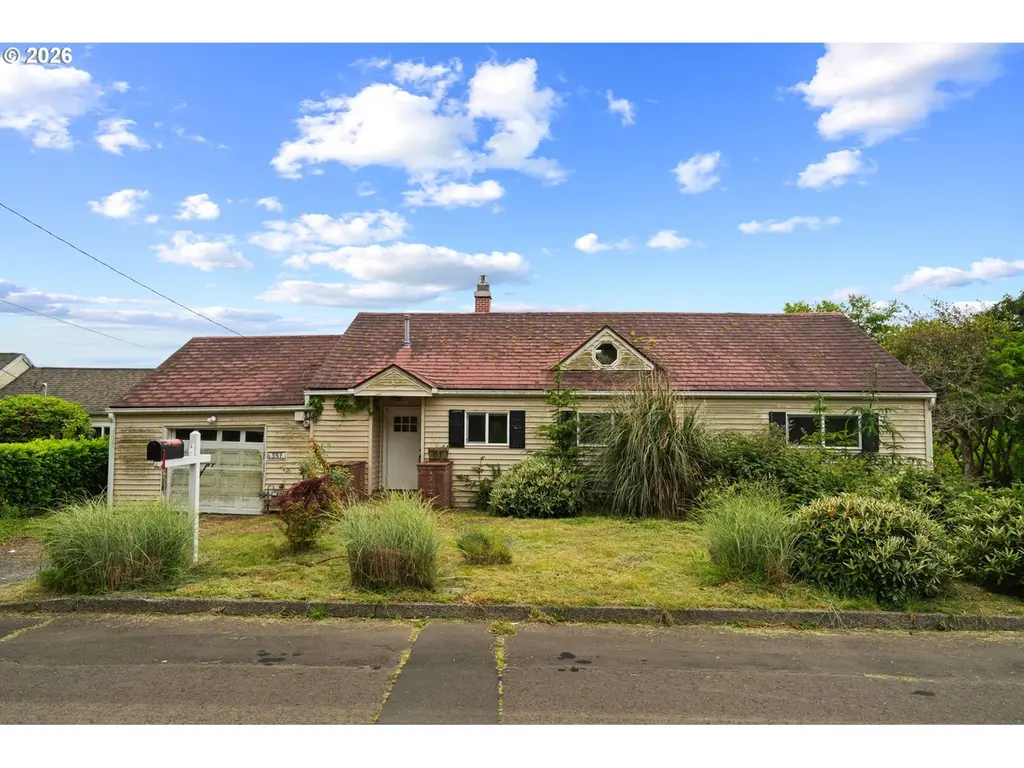
357 W Niagara Ave · Astoria, OR
Flood risk 1/10 · Minimal
- FEMA flood zone
- X (unshaded)
- Chance of flooding over 30 yrs
- 0.0%
- Est. flood insurance / yr
- $473 – $860
Fire risk 1/10 · Minimal
- Est. fire insurance / yr
- $498 – $926
Heat risk 1/10 · Minimal
- Hot days now (above 79°F)
- 7 days/yr
- Hot days in 30 yrs
- 14 days/yr
Wind risk 1/10 · Minimal
- Chance of severe wind over 30 yrs
- —
Air-quality risk 5/10 · Moderate
- Unhealthy air days now
- 6 days/yr
- Unhealthy air days in 30 yrs
- 6 days/yr
Risk factors via First Street. Map © Google.
Why this score? — see what drove the C grade
The composite is a weighted blend of 9 inputs, each scored 0–100. Each bar is that input's sub-score; the figure is the points it added to the 100-point composite (weight × sub-score).
- Cash flow +21.0/30.0
- ARV discount +7.5/15.0
- DSCR +6.7/10.0
- 1% rule +6.5/10.0
- Rent growth +4.2/5.0
- Livability +4.2/5.0
- Schools +4.0/10.0
- Condition / age +2.5/5.0
- Appreciation +0.0/10.0
$199,000
🖨 Deal sheet 📄 Offer letter ✓ Due diligence
Listing remarks MLS
Add elbow grease & gain instant equity on this hillside fixer with peek-a-boo river view. Three bedrooms (2 on main), full bathroom on each level, two separate attached garages. Second kitchen/garage in daylight basement adds potential for additional dwelling unit. Spacious unfinished attic. This property was built prior to 1978, potential for lead based paint exists. Sold as-is, seller will do no repairs. Cash or rehab loan only.
Key facts
- Water views
- Detached garages
- Bay views
Tags
Property features AI
Exterior
- Parking: Driveway and off-street parking; 4 parking spaces total; 4 garage spaces
- Utilities: Public water; Septic sewer; Electricity and gas available; No green certification
- Home design: Single-family residence (residential); Not attached to another property; Listed in fixer condition; Multiple levels (main, upper, lower); Facing direction not specified
- Construction: Built in 1947; Vinyl siding exterior; Roof and foundation details not specified
- Exterior features: Deck; Second residence on property; Second garage; Vinyl siding; Ocean view; Paved road access; Approximately 0.16-acre lot (around 6,969 sq ft); Beach within 1/4 mile
Interior
- Kitchen: Cooktop; Free-standing range; Free-standing refrigerator; Dishwasher; Plumbed for ice maker; Quartz countertops
- Bedrooms: Primary bedroom on main level; Second bedroom on main level; Third bedroom on main level; Fourth bedroom on lower level
- Flooring: Hardwood floors
- Bathrooms: Two full bathrooms (one on main level, one on lower level)
- Heating & cooling: Forced air heating; No central air listed
- Interior features: Hardwood floors; Soaking tub; Dual-flush toilet; Laundry area; Gas fireplace (1)
- Laundry & utility: Laundry area (washer/dryer hookups)
Neighborhood map
What this means for you Summary
Snapshot
- This is a 3-bed/2.0-bath single-family listed at $199k.
Deal economics
- At list price, monthly cash flow is $282 ($3k/yr) — positive.
- The deal already cash-flows at list — no discount required.
- Meets the 1% rule at list price ($2k rent vs $199k).
- Cap rate 8.0% vs local median 2.9% in Astoria — top-decile yield for the area; either an underpriced asset or a hidden risk that comps aren't pricing in. Stress-test before assuming the spread holds.
Location & tenants
- Location reads 83/100 on livability (#39 in OR, #891 nationally) — a professional / high-income tenant draw. Strengths: amenities A+, commute A+, health & safety A+; Watch: employment C-, cost of living C-.
- Astoria SD 1 (town): math 37% / reading 53% proficiency, ranked #77 of 183 in OR (top 42%) — families likely to look elsewhere, expect single-tenant / working-renter base with shorter leases.
- Zoned schools: Astoria Middle School (417 students, 38% FRL); Astoria Senior High School (631 students, 30% FRL).
- Market conditions: Rents rising fast (+7.0%/yr); 192 active listings in the ZIP; 3 comparable units currently listed for rent nearby; rentals lingering (median 44d on market — plan ~5-8 weeks vacancy on turnover, expect pricing pressure); 100% of comp listings sitting > 30 days — soft ceiling on asking rent; solid renter incomes; 98 units permitted in Clatsop County in 2024 (0 in 5+ unit buildings).
- This rent runs 36% of the median local income ($75k/yr) — at the standard rent-burdened threshold; future hikes will face affordability resistance.
Forward outlook
- Local home prices are declining (-3.0%/yr); year-one equity from $1k of loan paydown is wiped out by about $6k of value loss. Plan a longer hold.
- At projected returns (-3.0% appreciation + 7.0% rent growth), your $56k cash investment doubles in ~9 years — after that, you're playing with house money.
Negotiation context
- Only 7 days on market — expect competitive offers; lowballing is unlikely to land.
- 4 sale attempts since 29y ago with the ask held roughly flat each time — persistent listings suggest the price (not the market) is what's stuck; bring a comps-based counter.
- Current owner paid $130k; list at $199k implies a 53% gain — meaningful room to come down on a strong offer.
Risks & watch-outs
- Watch-outs: built in 1947 — expect roof / HVAC / electrical / plumbing capex.
Questions for the listing agent
- Built in 1947 — when were the roof, HVAC, electrical panel, plumbing, and water heater last replaced?
- Is there a deadline driving the sale (1031 exchange, divorce, estate, relocation)? That informs how much negotiation room exists.
- What's the average days-on-market for RENTAL listings here right now (not sales)? A rising rental-DOM trend means longer vacancies and softer asking-rent achievability than the comps imply.
- What's the recent tenant-quality profile in this submarket — average credit score on applications, eviction rate, late-payment / NSF rate, and stable-employment percentage? A property-management company in the area should have these aggregated.
- How much new for-sale + rental construction is in the pipeline within 1–3 miles? Heavy new supply typically softens prices + rents 12–24 months out; constrained supply supports both.
Investment metrics
- 1% rule
- 1.15% ✓
- Cap rate
- 7.99%
- Cash-on-cash
- 6.07%
- DSCR
- 1.27
- GRM
- 7.3
CMA / ARV
- ARV (on-the-fly)
- $558,751
- Comps found
- 12
Show comp detail 12 sales within ~0.75 mi
| Address | Dist | Beds/Ba | Sqft | Sold | Price | $/sf | Match |
|---|---|---|---|---|---|---|---|
| 423 Chinook Ave | 0.21mi | 3/3.0 | 1,846 (-3%) | 1mo | $615,000 | $333 | 80 |
| 859 Glasgow Ave | 0.08mi | 3/2.0 | 1,732 (-9%) | 3mo | $555,000 | $320 | 79 |
| 450 Pleasant Ave | 0.07mi | 3/3.0 | 2,021 (+6%) | 9mo | $550,000 | $272 | 75 |
| 30 W Kensington Ave | 0.42mi | 4/2.0 (+1) | 1,917 (+0%) | 3mo | $590,000 | $308 | 72 |
| 1466 3rd St | 0.54mi | 4/2.0 (+1) | 1,916 (+0%) | 3mo | $485,000 | $253 | 67 |
| 240 Lincoln St | 0.55mi | 2/2.0 (-1) | 1,758 (-8%) | 1mo | $515,000 | $293 | 56 |
| 1495 6th St | 0.66mi | 3/2.0 | 2,043 (+7%) | 2mo | $444,000 | $217 | 55 |
| 589 Rivington St | 0.40mi | 4/2.0 (+1) | 1,620 (-15%) | 1mo | $452,880 | $280 | 51 |
| 435 W Marine Dr | 0.41mi | 2/1.0 (-1) | 1,660 (-13%) | 0mo | $299,000 | $180 | 50 |
| 156 Lincoln St | 0.59mi | 4/1.0 (+1) | 2,060 (+8%) | 5mo | $164,444 | $80 | 46 |
| 538 Kensington Ave | 0.67mi | 3/2.0 | 1,651 (-13%) | 2mo | $610,000 | $369 | 44 |
| 664 Kensington Ave | 0.73mi | 3/2.0 | 1,632 (-14%) | 4mo | $599,000 | $367 | 38 |
Match score weights: distance 35% · size 25% · config 20% · recency 20%. Top-matched comps best support the ARV.
Projected returns pro-forma
-3.0% appreciation · 6.96% rent growth · sell at horizon
- IRR
- -2.1%
- Equity multiple
- 0.92×
- Total profit
- $-4,706
- Equity at exit
- $29,672
- IRR
- 11.7%
- Equity multiple
- 2.11×
- Total profit
- $61,673
- Equity at exit
- $17,206
Cash invested: $55,720 (down + closing). Projections, not guarantees.
Landlord ↔ Tenant lean methodology
- Overall (STATE)
- 28 Tenant-Leaning
- State Oregon
- 28 Tenant-Leaning · D+6
- County
- — inherits STATE
- City
- — inherits STATE
ZIP-level market 97103
- Rents YoY
- 7.0%
- Active inventory
- 192
- Price-to-rent
- 7.3×
Monthly cashflow live
- Estimated rent
- $2,285 medium interval (Pro) →
- Mortgage (P&I)
- −$1,044
- Tax from tax record
- −$397 /mo · $4,760/yr
- Insurance
- −$83
- HOA
- −$0
- Vacancy / Maint / Mgmt
- −$480
- Net cashflow
- $282
Break-even live
UW: 25.0% down · 7.5% · 30yr · 1.5% tax · 5.0% vac · 8.0% maint · 8.0% mgmt
Financing live
Cash to close
- Down payment
- $49,750
- Closing costs
- $5,970
- Reserves months
- —
- Total cash needed
- —
Loan-product check · same deal, 3 products live
Conventional
25% down · 7.5% · 30yr
- Down + closing
- —
- Monthly P&I
- —
- Monthly cashflow
- —
- DSCR
- —
- Eligible?
- —
Personal DTI + credit; lowest rate.
DSCR
20% down · 8.5% · 30yr
- Down + closing
- —
- Monthly P&I
- —
- Monthly cashflow
- —
- DSCR
- —
- Eligible?
- —
No personal income docs; deal must DSCR.
Hard money
10% down · 12.0% · 12mo
- Down + closing
- —
- Monthly P&I
- —
- Monthly cashflow
- —
- DSCR
- —
- Eligible?
- —
Short-term bridge; refi at stabilization.
Rent comps 3 comps
| Address | Beds | Baths | Sqft | Rent | $/sqft | DOM | Units | Dist |
|---|---|---|---|---|---|---|---|---|
| 813 Niagara Ave Astoria, OR | 3.0 | 2.0 | 1580 | $2,650 | $1.68 | 43d | 1 | 0.78mi |
| 1409 Jerome Ave Astoria, OR | 4.0 | 1.0 | 1348 | $2,095 | $1.55 | 43d | 1 | 1.13mi |
| 1585 Exchange St Unit A Astoria, OR | 2.0 | 2.0 | 1350 | $1,950 | $1.44 | 43d | 1 | 1.29mi |
Listing history 5 events
-
2026-06-12statusdays on market $199,000 Pending 7 DOM
-
2026-06-09days on market $199,000 Active 4 DOM
-
2026-06-08days on market $199,000 Active 3 DOM
-
2026-06-07remarks 699-char remark
-
2026-06-07$199,000 Active 2 DOM
ⓘ Source: listings_history table (triggers on properties + properties_extension) + one-shot
backfill from property_details.listing_events for pre-trigger history.
Tax reassessment forecast OR · Resets to sale price
- Current annual tax
- $4,760 · $397/mo
- Projected year-2 tax
- $4,760 · $397/mo
- Expected delta
- $0/yr ($0/mo · 0.0%)
ⓘ Screening estimate from a state-policy table — verify with the county assessor before closing.
Climate risk First Street
- Flood 1/10 Low FEMA zone X (unshaded) · 0% chance over 30 yrs
- Wildfire 1/10 Low
- Heat 1/10 Low 7 d/yr ≥79°F today · 14 d/yr by 30 yrs out
- Wind 1/10 Low
- Air quality 5/10 Major 6 unhealthy d/yr today · 6 by 30 yrs out
Nearby sold comps map
Loading sold comps map…
Walkable amenities ~0.75 mi
Loading nearby amenities…
Taxation est. · year 1
- Rental income
- $27,418
- − Mortgage interest
- −$11,147
- − Property taxes
- −$4,760
- − Insurance
- −$995
- − Repairs & maintenance
- −$2,193
- − Management
- −$2,193
- − Depreciation
- −$5,789
- Taxable income
- $339
- Est. tax owed @ 24.0%
- −$81
- After-tax cash flow
- $3,300/yr
For passive investors: Depreciation is non-cash, so a rental often shows a tax loss while cash-flowing — sheltering income. Rental losses are passive: they offset passive income freely, and up to $25,000/yr can offset ordinary (W-2) income if you actively participate and your MAGI is under $100k (phasing out to $0 by $150k); unused losses carry forward. On sale, claimed depreciation is recaptured at up to 25%, and gains may owe capital-gains tax (a 1031 exchange can defer both). Figures are a year-1 estimate at your 24.0% rate — not tax advice; consult a CPA.
Schools (NCES district)
- District
- Astoria SD 1
- NCES district ID
- 4101620
- Math proficiency
- 37% ▼ -2.00%
- Reading proficiency
- 53% ▬ 0.00%
- Median HH income
- $45,741
- Composite
- 40.42/100
- National rank
- #7726
- State rank
- #77 of 183 in OR
Livability — Astoria
- Score
- 83/100
- State rank
- #39
- US rank
- #891
Category grades
Schools grade is shown separately in the Schools card above.
Census & demographics
- Census place
- Astoria, OR
- County
- Clatsop County · 29,028 people
- City population
- 17,993
- Metro
- Astoria, OR
- Population (ZIP)
- 17,993
- Household income
- $75,147
- Rent vs Own
- Severe rent burden
- 605.0
Population outlook (Clatsop County) Hauer SSP2
- Today (2025)
- 39,212 people
- By 2030
- 39,765 · +1.4%
- By 2040
- 40,121 · +2.3%
- By 2050
- 40,032 · +2.1%
- By 2075
- 39,123 · -0.2%
- By 2100
- 35,965 · -8.3%
Race, ethnicity, and origin ACS 2023
- Neighborhood character
- Predominantly White (77%)
- Race & ethnicity
- White 77% Hispanic / Latino 11% Two or more races 11% Black 1%
- Hispanic origin (detail)
- Mexican 5%
- Common ancestry
- Portuguese 5% Italian 5% Slovak 4%
- Foreign-born
- 4% · Canada
- Languages at home
- 94% English-only · Spanish 4% Other Indo-European 1%
Political lean MEDSL · Clatsop
- 2024 margin
- D (+11.4) · D 54.1% · R 42.8% · Other 3.1%
- 2008→2024 swing
- -7.6pp toward R · 2008: 18.9pp · 2024: 11.4pp
- All cycles
- 2024: D+11.4 2020: D+11.3 2016: D+6.1 2012: D+14.6 2008: D+18.9
Not yet ingested
- Civics
- —
Market trends
- HPI YoY
- ▼ -384.01%
- Current HPI
- 306.6979
- Rent YoY
- ▲ 6.96%
- Metro
- Astoria, OR
- State GDP YoY
- ▲ 2.05%
- F500 in state
- 2
Industry mix (Fortune 500 HQ in OR)
| Industry | F500 HQs | Revenue |
|---|---|---|
| Consumer Goods | 1 | $51B |
|
||
Price history
+42.2% since first listed7 events — show timeline
- 2026-06-05 Listed $199,000 RMLS
- 2015-07-30 Sold (MLS) $129,900 RMLS
- 2015-05-29 Listed $129,900 RMLS
- 1998-11-30 Sold (MLS) $140,000 CAR
- 1998-11-30 Sold (MLS) $140,000 RMLS
- 1997-12-17 Listed $139,900 CAR
- 1997-12-17 Listed $139,900 RMLS
Property tax history
+3.6%/yrLatest (2025): $4,760 · -0.3% YoY. Source: county tax records.
Cash-flow waterfall
monthlySold comps — $/sqft
last 12 mo · ≤1 miLoading sold comps…