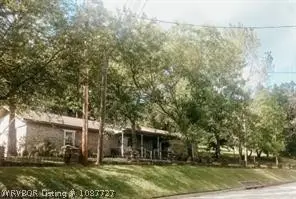
801 Buena Vista Ave · Van Buren, AR
Flood risk 1/10 · Minimal
- FEMA flood zone
- X (unshaded)
- Chance of flooding over 30 yrs
- 0.0%
- Est. flood insurance / yr
- $507 – $1,088
Fire risk 5/10 · Moderate
- Est. fire insurance / yr
- $1,499 – $2,785
Heat risk 6/10 · Moderate
- Hot days now (above 111°F)
- 7 days/yr
- Hot days in 30 yrs
- 19 days/yr
Wind risk 2/10 · Minimal
- Chance of severe wind over 30 yrs
- 2.0%
Air-quality risk 2/10 · Minimal
- Unhealthy air days now
- 0 days/yr
- Unhealthy air days in 30 yrs
- 1 days/yr
Risk factors via First Street. Map © Google.
Why this score? — see what drove the C grade
The composite is a weighted blend of 9 inputs, each scored 0–100. Each bar is that input's sub-score; the figure is the points it added to the 100-point composite (weight × sub-score).
- Cash flow +20.3/30.0
- ARV discount +12.5/15.0
- DSCR +6.4/10.0
- 1% rule +4.1/10.0
- Rent growth +3.7/5.0
- Livability +3.5/5.0
- Schools +3.4/10.0
- Condition / age +2.5/5.0
- Appreciation +0.0/10.0
$170,000
🖨 Deal sheet 📄 Offer letter ✓ Due diligence
Listing remarks MLS
Beautifull home in convenient location. Corner lot, with mature pine trees and partially fenced. 1.28 acres. Well maintained neighborhood. Lots of storage and closet space. Many built ins, huge walk-in closet. Stainless steel appliances less than 5 years old, roof aprox. 2 years old, heat and air within 10 years old. Large heated and cooled storage/workshop attached to carport. Lots of storage and closet space.
Key facts
- 1.28 acres
- Lots of storage
- Huge walk in closet
Tags
Neighborhood map
What this means for you Summary
Snapshot
- This is a 3-bed/2.5-bath single-family listed at $170k.
Deal economics
- At list price, monthly cash flow is $217 ($3k/yr) — positive.
- The deal already cash-flows at list — no discount required.
- To meet the 1% rule (rent ≥ 1% of price), the offer needs to be $155k (9.1% below list).
- Recommended offer: $155k (9.1% below list) — sets the bar for 1% rule.
- Cap rate 7.8% vs local median 3.9% in Van Buren — top-decile yield for the area; either an underpriced asset or a hidden risk that comps aren't pricing in. Stress-test before assuming the spread holds.
Location & tenants
- Location reads 69/100 on livability (#75 in AR) — a middle-class / working-renter tenant base. Strengths: cost of living A+, housing A+, health & safety A; Watch: employment D, crime D-, amenities F.
- Van Buren School District (suburban): math 41% / reading 41% proficiency, ranked #62 of 238 in AR (top 26%) — families likely to look elsewhere, expect single-tenant / working-renter base with shorter leases.
- Market conditions: Rents rising fast (+4.8%/yr); 247 active listings in the ZIP; 4 comparable units currently listed for rent nearby; rentals lingering (median 44d on market — plan ~5-8 weeks vacancy on turnover, expect pricing pressure); 50% of comp listings sitting > 30 days — soft ceiling on asking rent; 47 units permitted in Crawford County in 2024 (0 in 5+ unit buildings).
Forward outlook
- Local home prices are declining (-3.0%/yr); year-one equity from $1k of loan paydown is wiped out by about $5k of value loss. Plan a longer hold.
- Crawford County population projected to shrink 7% by 2050 — rents likely to lag national; underwrite the cash flow, not the appreciation.
Negotiation context
- It's been on market 95 days — a 9% lower offer ($155k) is reasonable based on typical stale-listing flexibility.
- Current owner paid $67k; list at $170k implies a 154% gain — meaningful room to come down on a strong offer.
Risks & watch-outs
- Climate carrying-cost: moderate wildfire risk; extreme-heat days projected 7→19/yr by 2055 (HVAC capex compounding) — expect insurance premiums to compound above CPI over the hold.
Questions for the listing agent
- It's been on market 95 days. Have you received any prior offers? Is the seller open to a 9% concession, seller financing, or rate buy-down credit?
- Built in 1975 — when were the roof, HVAC, electrical panel, plumbing, and water heater last replaced?
- Why hasn't it sold? Are there any deal-killer items the seller is aware of (foundation, flood, title, zoning, code violations)?
- Is there a deadline driving the sale (1031 exchange, divorce, estate, relocation)? That informs how much negotiation room exists.
- Crime grade is D in this area — have there been break-ins, vandalism, or insurance claims at this property in the last 3 years? What carrier currently insures it and at what premium?
- What's the average days-on-market for RENTAL listings here right now (not sales)? A rising rental-DOM trend means longer vacancies and softer asking-rent achievability than the comps imply.
- What's the recent tenant-quality profile in this submarket — average credit score on applications, eviction rate, late-payment / NSF rate, and stable-employment percentage? A property-management company in the area should have these aggregated.
- How much new for-sale + rental construction is in the pipeline within 1–3 miles? Heavy new supply typically softens prices + rents 12–24 months out; constrained supply supports both.
Investment metrics
- 1% rule
- 0.91% ✗
- Cap rate
- 7.83%
- Cash-on-cash
- 5.48%
- DSCR
- 1.24
- GRM
- 9.2
CMA / ARV
- ARV (median comp)
- $191,403
- List price
- $170,000
- Delta
- -11.18%
- Verdict
- UNDERPRICED
- Comps
- 20 within 1.0 mi
Show comp detail 12 sales within ~0.75 mi
| Address | Dist | Beds/Ba | Sqft | Sold | Price | $/sf | Match |
|---|---|---|---|---|---|---|---|
| 101 Prospect Ave | 0.04mi | 3/2.0 | 1,938 (+2%) | 4mo | $208,000 | $107 | 90 |
| 817 Arkansas St | 0.24mi | 3/2.0 | 1,804 (-5%) | 7mo | $240,000 | $133 | 73 |
| 8 Westward Cir | 0.46mi | 3/2.0 | 1,842 (-3%) | 8mo | $243,100 | $132 | 64 |
| 907 N 9th St | 0.55mi | 3/2.0 | 1,781 (-6%) | 2mo | $190,000 | $107 | 59 |
| 720 N 9th St | 0.54mi | 3/2.0 | 1,868 (-2%) | 12mo | $247,500 | $132 | 59 |
| 607 Spruce St | 0.70mi | 3/2.5 | 2,035 (+7%) | 0mo | $198,000 | $97 | 56 |
| 1108 N 9th St | 0.65mi | 3/2.0 | 1,983 (+4%) | 7mo | $247,500 | $125 | 55 |
| 23 Westward St | 0.54mi | 3/2.0 | 1,657 (-13%) | 2mo | $189,900 | $115 | 49 |
| 503 Robin Ln | 0.71mi | 3/2.5 | 2,054 (+8%) | 9mo | $250,000 | $122 | 46 |
| 220 Fayetteville Rd | 0.54mi | 2/2.0 (-1) | 1,666 (-12%) | 1mo | $27,000 | $16 | 46 |
| 603 Spruce St | 0.69mi | 3/2.0 | 2,140 (+12%) | 7mo | $271,000 | $127 | 40 |
| 1206 Blueberry Hill St | 0.64mi | 3/2.0 | 2,174 (+14%) | 10mo | $268,000 | $123 | 36 |
Match score weights: distance 35% · size 25% · config 20% · recency 20%. Top-matched comps best support the ARV.
Projected returns pro-forma
-3.0% appreciation · 4.76% rent growth · sell at horizon
- IRR
- -6.1%
- Equity multiple
- 0.77×
- Total profit
- $-10,993
- Equity at exit
- $25,348
- IRR
- 5.3%
- Equity multiple
- 1.42×
- Total profit
- $19,778
- Equity at exit
- $14,698
Cash invested: $47,600 (down + closing). Projections, not guarantees.
Landlord ↔ Tenant lean methodology
- Overall (STATE)
- 92 Strongly Landlord-Friendly
- State Arkansas
- 92 Strongly Landlord-Friendly · R+14
- County
- — inherits STATE
- City
- — inherits STATE
ZIP-level market 72956
- Rents YoY
- 4.8%
- Active inventory
- 247
- Price-to-rent
- 9.2×
Monthly cashflow live
- Estimated rent
- $1,546 medium interval (Pro) →
- Mortgage (P&I)
- −$891
- Tax from tax record
- −$42 /mo · $498/yr
- Insurance
- −$71
- HOA
- −$0
- Vacancy / Maint / Mgmt
- −$325
- Net cashflow
- $217
Break-even live
UW: 25.0% down · 7.5% · 30yr · 1.5% tax · 5.0% vac · 8.0% maint · 8.0% mgmt
Financing live
Cash to close
- Down payment
- $42,500
- Closing costs
- $5,100
- Reserves months
- —
- Total cash needed
- —
Loan-product check · same deal, 3 products live
Conventional
25% down · 7.5% · 30yr
- Down + closing
- —
- Monthly P&I
- —
- Monthly cashflow
- —
- DSCR
- —
- Eligible?
- —
Personal DTI + credit; lowest rate.
DSCR
20% down · 8.5% · 30yr
- Down + closing
- —
- Monthly P&I
- —
- Monthly cashflow
- —
- DSCR
- —
- Eligible?
- —
No personal income docs; deal must DSCR.
Hard money
10% down · 12.0% · 12mo
- Down + closing
- —
- Monthly P&I
- —
- Monthly cashflow
- —
- DSCR
- —
- Eligible?
- —
Short-term bridge; refi at stabilization.
Rent comps 4 comps
| Address | Beds | Baths | Sqft | Rent | $/sqft | DOM | Units | Dist |
|---|---|---|---|---|---|---|---|---|
| 506 Jenny Wren St Van Buren, AR | 3.0 | 2.0 | 1909 | $1,800 | $0.94 | 43d | 1 | 0.72mi |
| 306 Elfen Glen St Van Buren, AR | 3.0 | 2.0 | 1800 | $1,625 | $0.90 | 13d | 1 | 0.79mi |
| 522 S 6th St Van Buren, AR | 3.0 | 1.0 | 1424 | $975 | $0.68 | 43d | 1 | 1.10mi |
| 927 Skyline Dr Van Buren, AR | 4.0 | 2.5 | 2511 | $2,100 | $0.84 | 20d | 1 | 1.13mi |
Listing history 22 events
-
2026-06-19days on market $170,000 Active 95 DOM
-
2026-06-18price $170,000 Active 94 DOM
-
2026-06-18days on market $199,900 Active 94 DOM
-
2026-06-17days on market $199,900 Active 93 DOM
-
2026-06-16days on market $199,900 Active 92 DOM
-
2026-06-15days on market $199,900 Active 91 DOM
-
2026-06-14days on market $199,900 Active 89 DOM
-
2026-06-13days on market $199,900 Active 88 DOM
-
2026-06-10days on market $199,900 Active 86 DOM
-
2026-06-09days on market $199,900 Active 85 DOM
-
2026-06-08days on market $199,900 Active 84 DOM
-
2026-06-07days on market $199,900 Active 83 DOM
-
2026-06-05days on market $199,900 Active 80 DOM
-
2026-06-03days on market $199,900 Active 79 DOM
-
2026-06-02days on market $199,900 Active 78 DOM
-
2026-06-01days on market $199,900 Active 77 DOM
-
2026-05-31days on market $199,900 Active 76 DOM
-
2026-05-30days on market $199,900 Active 75 DOM
-
2026-05-05price $199,900 414-char remark
Show marketing remark (414 chars)
Beautifull home in convenient location. Corner lot, with mature pine trees and partially fenced. 1.28 acres. Well maintained neighborhood. Lots of storage and closet space. Many built ins, huge walk-in closet. Stainless steel appliances less than 5 years old, roof aprox. 2 years old, heat and air within 10 years old. Large heated and cooled storage/workshop attached to carport. Lots of storage and closet space.
-
2026-03-30price $225,000 414-char remark
Show marketing remark (414 chars)
Beautifull home in convenient location. Corner lot, with mature pine trees and partially fenced. 1.28 acres. Well maintained neighborhood. Lots of storage and closet space. Many built ins, huge walk-in closet. Stainless steel appliances less than 5 years old, roof aprox. 2 years old, heat and air within 10 years old. Large heated and cooled storage/workshop attached to carport. Lots of storage and closet space.
-
2026-03-16$235,000 Active 414-char remark
Show marketing remark (414 chars)
Beautifull home in convenient location. Corner lot, with mature pine trees and partially fenced. 1.28 acres. Well maintained neighborhood. Lots of storage and closet space. Many built ins, huge walk-in closet. Stainless steel appliances less than 5 years old, roof aprox. 2 years old, heat and air within 10 years old. Large heated and cooled storage/workshop attached to carport. Lots of storage and closet space.
-
2002-01-03soldstatus $67,000
ⓘ Source: listings_history table (triggers on properties + properties_extension) + one-shot
backfill from property_details.listing_events for pre-trigger history.
Tax reassessment forecast AR · Resets to sale price
- Current annual tax
- $498 · $42/mo
- Projected year-2 tax
- $1,088 · $91/mo
- Expected delta
- +$590/yr (+$49/mo · 118.4%)
ⓘ Screening estimate from a state-policy table — verify with the county assessor before closing.
Climate risk First Street
- Flood 1/10 Low FEMA zone X (unshaded) · 0% chance over 30 yrs
- Wildfire 5/10 Major
- Heat 6/10 Major 7 d/yr ≥111°F today · 19 d/yr by 30 yrs out
- Wind 2/10 Low 2% chance of damaging wind over 30 yrs
- Air quality 2/10 Low 0 unhealthy d/yr today · 1 by 30 yrs out
Nearby sold comps map
Loading sold comps map…
Walkable amenities ~0.75 mi
Loading nearby amenities…
Taxation est. · year 1
- Rental income
- $18,552
- − Mortgage interest
- −$9,523
- − Property taxes
- −$498
- − Insurance
- −$850
- − Repairs & maintenance
- −$1,484
- − Management
- −$1,484
- − Depreciation
- −$4,945
- Taxable loss
- −$233
- Est. tax savings @ 24.0%
- +$56
- After-tax cash flow
- $2,665/yr
For passive investors: Depreciation is non-cash, so a rental often shows a tax loss while cash-flowing — sheltering income. Rental losses are passive: they offset passive income freely, and up to $25,000/yr can offset ordinary (W-2) income if you actively participate and your MAGI is under $100k (phasing out to $0 by $150k); unused losses carry forward. On sale, claimed depreciation is recaptured at up to 25%, and gains may owe capital-gains tax (a 1031 exchange can defer both). Figures are a year-1 estimate at your 24.0% rate — not tax advice; consult a CPA.
Schools (NCES district)
- District
- Van Buren School District
- NCES district ID
- 0513410
- Math proficiency
- 41% ▼ -8.00%
- Reading proficiency
- 41% ▼ -4.00%
- Median HH income
- $40,350
- Composite
- 34.41/100
- National rank
- #5201
- State rank
- #62 of 238 in AR
Livability — Van Buren
- Score
- 69/100
- State rank
- #75
- US rank
- #8898
Category grades
Schools grade is shown separately in the Schools card above.
Census & demographics
- Census place
- Van Buren, AR
- County
- Crawford County · 34,546 people
- City population
- 34,546
- Metro
- Fort Smith, AR-OK
- Population (ZIP)
- 34,546
- Household income
- $62,988
- Rent vs Own
- Severe rent burden
- 571.0
Population outlook (Crawford County) Hauer SSP2
- Today (2025)
- 62,108 people
- By 2030
- 61,519 · -0.9%
- By 2040
- 59,735 · -3.8%
- By 2050
- 57,521 · -7.4%
- By 2075
- 53,143 · -14.4%
- By 2100
- 49,596 · -20.1%
Race, ethnicity, and origin ACS 2023
- Neighborhood character
- Predominantly White (76%)
- Race & ethnicity
- White 76% Hispanic / Latino 12% Two or more races 11% Asian 2% Native American 1% Black 1%
- Hispanic origin (detail)
- Mexican 5%
- Common ancestry
- Lithuanian 1% Slovak 1% Romanian 1%
- Foreign-born
- 6% · Canada
- Languages at home
- 89% English-only · Spanish 10%
Political lean MEDSL · Crawford
- 2024 margin
- Solid R (+58.2) · D 19.9% · R 78.1% · Other 2.0%
- 2008→2024 swing
- -12.1pp toward R · 2008: -46.0pp · 2024: -58.2pp
- All cycles
- 2024: R+58.2 2020: R+56.7 2016: R+55.0 2012: R+49.9 2008: R+46.0
Not yet ingested
- Civics
- —
Market trends
- HPI YoY
- ▼ -156.05%
- Current HPI
- 221.3066
- Rent YoY
- ▲ 4.76%
- Metro
- Fort Smith, AR-OK
- State GDP YoY
- ▲ 3.80%
- F500 in state
- 10
Industry mix (Fortune 500 HQ in AR)
| Industry | F500 HQs | Revenue |
|---|---|---|
| Retail | 1 | $681B |
|
||
| Food / Agriculture | 1 | $53B |
|
||
| Retail / Energy | 1 | $22B |
|
||
| Transportation / Logistics | 1 | $12B |
|
||
| Energy | 1 | $4B |
|
||
Price history
+198.4% since first listed4 events — show timeline
- 2026-05-05 Price Changed $199,900 WRVBOR
- 2026-03-30 Price Changed $225,000 WRVBOR
- 2026-03-16 Listed $235,000 WRVBOR
- 2002-01-03 Sold (Public Records) $67,000 Public Records
Property tax history
+1.2%/yrLatest (2025): $498 · -9.5% YoY. Source: county tax records.
Cash-flow waterfall
monthlySold comps — $/sqft
last 12 mo · ≤1 miLoading sold comps…