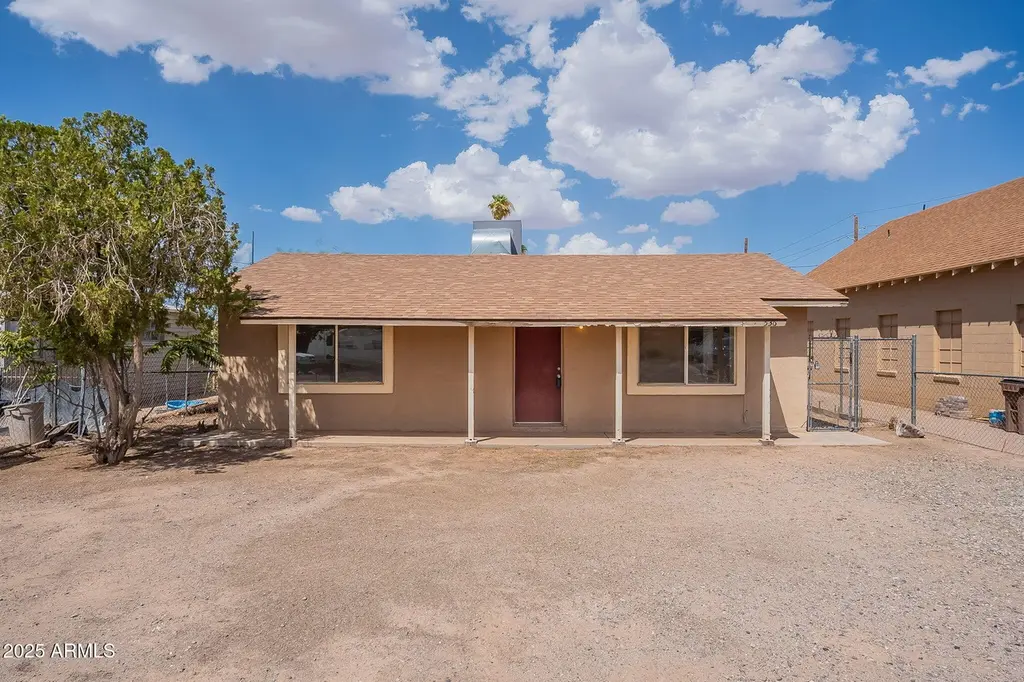
536 W Lincoln Ave · Coolidge, AZ
Flood risk 1/10 · Minimal
- FEMA flood zone
- X (unshaded)
- Chance of flooding over 30 yrs
- 0.0%
- Est. flood insurance / yr
- $507 – $1,088
Fire risk 6/10 · Moderate
- Est. fire insurance / yr
- $610 – $1,132
Heat risk 9/10 · Severe
- Hot days now (above 113°F)
- 7 days/yr
- Hot days in 30 yrs
- 19 days/yr
Wind risk 1/10 · Minimal
- Chance of severe wind over 30 yrs
- —
Air-quality risk 1/10 · Minimal
- Unhealthy air days now
- 0 days/yr
- Unhealthy air days in 30 yrs
- 0 days/yr
Risk factors via First Street. Map © Google.
Why this score? — see what drove the D grade
The composite is a weighted blend of 9 inputs, each scored 0–100. Each bar is that input's sub-score; the figure is the points it added to the 100-point composite (weight × sub-score).
- Cash flow +13.3/30.0
- ARV discount +12.0/15.0
- DSCR +4.0/10.0
- Livability +2.9/5.0
- Rent growth +2.7/5.0
- Condition / age +2.5/5.0
- 1% rule +2.4/10.0
- Schools +1.0/10.0
- Appreciation +0.0/10.0
$205,000
🖨 Deal sheet 📄 Offer letter ✓ Due diligence
Listing remarks MLS
Charming home located in downtown Coolidge, conveniently located for shopping, schools and restaurants. Fully updated interior featuring new paint throughout, new bathroom tub, vanity etc... Kitchen has been updated with countertops and new stove as well as new flooring throughout! Perfect opportunity for affordable housing in a convenient location!!!
Key facts
- New stove
- New bathroom tub
- Updated interior
Tags
Neighborhood map
What this means for you Summary
Snapshot
- This is a 3-bed/1.0-bath single-family listed at $205k.
Deal economics
- At list price, monthly cash flow is $2 ($21/yr) — positive.
- The deal already cash-flows at list — no discount required.
- To meet the 1% rule (rent ≥ 1% of price), the offer needs to be $152k (25.7% below list).
- Recommended offer: $152k (25.7% below list) — sets the bar for 1% rule.
- Cap rate 6.3% vs local median 4.5% in Coolidge — top-decile yield for the area; either an underpriced asset or a hidden risk that comps aren't pricing in. Stress-test before assuming the spread holds.
Location & tenants
- Location reads 57/100 on livability (#235 in AZ) — a working-class tenant base; expect higher turnover. Strengths: cost of living A+, housing A+; Watch: employment D, schools F, amenities F.
- Coolidge Unified District (4442) (town): math 8% / reading 14% proficiency, ranked #229 of 249 in AZ (top 92%) — low school quality limits family demand, transient renter base, plan for 1-2y turnover; 68% free/reduced lunch — lower-income household profile, screen leases tightly.
- Market conditions: Rents flat; 260 active listings in the ZIP; 26 comparable units currently listed for rent nearby; rentals at typical pace (median 24d on market — plan ~3-4 weeks tenant-placement turnaround); 42% of comp listings sitting > 30 days — soft ceiling on asking rent; 9,504 units permitted in Pinal County in 2024 (776 in 5+ unit buildings).
Forward outlook
- Local home prices are declining (-3.0%/yr); year-one equity from $1k of loan paydown is wiped out by about $6k of value loss. Plan a longer hold.
Negotiation context
- It's been on market 254 days — a 12% lower offer ($180k) is reasonable based on typical stale-listing flexibility.
- 8 sale attempts since 22y ago with the ask held roughly flat each time — persistent listings suggest the price (not the market) is what's stuck; bring a comps-based counter.
- Current owner paid $53k; list at $205k implies a 290% gain — meaningful room to come down on a strong offer.
Risks & watch-outs
- Watch-outs: built in 1956 — expect roof / HVAC / electrical / plumbing capex.
- Climate carrying-cost: major wildfire risk; extreme-heat days projected 7→19/yr by 2055 (HVAC capex compounding) — expect insurance premiums to compound above CPI over the hold.
Questions for the listing agent
- It's been on market 254 days. Have you received any prior offers? Is the seller open to a 26% concession, seller financing, or rate buy-down credit?
- Built in 1956 — when were the roof, HVAC, electrical panel, plumbing, and water heater last replaced?
- Why hasn't it sold? Are there any deal-killer items the seller is aware of (foundation, flood, title, zoning, code violations)?
- Is there a deadline driving the sale (1031 exchange, divorce, estate, relocation)? That informs how much negotiation room exists.
- Schools are F-rated, which usually means shorter tenancies and higher turnover. Who's the typical renter profile here, and what's been the actual vacancy rate?
- The area grade is low — what's the realistic commute time and amenity access for the typical tenant pool here? Any planned neighborhood developments (good or bad) we should know about?
- What's the average days-on-market for RENTAL listings here right now (not sales)? A rising rental-DOM trend means longer vacancies and softer asking-rent achievability than the comps imply.
- What's the recent tenant-quality profile in this submarket — average credit score on applications, eviction rate, late-payment / NSF rate, and stable-employment percentage? A property-management company in the area should have these aggregated.
- How much new for-sale + rental construction is in the pipeline within 1–3 miles? Heavy new supply typically softens prices + rents 12–24 months out; constrained supply supports both.
Investment metrics
- 1% rule
- 0.74% ✗
- Cap rate
- 6.30%
- Cash-on-cash
- 0.04%
- DSCR
- 1.00
- GRM
- 11.2
CMA / ARV
- ARV (median comp)
- $227,923
- List price
- $205,000
- Delta
- -10.06%
- Verdict
- UNDERPRICED
- Comps
- 20 within 1.0 mi
Show comp detail 12 sales within ~0.75 mi
| Address | Dist | Beds/Ba | Sqft | Sold | Price | $/sf | Match |
|---|---|---|---|---|---|---|---|
| 694 W Coolidge Pl | 0.21mi | 3/2.0 | 1,115 (+5%) | 13mo | $279,500 | $251 | 66 |
| 325 W Northern Ave | 0.61mi | 2/1.0 (-1) | 1,067 (+0%) | 2mo | $204,000 | $191 | 64 |
| 426 W Gibson Ave | 0.48mi | 3/2.0 | 1,167 (+10%) | 1mo | $175,000 | $150 | 56 |
| 541 W Central Ave | 0.33mi | 3/2.0 | 1,146 (+8%) | 19mo | $150,000 | $131 | 52 |
| 667 W Pinkley Ave W | 0.42mi | 2/1.0 (-1) | 1,221 (+15%) | 6mo | $200,000 | $164 | 45 |
| 543 W Sunset Ave | 0.59mi | 2/1.0 (-1) | 946 (-11%) | 9mo | $165,000 | $174 | 42 |
| 320 W Pima Ave | 0.58mi | 2/1.0 (-1) | 935 (-12%) | 8mo | $203,900 | $218 | 42 |
| 555 W Northern Ave | 0.54mi | 2/1.0 (-1) | 997 (-6%) | 23mo | $198,000 | $199 | 40 |
| 612 N 4th St | 0.74mi | 3/2.0 | 1,101 (+4%) | 22mo | $215,000 | $195 | 38 |
| 721 W Pima Ave | 0.52mi | 3/2.0 | 1,214 (+14%) | 12mo | $167,500 | $138 | 38 |
| 1063 W Verde Ln | 0.72mi | 3/2.0 | 1,217 (+15%) | 2mo | $248,675 | $204 | 36 |
| 1034 W Starview Ave | 0.72mi | 3/2.0 | 1,217 (+15%) | 22mo | $270,000 | $222 | 19 |
Match score weights: distance 35% · size 25% · config 20% · recency 20%. Top-matched comps best support the ARV.
Projected returns pro-forma
-3.0% appreciation · 0.97% rent growth · sell at horizon
- IRR
- -18.3%
- Equity multiple
- 0.37×
- Total profit
- $-36,268
- Equity at exit
- $30,566
- IRR
- -14.5%
- Equity multiple
- 0.24×
- Total profit
- $-43,902
- Equity at exit
- $17,725
Cash invested: $57,400 (down + closing). Projections, not guarantees.
Landlord ↔ Tenant lean methodology
- Overall (STATE)
- 87 Strongly Landlord-Friendly
- State Arizona
- 87 Strongly Landlord-Friendly · R+3
- County
- — inherits STATE
- City
- — inherits STATE
ZIP-level market 85128
- Home prices YoY
- -7.9%
- Rents YoY
- 1.0%
- Active inventory
- 260
- Price-to-rent
- 11.2×
Monthly cashflow live
- Estimated rent
- $1,524 high interval (Pro) →
- Mortgage (P&I)
- −$1,075
- Tax from tax record
- −$42 /mo · $501/yr
- Insurance
- −$85
- HOA
- −$0
- Vacancy / Maint / Mgmt
- −$320
- Net cashflow
- $2
Break-even live
UW: 25.0% down · 7.5% · 30yr · 1.5% tax · 5.0% vac · 8.0% maint · 8.0% mgmt
Financing live
Cash to close
- Down payment
- $51,250
- Closing costs
- $6,150
- Reserves months
- —
- Total cash needed
- —
Loan-product check · same deal, 3 products live
Conventional
25% down · 7.5% · 30yr
- Down + closing
- —
- Monthly P&I
- —
- Monthly cashflow
- —
- DSCR
- —
- Eligible?
- —
Personal DTI + credit; lowest rate.
DSCR
20% down · 8.5% · 30yr
- Down + closing
- —
- Monthly P&I
- —
- Monthly cashflow
- —
- DSCR
- —
- Eligible?
- —
No personal income docs; deal must DSCR.
Hard money
10% down · 12.0% · 12mo
- Down + closing
- —
- Monthly P&I
- —
- Monthly cashflow
- —
- DSCR
- —
- Eligible?
- —
Short-term bridge; refi at stabilization.
Rent comps 26 comps
| Address | Beds | Baths | Sqft | Rent | $/sqft | DOM | Units | Dist |
|---|---|---|---|---|---|---|---|---|
| 447 W Seagoe Ave Unit A Coolidge, AZ | 2.0 | 1.5 | 752 | $1,000 | $1.33 | 24d | 1 | 0.18mi |
| 393 W Seagoe Ave Unit B Coolidge, AZ | 3.0 | 2.0 | 1030 | $1,250 | $1.21 | 43d | 1 | 0.23mi |
| 232 W Elm Ave Unit B Coolidge, AZ | 4.0 | 2.5 | 1452 | $1,350 | $0.93 | 43d | 1 | 0.40mi |
| 144 W Lincoln Ave Coolidge, AZ | 3.0 | 2.0 | 1125 | $1,299 | $1.15 | 3d | 1 | 0.45mi |
| 350 W Spruell Ave Coolidge, AZ | 1.0–2.0 | 1.0–2.0 | 771 | $1,095 | $1.42 | 1d | 1 | 0.67mi |
| 440 W Taylor Ave Coolidge, AZ | 2.0 | 1.0 | 992 | $1,250 | $1.26 | 15d | 1 | 0.75mi |
| 313 E Central Ave Coolidge, AZ | 2.0 | 2.0 | 1393 | $1,200 | $0.86 | 43d | 1 | 0.76mi |
| 342 W Taylor Ave Coolidge, AZ | 3.0 | 1.5 | 1008 | $1,500 | $1.49 | 43d | 1 | 0.77mi |
| 1204 W Prior Ave Coolidge, AZ | 3.0 | 2.0 | 1280 | $1,595 | $1.25 | 43d | 1 | 0.79mi |
| 392 E Dirkley Ave Coolidge, AZ | 4.0 | 2.5 | 1440 | $1,700 | $1.18 | 43d | 1 | 0.80mi |
| 311 W Bealey Ave Coolidge, AZ | 3.0 | 1.5 | 1000 | $1,250 | $1.25 | 20d | 1 | 0.86mi |
| 623 N Main St Unit 102 Coolidge, AZ | 2.0 | 1.0 | 800 | $950 | $1.19 | 43d | 1 | 0.88mi |
| 1660 S Wooten St Coolidge, AZ | 3.0 | 2.5 | 1385 | $1,500 | $1.08 | 5d | 1 | 0.98mi |
| 227 W Douglas Ave Coolidge, AZ | 3.0 | 2.0 | 1202 | $1,595 | $1.33 | 43d | 1 | 0.98mi |
| 816 W Mid Way St Coolidge, AZ | 3.0 | 2.0 | 1448 | $1,600 | $1.10 | 24d | 1 | 1.00mi |
| 228 W Hess Ave Coolidge, AZ | 2.0 | 2.0 | 1020 | $1,450 | $1.42 | 24d | 1 | 1.05mi |
| 131 E Patton Ave Coolidge, AZ | 4.0 | 2.0 | 1221 | $2,200 | $1.80 | 43d | 1 | 1.11mi |
| 940 N Sonora St Coolidge, AZ | 3.0 | 2.0 | 1290 | $1,500 | $1.16 | 43d | 1 | 1.11mi |
| 1451 W Pinkley Ave Coolidge, AZ | 3.0 | 2.0 | 1490 | $1,600 | $1.07 | 18d | 1 | 1.17mi |
| 1224 N Palm Ln Coolidge, AZ | 4.0 | 2.0 | 1280 | $1,800 | $1.41 | 20d | 1 | 1.18mi |
| 903 N California St Coolidge, AZ | 2.0–4.0 | 1.0–2.0 | 979 | $1,602 | $1.64 | 17d | 8 | 1.20mi |
| 903 N California St Coolidge, AZ | 2.0–4.0 | 1.0–2.0 | 979 | $1,602 | $1.64 | 5d | 1 | 1.20mi |
| 1105 N Cota Ln Coolidge, AZ | 3.0 | 1.5 | 1321 | $2,500 | $1.89 | 43d | 1 | 1.21mi |
| 203 S 16th St Coolidge, AZ | 3.0 | 2.5 | 1389 | $1,550 | $1.12 | 24d | 1 | 1.23mi |
| 961 W Toltec Dr Coolidge, AZ | 4.0 | 2.0 | 1467 | $1,495 | $1.02 | 24d | 1 | 1.27mi |
| 1759 W Wilson Ave Coolidge, AZ | 3.0 | 2.0 | 1268 | $1,200 | $0.95 | 24d | 1 | 1.45mi |
Listing history 28 events
-
2025-11-01price $205,000 356-char remark
Show marketing remark (356 chars)
Charming home located in downtown Coolidge, conveniently located for shopping, schools and restaurants. Fully updated interior featuring new paint throughout, new bathroom tub, vanity etc... Kitchen has been updated with countertops and new stove as well as new flooring throughout! Perfect opportunity for affordable housing in a convenient location!!!
-
2025-09-12$210,000 Active 356-char remark
Show marketing remark (356 chars)
Charming home located in downtown Coolidge, conveniently located for shopping, schools and restaurants. Fully updated interior featuring new paint throughout, new bathroom tub, vanity etc... Kitchen has been updated with countertops and new stove as well as new flooring throughout! Perfect opportunity for affordable housing in a convenient location!!!
-
2025-08-29historical
-
2025-08-16status Active
-
2025-08-16historical
-
2025-06-16price $210,000
-
2025-04-03price $215,000
-
2025-04-02price $210,000
-
2025-03-15$230,000 Active
-
2015-05-11soldstatus $52,600 Closed
-
2015-05-11soldstatus $52,600
-
2015-05-04status Pending
-
2015-04-01$59,900 Active
-
2014-12-31historical
-
2014-03-12$59,900 Active
-
2013-12-09soldstatus $28,000 Closed
-
2013-11-27status Pending
-
2013-10-26price $34,900
-
2013-10-22price $39,500
-
2013-09-15price $43,500
-
2013-08-14$49,900 Active
-
2007-03-01soldstatus $71,000
-
2007-02-22soldstatus $71,000
-
2007-02-14historical
-
2007-01-08$75,000
-
2004-08-04historical
-
2004-03-04$58,500
-
1988-07-26soldstatus $28,000
ⓘ Source: listings_history table (triggers on properties + properties_extension) + one-shot
backfill from property_details.listing_events for pre-trigger history.
Tax reassessment forecast AZ · Resets to sale price
- Current annual tax
- $501 · $42/mo
- Projected year-2 tax
- $1,353 · $113/mo
- Expected delta
- +$852/yr (+$71/mo · 169.8%)
ⓘ Screening estimate from a state-policy table — verify with the county assessor before closing.
Climate risk First Street
- Flood 1/10 Low FEMA zone X (unshaded) · 0% chance over 30 yrs
- Wildfire 6/10 Major
- Heat 9/10 Extreme 7 d/yr ≥113°F today · 19 d/yr by 30 yrs out
- Wind 1/10 Low
- Air quality 1/10 Low 0 unhealthy d/yr today · 0 by 30 yrs out
Nearby sold comps map
Loading sold comps map…
Walkable amenities ~0.75 mi
Loading nearby amenities…
Taxation est. · year 1
- Rental income
- $18,288
- − Mortgage interest
- −$11,483
- − Property taxes
- −$501
- − Insurance
- −$1,025
- − Repairs & maintenance
- −$1,463
- − Management
- −$1,463
- − Depreciation
- −$5,964
- Taxable loss
- −$3,611
- Est. tax savings @ 24.0%
- +$867
- After-tax cash flow
- $888/yr
For passive investors: Depreciation is non-cash, so a rental often shows a tax loss while cash-flowing — sheltering income. Rental losses are passive: they offset passive income freely, and up to $25,000/yr can offset ordinary (W-2) income if you actively participate and your MAGI is under $100k (phasing out to $0 by $150k); unused losses carry forward. On sale, claimed depreciation is recaptured at up to 25%, and gains may owe capital-gains tax (a 1031 exchange can defer both). Figures are a year-1 estimate at your 24.0% rate — not tax advice; consult a CPA.
Schools (NCES district)
- District
- Coolidge Unified District (4442)
- NCES district ID
- 0402320
- Math proficiency
- 8% ▼ -6.00%
- Reading proficiency
- 14% ▼ -2.00%
- Median HH income
- $49,182
- Composite
- 10.35/100
- National rank
- #9787
- State rank
- #229 of 249 in AZ
Livability — Coolidge
- Score
- 57/100
- State rank
- #235
- US rank
- #22344
Category grades
Schools grade is shown separately in the Schools card above.
Census & demographics
- Census place
- Coolidge, AZ
- County
- Pinal County · 399,947 people
- City population
- 19,487
- Metro
- Phoenix-Mesa-Chandler, AZ
- Population (ZIP)
- 19,487
- Household income
- $65,477
- Rent vs Own
- Severe rent burden
- 264.0
Population outlook (Pinal County) Hauer SSP2
- Today (2025)
- 437,574 people
- By 2030
- 446,903 · +2.1%
- By 2040
- 452,589 · +3.4%
- By 2050
- 444,126 · +1.5%
- By 2075
- 430,300 · -1.7%
- By 2100
- 393,536 · -10.1%
Race, ethnicity, and origin ACS 2023
- Neighborhood character
- Diverse neighborhood (Simpson 0.64)
- Race & ethnicity
- Hispanic / Latino 52% White 29% Two or more races 22% Native American 17% Black 4%
- Hispanic origin (detail)
- Mexican 49%
- Common ancestry
- Lithuanian 1% Portuguese 1% Serbian 1%
- Foreign-born
- 9% · Canada
- Languages at home
- 71% English-only · Spanish 25% Other Indo-European 1%
Political lean MEDSL · Pinal
- 2024 margin
- Strong R (+22.1) · D 38.5% · R 60.6%
- 2008→2024 swing
- -7.6pp toward R · 2008: -14.5pp · 2024: -22.1pp
- All cycles
- 2024: R+22.1 2020: R+17.3 2016: R+19.3 2012: R+17.1 2008: R+14.5
Not yet ingested
- Civics
- —
Market trends
- HPI YoY
- ▼ -23.95%
- Current HPI
- 280.3422
- Rent YoY
- ▲ 0.97%
- Metro
- Phoenix-Mesa-Chandler, AZ
- State GDP YoY
- ▲ 4.54%
- F500 in state
- 20
Industry mix (Fortune 500 HQ in AZ)
| Industry | F500 HQs | Revenue |
|---|---|---|
| Technology | 2 | $13B |
|
||
| Mining / Metals | 1 | $23B |
|
||
| Environmental Services | 1 | $16B |
|
||
| Metals / Steel | 1 | $14B |
|
||
| Technology Distribution | 1 | $9B |
|
||
| Homebuilding | 1 | $8B |
|
||
Price history
+632.1% since first listed28 events — show timeline
- 2025-11-01 Price Changed $205,000 ARMLS
- 2025-09-12 Listed $210,000 ARMLS
- 2025-08-29 Listing Removed — ARMLS
- 2025-08-16 Relisted — ARMLS
- 2025-08-16 Listing Removed — ARMLS
- 2025-06-16 Price Changed $210,000 ARMLS
- 2025-04-03 Price Changed $215,000 ARMLS
- 2025-04-02 Price Changed $210,000 ARMLS
- 2025-03-15 Listed $230,000 ARMLS
- 2015-05-11 Sold (Public Records) $52,600 Public Records
- 2015-05-11 Sold (MLS) $52,600 ARMLS
- 2015-05-04 Pending — ARMLS
- 2015-04-01 Listed $59,900 ARMLS
- 2014-12-31 Listing Removed — ARMLS
- 2014-03-12 Listed $59,900 ARMLS
- 2013-12-09 Sold (MLS) $28,000 ARMLS
- 2013-11-27 Pending — ARMLS
- 2013-10-26 Price Changed $34,900 ARMLS
- 2013-10-22 Price Changed $39,500 ARMLS
- 2013-09-15 Price Changed $43,500 ARMLS
- 2013-08-14 Listed $49,900 ARMLS
- 2007-03-01 Sold (Public Records) $71,000 Public Records
- 2007-02-22 Sold (MLS) $71,000 ARMLS
- 2007-02-14 Listing Removed — ARMLS
- 2007-01-08 Listed $75,000 ARMLS
- 2004-08-04 Listing Removed — ARMLS
- 2004-03-04 Listed $58,500 ARMLS
- 1988-07-26 Sold (Public Records) $28,000 Public Records
Property tax history
+0.7%/yrLatest (2025): $501 · +4.8% YoY. Source: county tax records.
Cash-flow waterfall
monthlySold comps — $/sqft
last 12 mo · ≤1 miLoading sold comps…