 🌊 Lakefront
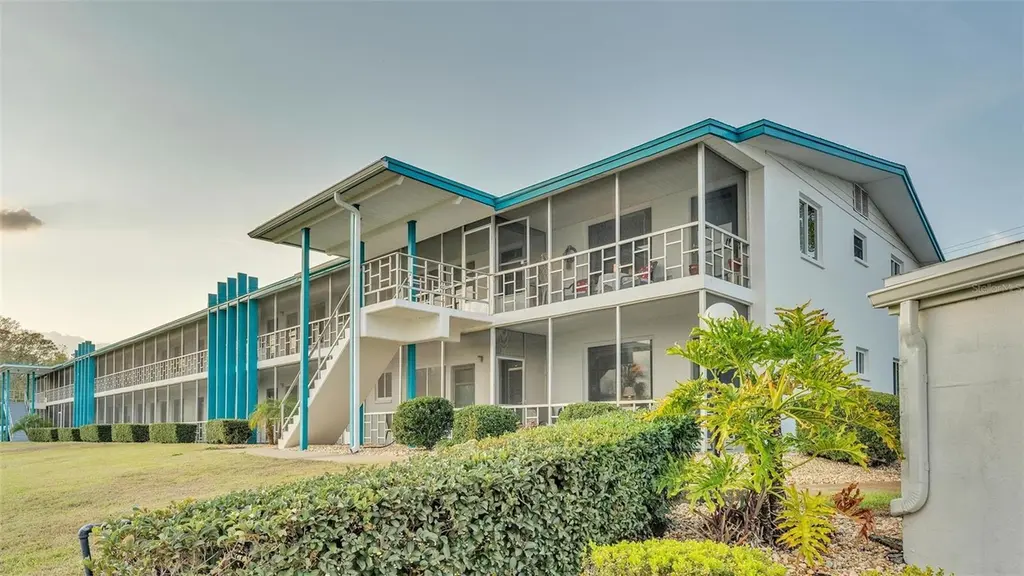
1600 W Lake Parker Dr Unit B9 · Lakeland, FL
Flood risk 1/10 · Minimal
- FEMA flood zone
- X (unshaded)
- Chance of flooding over 30 yrs
- 0.0%
- Est. flood insurance / yr
- $507 – $1,088
Fire risk 3/10 · Minor
- Est. fire insurance / yr
- $947 – $1,759
Heat risk 8/10 · Major
- Hot days now (above 108°F)
- 7 days/yr
- Hot days in 30 yrs
- 24 days/yr
Wind risk 10/10 · Severe
- Chance of severe wind over 30 yrs
- 99.0%
Air-quality risk 2/10 · Minimal
- Unhealthy air days now
- 1 days/yr
- Unhealthy air days in 30 yrs
- 2 days/yr
Risk factors via First Street. Map © Google.
Why this score? — see what drove the D grade
The composite is a weighted blend of 9 inputs, each scored 0–100. Each bar is that input's sub-score; the figure is the points it added to the 100-point composite (weight × sub-score).
- Cash flow +11.3/30.0
- ARV discount +7.5/15.0
- 1% rule +6.7/10.0
- Livability +3.9/5.0
- Schools +3.5/10.0
- DSCR +3.3/10.0
- Rent growth +2.7/5.0
- Condition / age +2.5/5.0
- Appreciation +0.0/10.0
$129,900
🖨 Deal sheet 📄 Offer letter ✓ Due diligence
Listing remarks
Take a look at this amazing unobstructed LAKEFRONT view, 2 br 1 ba unit on the bottom floor END UNIT with a screened from patio. Perfect for warm sunny days to enjoy the Florida sunshine with your morning coffee. Brand new in 2026 newly updated bathroom! Tile throughout and ample closet space for storage. It’s located just minutes from all the major attractions and easy access to the beaches and I-4. Light and bright best describes this move-in ready condo. Lovely and very functional layout with a newer roof and AC both in 2021 - New electrical panel box which is a huge upgrade. The community offers a clubhouse, heated pool, shuffleboard, private boat dock, and newer crosswalks to the
Key facts
- $393 HOA
- Parking
- Community pool
Property features AI
Finance
- Other: Furnished: negotiable; Home warranty: none; Third party listing: yes
- Financial info: Total annual fees: $4,716; Association fee required
- HOA & community: Monthly HOA fee of $393 (includes cable TV, pool, structure and grounds maintenance, pest control, trash); Association amenities: clubhouse, laundry, pool, community mailbox, sidewalks; Buyer approval required; Senior community; Pets not allowed
Exterior
- Parking: Assigned parking; Carport (1 space)
- Utilities: Public water; Public sewer; Cable available; Broadband/high-speed internet available; Electricity available
- Home design: Condominium; Residential property; One level (stories total: 2); Faces west; Unit on first floor
- Construction: Stucco construction; Shingle roof; Slab foundation; Building B
- Exterior features: Enclosed patio; Patio; Lakefront with lake view; Fishing pier; Paved road access
Interior
- Kitchen: Range; Refrigerator
- Bedrooms: 2 bedrooms (first floor)
- Flooring: Tile
- Bathrooms: 1 full bathroom
- Heating & cooling: Central heating; Central air
- Interior features: Solid surface counters; Lighting
- Laundry & utility: Laundry in common area
Neighborhood map
What this means for you Summary
Snapshot
- This is a 2-bed/2.0-bath condo listed at $130k.
Deal economics
- At list price, monthly cash flow is $-46 ($-558/yr) — negative.
- To cash-flow at today's rent, offer at most $122k (6.3% below list).
- Meets the 1% rule at list price ($2k rent vs $130k).
- Recommended offer: $118k (9.0% below list) — sets the bar for market timing.
Location & tenants
- Location reads 77/100 on livability (#206 in FL, #3,179 nationally) — a middle-class / working-renter tenant base. Strengths: cost of living A+, housing A+, health & safety A+; Watch: employment D+, amenities F, commute F.
- Polk (suburban): math 39% / reading 43% proficiency, ranked #62 of 73 in FL (top 85%) — families likely to look elsewhere, expect single-tenant / working-renter base with shorter leases.
- Zoned schools: Lincoln Avenue Academy (math 76% / reading 85%, grade A+, #104 of 2,144 statewide, top 5%, 526 students, 24% FRL) — zoned schools average 24% FRL vs 60% district-wide (36 pts lower); this property's tenant base skews higher-income than the district average.
- Zoned-school proficiency averages 80% at this address vs 41% district-wide (+40 pts) — the actual schools serving this property are materially stronger than the Polk average implies; a family-tenant draw the district grade alone would hide.
- Market conditions: Rents flat; 162 active listings in the ZIP; 25 comparable units currently listed for rent nearby; rentals at typical pace (median 23d on market — plan ~3-4 weeks tenant-placement turnaround); 10,384 units permitted in Polk County in 2024 (1,716 in 5+ unit buildings).
Forward outlook
- Local home prices are declining (-3.0%/yr); year-one equity from $898 of loan paydown is wiped out by about $4k of value loss. Plan a longer hold.
- Polk County population projected at +33% by 2050 — long-run rental-demand tailwind backs the buy-and-hold thesis.
Negotiation context
- It's been on market 93 days — a 9% lower offer ($118k) is reasonable based on typical stale-listing flexibility.
- 3 sale attempts with the ask held roughly flat each time — persistent listings suggest the price (not the market) is what's stuck; bring a comps-based counter.
Risks & watch-outs
- Watch-outs: HOA is 26% of rent.
- Climate carrying-cost: severe wind risk, 99% chance of damaging wind over 30y; extreme-heat days projected 7→24/yr by 2055 (HVAC capex compounding) — expect insurance premiums to compound above CPI over the hold.
Questions for the listing agent
- What do current leases actually rent for vs. the listed asking? Can we see a recent rent roll and the last 12 months of T-12 income?
- It's been on market 93 days. Have you received any prior offers? Is the seller open to a 9% concession, seller financing, or rate buy-down credit?
- Built in 1964 — when were the roof, HVAC, electrical panel, plumbing, and water heater last replaced?
- What does the HOA fee cover, when was the last increase, and are there any pending special assessments or reserve-fund shortfalls?
- Any open or pending special assessments — roof, HVAC, plumbing, elevator, façade? What's the per-unit balance and payoff schedule, and is the seller paying it off at close or rolling it to the buyer?
- Why hasn't it sold? Are there any deal-killer items the seller is aware of (foundation, flood, title, zoning, code violations)?
- Is there a deadline driving the sale (1031 exchange, divorce, estate, relocation)? That informs how much negotiation room exists.
- The area grade is low — what's the realistic commute time and amenity access for the typical tenant pool here? Any planned neighborhood developments (good or bad) we should know about?
- This sits on a lake — are riparian / water-frontage rights deeded with the parcel? Any dock permits, shoreline easements, or HOA water-use restrictions?
- What's the documented flood / surge / shoreline-erosion history here (FEMA AND non-FEMA — e.g., storm surge, creek backup, septic-field saturation)?
- Any water-quality or seasonal algae-bloom issues that affect tenant satisfaction or short-term-rental demand?
- What's the average days-on-market for RENTAL listings here right now (not sales)? A rising rental-DOM trend means longer vacancies and softer asking-rent achievability than the comps imply.
- What's the recent tenant-quality profile in this submarket — average credit score on applications, eviction rate, late-payment / NSF rate, and stable-employment percentage? A property-management company in the area should have these aggregated.
- How much new apartment / multifamily construction is in the pipeline within 1–3 miles? Heavy new supply (>2% of stock underway) typically softens rents 12–24 months out; light construction supports rent growth.
Investment metrics
- 1% rule
- 1.17% ✓
- Cap rate
- 5.86%
- Cash-on-cash
- -1.53%
- DSCR
- 0.93
- GRM
- 7.1
CMA / ARV
No comps found within radius.
Projected returns pro-forma
-3.0% appreciation · 0.77% rent growth · sell at horizon
- IRR
- -22.2%
- Equity multiple
- 0.25×
- Total profit
- $-27,100
- Equity at exit
- $19,369
- IRR
- -26.1%
- Equity multiple
- -0.09×
- Total profit
- $-39,507
- Equity at exit
- $11,231
Cash invested: $36,372 (down + closing). Projections, not guarantees.
Landlord ↔ Tenant lean methodology
- Overall (STATE)
- 87 Strongly Landlord-Friendly
- State Florida
- 87 Strongly Landlord-Friendly · R+3
- County
- — inherits STATE
- City
- — inherits STATE
ZIP-level market 33805
- Home prices YoY
- -29.8%
- Rents YoY
- 0.8%
- Active inventory
- 162
- Price-to-rent
- 7.1×
Monthly cashflow live
- Estimated rent
- $1,516 high interval (Pro) →
- Mortgage (P&I)
- −$681
- Tax from tax record
- −$115 /mo · $1,386/yr
- Insurance
- −$54
- HOA
- −$393
- Vacancy / Maint / Mgmt
- −$318
- Net cashflow
- $-46
Break-even live
UW: 25.0% down · 7.5% · 30yr · 1.5% tax · 5.0% vac · 8.0% maint · 8.0% mgmt
Financing live
Cash to close
- Down payment
- $32,475
- Closing costs
- $3,897
- Reserves months
- —
- Total cash needed
- —
Loan-product check · same deal, 3 products live
Conventional
25% down · 7.5% · 30yr
- Down + closing
- —
- Monthly P&I
- —
- Monthly cashflow
- —
- DSCR
- —
- Eligible?
- —
Personal DTI + credit; lowest rate.
DSCR
20% down · 8.5% · 30yr
- Down + closing
- —
- Monthly P&I
- —
- Monthly cashflow
- —
- DSCR
- —
- Eligible?
- —
No personal income docs; deal must DSCR.
Hard money
10% down · 12.0% · 12mo
- Down + closing
- —
- Monthly P&I
- —
- Monthly cashflow
- —
- DSCR
- —
- Eligible?
- —
Short-term bridge; refi at stabilization.
Rent comps 25 comps
| Address | Beds | Baths | Sqft | Rent | $/sqft | DOM | Units | Dist |
|---|---|---|---|---|---|---|---|---|
| 720 Lakehurst St Lakeland, FL | 3.0 | 2.0 | 1092 | $1,750 | $1.60 | 23d | 1 | 0.30mi |
| 617 Lakehurst St Lakeland, FL | 3.0 | 2.0 | 1100 | $1,900 | $1.73 | 19d | 1 | 0.30mi |
| 123 Oconee St Unit 1368863P Lakeland, FL | 2.0 | 1.0 | 990 | $2,441 | $2.47 | 11d | 1 | 0.66mi |
| 929 Gilmore Ave Lakeland, FL | 2.0 | 1.0–1.5 | 620 | $1,280 | $2.06 | 2d | 20 | 0.75mi |
| 1704 Martin L King Jr Ave Lakeland, FL | 2.0 | 2.0 | 1050 | $5,000 | $4.76 | 23d | 1 | 0.82mi |
| 310 Plum St Unit 7 Lakeland, FL | 2.0 | 1.0 | 850 | $1,200 | $1.41 | 23d | 1 | 0.86mi |
| 1031 N Florence Ave Unit NA Lakeland, FL | 3.0 | 2.0 | 1100 | $1,495 | $1.36 | 14d | 1 | 0.88mi |
| 921 E Parker St Lakeland, FL | 1.0 | 1.0 | 715 | $1,150 | $1.61 | 13d | 1 | 0.90mi |
| 408 Bassedena Cir N Lakeland, FL | 3.0 | 2.0 | 1075 | $1,825 | $1.70 | 23d | 1 | 0.91mi |
| 620 N Lake Ave Unit 3 Lakeland, FL | 2.0 | 1.0 | 760 | $1,175 | $1.55 | 14d | 1 | 0.94mi |
| 620 N Lake Ave Unit 2 Lakeland, FL | 2.0 | 1.0 | 760 | $1,100 | $1.45 | 3d | 1 | 0.94mi |
| 609 N Stella Ave Apt A Lakeland, FL | 2.0 | 1.0 | 735 | $1,100 | $1.50 | 23d | 1 | 0.97mi |
| 321 Emma St Lakeland, FL | 2.0 | 1.0 | 730 | $1,395 | $1.91 | 23d | 1 | 1.01mi |
| 711 N Virginia Ave Lakeland, FL | 2.0 | 1.0 | 780 | $1,100 | $1.41 | 23d | 1 | 1.02mi |
| 131 Pear St Lakeland, FL | 2.0 | 1.0 | 741 | $950 | $1.28 | 23d | 1 | 1.04mi |
| 820 W 13th St Lakeland, FL | 2.0 | 1.0 | 950 | $1,300 | $1.37 | 23d | 1 | 1.06mi |
| 1216 E Myrtle St Lakeland, FL | 3.0 | 1.0 | 864 | $1,450 | $1.68 | 23d | 1 | 1.06mi |
| 454 King Edward Ave Lakeland, FL | 2.0 | 2.0 | 1048 | $1,399 | $1.33 | 2d | 1 | 1.13mi |
| 600 E Bay St Lakeland, FL | 3.0 | 1.0–2.0 | 914 | $2,166 | $2.37 | 3d | 29 | 1.19mi |
| 270 E Bay St Lakeland, FL | 2.0 | 1.0–2.0 | 892 | $1,725 | $1.93 | 3d | 6 | 1.24mi |
| 125 N Kentucky Ave #307 Lakeland, FL | 1.0 | 1.5 | 911 | $3,550 | $3.90 | 23d | 1 | 1.36mi |
| 3215 Baird Ave Lakeland, FL | 1.0–2.0 | 1.0 | 794 | $1,250 | $1.57 | 13d | 4 | 1.39mi |
| 130 S Massachusetts Ave Lakeland, FL | 1.0 | 1.0 | 580 | $1,400 | $2.41 | 3d | 8 | 1.47mi |
| 915 E Lemon St Lakeland, FL | 2.0 | 1.5 | 962 | $1,599 | $1.66 | 23d | 1 | 1.49mi |
| 923 E Lemon St Lakeland, FL | 2.0 | 1.5 | 962 | $1,599 | $1.66 | 23d | 1 | 1.49mi |
HOA detail condo
- Monthly dues
- $393 · $4,716/yr
- Likely covers
- electricpool
- Assessments
- None detected in remarks — confirm with the listing agent.
Listing history 20 events
-
2026-06-18days on market $129,900 Active 93 DOM
-
2026-06-17days on market $129,900 Active 92 DOM
-
2026-06-16days on market $129,900 Active 91 DOM
-
2026-06-15days on market $129,900 Active 90 DOM
-
2026-06-13days on market $129,900 Active 88 DOM
-
2026-06-10days on market $129,900 Active 85 DOM
-
2026-06-09days on market $129,900 Active 84 DOM
-
2026-06-08days on market $129,900 Active 83 DOM
-
2026-06-07days on market $129,900 Active 82 DOM
-
2026-06-05days on market $129,900 Active 79 DOM
-
2026-06-03days on market $129,900 Active 78 DOM
-
2026-06-03days on market $129,900 Active 77 DOM
-
2026-06-01days on market $129,900 Active 76 DOM
-
2026-05-31days on market $129,900 Active 75 DOM
-
2026-03-17$129,900 Active
-
2025-08-10status Active
-
2025-08-01status Pending
-
2025-07-02price $139,900
-
2025-04-08price $144,000
-
2025-02-05$149,000 Active
ⓘ Source: listings_history table (triggers on properties + properties_extension) + one-shot
backfill from property_details.listing_events for pre-trigger history.
Tax reassessment forecast FL · Resets to sale price
- Current annual tax
- $1,386 · $115/mo
- Projected year-2 tax
- $1,386 · $115/mo
- Expected delta
- $0/yr ($0/mo · 0.0%)
ⓘ Screening estimate from a state-policy table — verify with the county assessor before closing.
Climate risk First Street
- Flood 1/10 Low FEMA zone X (unshaded) · 0% chance over 30 yrs
- Wildfire 3/10 Moderate
- Heat 8/10 Severe 7 d/yr ≥108°F today · 24 d/yr by 30 yrs out
- Wind 10/10 Extreme 99% chance of damaging wind over 30 yrs
- Air quality 2/10 Low 1 unhealthy d/yr today · 2 by 30 yrs out
Nearby sold comps map
Loading sold comps map…
Walkable amenities ~0.75 mi
Loading nearby amenities…
Taxation est. · year 1
- Rental income
- $18,187
- − Mortgage interest
- −$7,276
- − Property taxes
- −$1,386
- − Insurance
- −$650
- − Repairs & maintenance
- −$1,455
- − Management
- −$1,455
- − HOA
- −$4,716
- − Depreciation
- −$3,779
- Taxable loss
- −$2,529
- Est. tax savings @ 24.0%
- +$607
- After-tax cash flow
- $49/yr
For passive investors: Depreciation is non-cash, so a rental often shows a tax loss while cash-flowing — sheltering income. Rental losses are passive: they offset passive income freely, and up to $25,000/yr can offset ordinary (W-2) income if you actively participate and your MAGI is under $100k (phasing out to $0 by $150k); unused losses carry forward. On sale, claimed depreciation is recaptured at up to 25%, and gains may owe capital-gains tax (a 1031 exchange can defer both). Figures are a year-1 estimate at your 24.0% rate — not tax advice; consult a CPA.
Schools (NCES district)
- District
- Polk
- NCES district ID
- 1201590
- Math proficiency
- 39% ▼ -11.00%
- Reading proficiency
- 43% ▼ -4.00%
- Median HH income
- $43,979
- Composite
- 34.74/100
- National rank
- #5132
- State rank
- #62 of 73 in FL
Livability — Lakeland
- Score
- 77/100
- State rank
- #206
- US rank
- #3179
Category grades
Schools grade is shown separately in the Schools card above.
Census & demographics
- Census place
- Lakeland, FL
- County
- Polk County · 740,051 people
- City population
- 277,690
- Metro
- Lakeland-Winter Haven, FL
- Population (ZIP)
- 28,751
- Household income
- $62,661
- Rent vs Own
- Severe rent burden
- 1179.0
Population outlook (Polk County) Hauer SSP2
- Today (2025)
- 752,975 people
- By 2030
- 804,621 · +6.9%
- By 2040
- 906,117 · +20.3%
- By 2050
- 1,000,476 · +32.9%
- By 2075
- 1,197,520 · +59.0%
- By 2100
- 1,271,518 · +68.9%
Race, ethnicity, and origin ACS 2023
- Neighborhood character
- Diverse neighborhood (Simpson 0.68)
- Race & ethnicity
- White 38% Black 37% Hispanic / Latino 20% Two or more races 8% Asian 1%
- Hispanic origin (detail)
- Mexican 5% Puerto Rican 9% Cuban 2%
- Common ancestry
- Hispanic 2% Lithuanian 1% Romanian 1%
- Foreign-born
- 12% · Canada, Jamaica
- Languages at home
- 79% English-only · Spanish 16% French/Haitian/Cajun 2% Other Asian/Pacific 1%
Political lean MEDSL · Polk
- 2024 margin
- Strong R (+20.7) · D 39.2% · R 59.9%
- 2008→2024 swing
- -14.6pp toward R · 2008: -6.1pp · 2024: -20.7pp
- All cycles
- 2024: R+20.7 2020: R+14.4 2016: R+14.1 2012: R+6.8 2008: R+6.1
Not yet ingested
- Civics
- —
Market trends
- HPI YoY
- ▼ -158.44%
- Current HPI
- 372.7317
- Rent YoY
- ▲ 0.77%
- Metro
- Lakeland-Winter Haven, FL
- State GDP YoY
- ▲ 3.28%
- F500 in state
- 36
Industry mix (Fortune 500 HQ in FL)
| Industry | F500 HQs | Revenue |
|---|---|---|
| Industrial Technology | 2 | $29B |
|
||
| Insurance | 2 | $17B |
|
||
| Retail | 1 | $60B |
|
||
| Technology Distribution | 1 | $58B |
|
||
| Homebuilding | 1 | $35B |
|
||
| Technology Manufacturing | 1 | $35B |
|
||
Price history
-12.8% since first listed6 events — show timeline
- 2026-03-17 Listed $129,900 Stellar MLS as Distributed by MLS Grid
- 2025-08-10 Relisted — Stellar MLS as Distributed by MLS Grid
- 2025-08-01 Pending — Stellar MLS as Distributed by MLS Grid
- 2025-07-02 Price Changed $139,900 Stellar MLS as Distributed by MLS Grid
- 2025-04-08 Price Changed $144,000 Stellar MLS as Distributed by MLS Grid
- 2025-02-05 Listed $149,000 Stellar MLS as Distributed by MLS Grid
Property tax history
+5.4%/yrLatest (2025): $1,386 · +2.8% YoY. Source: county tax records.
Cash-flow waterfall
monthlySold comps — $/sqft
last 12 mo · ≤1 miLoading sold comps…