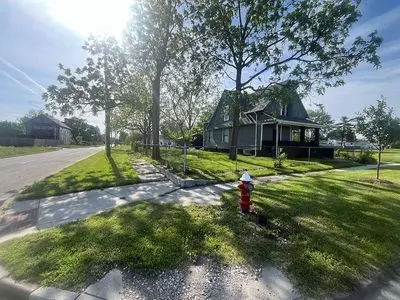
905 Montrose Ave · Toledo, OH
Flood risk 1/10 · Minimal
- FEMA flood zone
- X (unshaded)
- Chance of flooding over 30 yrs
- 0.0%
- Est. flood insurance / yr
- $473 – $860
Fire risk 1/10 · Minimal
- Est. fire insurance / yr
- $713 – $1,323
Heat risk 3/10 · Minor
- Hot days now (above 101°F)
- 7 days/yr
- Hot days in 30 yrs
- 16 days/yr
Wind risk 2/10 · Minimal
- Chance of severe wind over 30 yrs
- —
Air-quality risk 2/10 · Minimal
- Unhealthy air days now
- 1 days/yr
- Unhealthy air days in 30 yrs
- 2 days/yr
Risk factors via First Street. Map © Google.
Why this score? — see what drove the C+ grade
The composite is a weighted blend of 9 inputs, each scored 0–100. Each bar is that input's sub-score; the figure is the points it added to the 100-point composite (weight × sub-score).
- Cash flow +30.0/30.0
- 1% rule +10.0/10.0
- DSCR +10.0/10.0
- Rent growth +4.5/5.0
- Livability +3.3/5.0
- Condition / age +2.5/5.0
- Schools +1.6/10.0
- ARV discount +0.3/15.0
- Appreciation +0.0/10.0
$79,000
🖨 Deal sheet 📄 Offer letter ✓ Due diligence
Listing remarks
FOR SALE BY OWNER & acirc; & euro; & ldquo; 905 Montrose Ave, Toledo, OH 43607 $92,000 | Serious Inquiries Only Spacious 3 bedroom, 2 full bath home located on a large corner lot and currently the only home on the block in a neighborhood growing positively. This home features a full basement with storage room, 2-car garage, fresh paint throughout, and major updates already completed including roof replacement (2021), plumbing (2021), electric serviced (2021), and hot water tank (2024). Upstairs bathroom has been remodeled. Main floor bathroom is outdated. Selling AS-IS & acirc; & euro; & rdquo; seller will make no further repairs. Great opportunity for a homeowne
Key facts
- Plumbing
- Full basement
- Roof replacement
Tags
Property features AI
Exterior
- Home design: Built in 1919; Living area approximately 1,583
- Construction: Original construction from 1919
- Exterior features: Located in the Scott Park subdivision
Interior
- Bedrooms: Living area includes multiple bedrooms (total living area 1,583)
- Interior features: Original 1919 character (year built 1919)
Neighborhood map
What this means for you Summary
Snapshot
- This is a 3-bed/2.0-bath single-family listed at $79k.
Deal economics
- At list price, monthly cash flow is $438 ($5k/yr) — positive.
- The deal already cash-flows at list — no discount required.
- Meets the 1% rule at list price ($1k rent vs $79k).
- Recommended offer: $78k (1.5% below list) — sets the bar for market timing.
- Cap rate 12.9% vs local median 7.6% in Toledo — top-decile yield for the area; either an underpriced asset or a hidden risk that comps aren't pricing in. Stress-test before assuming the spread holds.
Location & tenants
- Location reads 66/100 on livability (#645 in OH) — a middle-class / working-renter tenant base. Strengths: cost of living A+, housing A+, health & safety A+; Watch: amenities C-, schools D-, crime F.
- Toledo City (urban): math 15% / reading 24% proficiency, ranked #634 of 656 in OH (top 97%) — low school quality limits family demand, transient renter base, plan for 1-2y turnover; 72% free/reduced lunch — lower-income household profile, screen leases tightly.
- Market conditions: Rents rising fast (+8.2%/yr); 83 active listings in the ZIP; 13 comparable units currently listed for rent nearby; rentals lingering (median 44d on market — plan ~5-8 weeks vacancy on turnover, expect pricing pressure); 69% of comp listings sitting > 30 days — soft ceiling on asking rent; lower-income renter base — watch delinquency; 415 units permitted in Lucas County in 2024 (122 in 5+ unit buildings).
- This rent runs 36% of the median local income ($41k/yr) — at the standard rent-burdened threshold; future hikes will face affordability resistance.
Forward outlook
- Local home prices are declining (-3.0%/yr); year-one equity from $546 of loan paydown is wiped out by about $2k of value loss. Plan a longer hold.
- Lucas County population projected at -16% by 2050 — secular population decline; favor cash flow + early exit over multi-decade hold.
- At projected returns (-3.0% appreciation + 8.0% rent growth), your $22k cash investment doubles in ~5 years — after that, you're playing with house money.
Negotiation context
- It's been on market 22 days — a 2% lower offer ($78k) is reasonable based on typical stale-listing flexibility.
Risks & watch-outs
- Watch-outs: built in 1919 — expect roof / HVAC / electrical / plumbing capex.
Questions for the listing agent
- Built in 1919 — when were the roof, HVAC, electrical panel, plumbing, and water heater last replaced?
- Is there a deadline driving the sale (1031 exchange, divorce, estate, relocation)? That informs how much negotiation room exists.
- Schools are D-rated, which usually means shorter tenancies and higher turnover. Who's the typical renter profile here, and what's been the actual vacancy rate?
- Crime grade is F in this area — have there been break-ins, vandalism, or insurance claims at this property in the last 3 years? What carrier currently insures it and at what premium?
- What's the average days-on-market for RENTAL listings here right now (not sales)? A rising rental-DOM trend means longer vacancies and softer asking-rent achievability than the comps imply.
- What's the recent tenant-quality profile in this submarket — average credit score on applications, eviction rate, late-payment / NSF rate, and stable-employment percentage? A property-management company in the area should have these aggregated.
- How much new for-sale + rental construction is in the pipeline within 1–3 miles? Heavy new supply typically softens prices + rents 12–24 months out; constrained supply supports both.
Investment metrics
- 1% rule
- 1.57% ✓
- Cap rate
- 12.95%
- Cash-on-cash
- 23.77%
- DSCR
- 2.06
- GRM
- 5.3
CMA / ARV
- ARV (on-the-fly)
- $68,069
- Comps found
- 12
Show comp detail 12 sales within ~0.75 mi
| Address | Dist | Beds/Ba | Sqft | Sold | Price | $/sf | Match |
|---|---|---|---|---|---|---|---|
| 1131 Montrose Ave | 0.17mi | 3/1.0 | 1,642 (+4%) | 6mo | $35,000 | $21 | 76 |
| 1116 Woodstock Ave | 0.20mi | 3/2.0 | 1,694 (+7%) | 4mo | $72,000 | $43 | 76 |
| 1513 Waverly Ave | 0.41mi | 3/1.5 | 1,578 (-0%) | 7mo | $123,400 | $78 | 73 |
| 1938 Fernwood Ave | 0.38mi | 3/1.0 | 1,502 (-5%) | 3mo | $95,900 | $64 | 68 |
| 1424 Addington Rd | 0.36mi | 3/1.5 | 1,726 (+9%) | 3mo | $153,198 | $89 | 64 |
| 834 N Detroit Ave | 0.49mi | 4/1.0 (+1) | 1,552 (-2%) | 5mo | $35,000 | $23 | 61 |
| 630 Polonia Ct | 0.62mi | 3/1.5 | 1,510 (-5%) | 2mo | $140,000 | $93 | 60 |
| 1652 Nebraska Ave | 0.36mi | 2/1.0 (-1) | 1,443 (-9%) | 2mo | $40,000 | $28 | 58 |
| 1675 Nebraska Ave | 0.34mi | 2/1.0 (-1) | 1,419 (-10%) | 1mo | $35,000 | $25 | 56 |
| 1434 Nebraska Ave | 0.63mi | 3/1.0 | 1,666 (+5%) | 6mo | $50,000 | $30 | 53 |
| 1527 Tecumseh St | 0.57mi | 4/1.5 (+1) | 1,510 (-5%) | 9mo | $28,500 | $19 | 51 |
| 1812 Joffre Ave | 0.59mi | 4/2.0 (+1) | 1,450 (-8%) | 7mo | $95,927 | $66 | 48 |
Match score weights: distance 35% · size 25% · config 20% · recency 20%. Top-matched comps best support the ARV.
Projected returns pro-forma
-3.0% appreciation · 8.0% rent growth · sell at horizon
- IRR
- 22.4%
- Equity multiple
- 1.98×
- Total profit
- $21,654
- Equity at exit
- $11,779
- IRR
- 33.5%
- Equity multiple
- 4.82×
- Total profit
- $84,589
- Equity at exit
- $6,830
Cash invested: $22,120 (down + closing). Projections, not guarantees.
Landlord ↔ Tenant lean methodology
- Overall (STATE)
- 73 Landlord-Friendly
- State Ohio
- 73 Landlord-Friendly · R+6
- County
- — inherits STATE
- City
- — inherits STATE
ZIP-level market 43607
- Home prices YoY
- -27.5%
- Rents YoY
- 8.2%
- Active inventory
- 83
- Price-to-rent
- 5.3×
Monthly cashflow live
- Estimated rent
- $1,237 high interval (Pro) →
- Mortgage (P&I)
- −$414
- Tax from tax record
- −$91 /mo · $1,098/yr
- Insurance
- −$33
- HOA
- −$0
- Vacancy / Maint / Mgmt
- −$260
- Net cashflow
- $438
Break-even live
UW: 25.0% down · 7.5% · 30yr · 1.5% tax · 5.0% vac · 8.0% maint · 8.0% mgmt
Financing live
Cash to close
- Down payment
- $19,750
- Closing costs
- $2,370
- Reserves months
- —
- Total cash needed
- —
Loan-product check · same deal, 3 products live
Conventional
25% down · 7.5% · 30yr
- Down + closing
- —
- Monthly P&I
- —
- Monthly cashflow
- —
- DSCR
- —
- Eligible?
- —
Personal DTI + credit; lowest rate.
DSCR
20% down · 8.5% · 30yr
- Down + closing
- —
- Monthly P&I
- —
- Monthly cashflow
- —
- DSCR
- —
- Eligible?
- —
No personal income docs; deal must DSCR.
Hard money
10% down · 12.0% · 12mo
- Down + closing
- —
- Monthly P&I
- —
- Monthly cashflow
- —
- DSCR
- —
- Eligible?
- —
Short-term bridge; refi at stabilization.
Rent comps 13 comps
| Address | Beds | Baths | Sqft | Rent | $/sqft | DOM | Units | Dist |
|---|---|---|---|---|---|---|---|---|
| 915 Woodstock Ave Toledo, OH | 3.0 | 1.5 | 1500 | $1,100 | $0.73 | 23d | 1 | 0.15mi |
| 319 N Detroit Ave Toledo, OH | 3.0 | 1.0 | 1341 | $845 | $0.63 | 43d | 1 | 0.49mi |
| 2117 Clinton St Toledo, OH | 3.0 | 1.0 | 1256 | $1,115 | $0.89 | 43d | 1 | 0.95mi |
| 1122 Pinewood Ave Toledo, OH | 3.0 | 1.0 | 1559 | $1,150 | $0.74 | 13d | 1 | 1.01mi |
| 2037 Alvin St Toledo, OH | 3.0 | 1.0 | 1260 | $1,175 | $0.93 | 43d | 1 | 1.03mi |
| 1140 Palmwood Ave Toledo, OH | 3.0 | 1.0 | 1292 | $1,500 | $1.16 | 43d | 1 | 1.03mi |
| 2314 Airline Ave Toledo, OH | 3.0 | 1.0 | 1123 | $1,478 | $1.32 | 23d | 1 | 1.10mi |
| 2637 Greenway St Toledo, OH | 2.0 | 1.0 | 1082 | $900 | $0.83 | 43d | 1 | 1.17mi |
| 1026 Oakwood Ave Toledo, OH | 2.0 | 1.0 | 1100 | $850 | $0.77 | 43d | 1 | 1.29mi |
| 2356 Torrey Hill Dr Unit 11 Toledo, OH | 2.0 | 1.0 | 1050 | $800 | $0.76 | 43d | 1 | 1.33mi |
| 1321 Gordon St Toledo, OH | 3.0 | 1.0 | 1121 | $1,050 | $0.94 | 43d | 1 | 1.38mi |
| 523 Nicholas St Toledo, OH | 3.0 | 1.0 | 1290 | $1,350 | $1.05 | 13d | 1 | 1.43mi |
| 532 Carlton St Toledo, OH | 3.0 | 1.0 | 1130 | $1,050 | $0.93 | 43d | 1 | 1.46mi |
Listing history 17 events
-
2026-06-18days on market $79,000 Active 22 DOM
-
2026-06-17days on market $79,000 Active 21 DOM
-
2026-06-16days on market $79,000 Active 20 DOM
-
2026-06-16price $79,000 Active 19 DOM
-
2026-06-15days on market $92,000 Active 19 DOM
-
2026-06-14days on market $92,000 Active 17 DOM
-
2026-06-10days on market $92,000 Active 14 DOM
-
2026-06-09days on market $92,000 Active 13 DOM
-
2026-06-08days on market $92,000 Active 12 DOM
-
2026-06-07days on market $92,000 Active 11 DOM
-
2026-06-05days on market $92,000 Active 8 DOM
-
2026-06-03days on market $92,000 Active 7 DOM
-
2026-06-02days on market $92,000 Active 6 DOM
-
2026-06-01days on market $92,000 Active 5 DOM
-
2026-05-31days on market $92,000 Active 4 DOM
-
2026-05-30days on market $92,000 Active 3 DOM
-
2026-05-28$92,000 Active
ⓘ Source: listings_history table (triggers on properties + properties_extension) + one-shot
backfill from property_details.listing_events for pre-trigger history.
Tax reassessment forecast OH · Partial reset (capped growth)
- Current annual tax
- $1,098 · $91/mo
- Projected year-2 tax
- $1,165 · $97/mo
- Expected delta
- +$67/yr (+$6/mo · 6.1%)
ⓘ Screening estimate from a state-policy table — verify with the county assessor before closing.
Climate risk First Street
- Flood 1/10 Low FEMA zone X (unshaded) · 0% chance over 30 yrs
- Wildfire 1/10 Low
- Heat 3/10 Moderate 7 d/yr ≥101°F today · 16 d/yr by 30 yrs out
- Wind 2/10 Low
- Air quality 2/10 Low 1 unhealthy d/yr today · 2 by 30 yrs out
Nearby sold comps map
Loading sold comps map…
Walkable amenities ~0.75 mi
Loading nearby amenities…
Taxation est. · year 1
- Rental income
- $14,838
- − Mortgage interest
- −$4,425
- − Property taxes
- −$1,098
- − Insurance
- −$395
- − Repairs & maintenance
- −$1,187
- − Management
- −$1,187
- − Depreciation
- −$2,298
- Taxable income
- $4,248
- Est. tax owed @ 24.0%
- −$1,019
- After-tax cash flow
- $4,238/yr
For passive investors: Depreciation is non-cash, so a rental often shows a tax loss while cash-flowing — sheltering income. Rental losses are passive: they offset passive income freely, and up to $25,000/yr can offset ordinary (W-2) income if you actively participate and your MAGI is under $100k (phasing out to $0 by $150k); unused losses carry forward. On sale, claimed depreciation is recaptured at up to 25%, and gains may owe capital-gains tax (a 1031 exchange can defer both). Figures are a year-1 estimate at your 24.0% rate — not tax advice; consult a CPA.
Schools (NCES district)
- District
- Toledo City
- NCES district ID
- 3904490
- Math proficiency
- 15% ▼ -16.00%
- Reading proficiency
- 24% ▼ -13.00%
- Median HH income
- $32,137
- Composite
- 15.76/100
- National rank
- #9276
- State rank
- #634 of 656 in OH
Livability — Toledo
- Score
- 66/100
- State rank
- #645
- US rank
- #11442
Category grades
Schools grade is shown separately in the Schools card above.
Census & demographics
- Census place
- Toledo, OH
- County
- Lucas County · 380,724 people
- City population
- 280,811
- Metro
- Toledo, OH
- Population (ZIP)
- 19,469
- Household income
- $41,335
- Rent vs Own
- Severe rent burden
- 1157.0
Population outlook (Lucas County) Hauer SSP2
- Today (2025)
- 420,751 people
- By 2030
- 410,187 · -2.5%
- By 2040
- 384,019 · -8.7%
- By 2050
- 355,125 · -15.6%
- By 2075
- 291,683 · -30.7%
- By 2100
- 233,670 · -44.5%
Race, ethnicity, and origin ACS 2023
- Neighborhood character
- Diverse neighborhood (Simpson 0.57)
- Race & ethnicity
- Black 59% White 27% Two or more races 6% Hispanic / Latino 6% Asian 3%
- Hispanic origin (detail)
- Mexican 3% Puerto Rican 2%
- Common ancestry
- Lithuanian 2% Romanian 2% Slovak 1%
- Foreign-born
- 4% · Canada
- Languages at home
- 94% English-only · Other Indo-European 1% Spanish 1% Russian/Polish/Slavic 1%
Political lean MEDSL · Lucas
- 2024 margin
- D (+12.6) · D 55.8% · R 43.2%
- 2008→2024 swing
- -18.9pp toward R · 2008: 31.4pp · 2024: 12.6pp
- All cycles
- 2024: D+12.6 2020: D+16.8 2016: D+17.4 2012: D+30.4 2008: D+31.4
Not yet ingested
- Civics
- —
Market trends
- HPI YoY
- ▼ -66.58%
- Current HPI
- 175.2772
- Rent YoY
- ▲ 8.19%
- Metro
- Toledo, OH
- State GDP YoY
- ▲ 1.98%
- F500 in state
- 48
Industry mix (Fortune 500 HQ in OH)
| Industry | F500 HQs | Revenue |
|---|---|---|
| Insurance | 3 | $145B |
|
||
| Industrial Machinery | 3 | $49B |
|
||
| Financial Services | 3 | $24B |
|
||
| Consumer Goods | 2 | $93B |
|
||
| Aerospace / Defense | 2 | $47B |
|
||
| Utilities | 2 | $33B |
|
||
Price history
1 event — show timeline
- 2026-05-28 Listed $92,000 FSBO.com
Property tax history
+1.0%/yrLatest (2025): $1,098 · -2.9% YoY. Source: county tax records.
Cash-flow waterfall
monthlySold comps — $/sqft
last 12 mo · ≤1 miLoading sold comps…