W 98th Ave · Vero Lake Estates, FL
Flood risk No data
- FEMA flood zone
- —
- Chance of flooding over 30 yrs
- —
- Est. flood insurance / yr
- —
Fire risk No data
- Est. fire insurance / yr
- —
Heat risk No data
- Hot days now (above threshold)
- —
- Hot days in 30 yrs
- —
Wind risk No data
- Chance of severe wind over 30 yrs
- —
Air-quality risk No data
- Unhealthy air days now
- —
- Unhealthy air days in 30 yrs
- —
Risk factors via First Street. Map © Google.
Why this score? — see what drove the D grade
The composite is a weighted blend of 9 inputs, each scored 0–100. Each bar is that input's sub-score; the figure is the points it added to the 100-point composite (weight × sub-score).
- Cash flow +12.0/30.0
- ARV discount +10.8/15.0
- Schools +4.2/10.0
- Condition / age +4.0/5.0
- DSCR +3.6/10.0
- 1% rule +3.5/10.0
- Livability +2.5/5.0
- Rent growth +2.2/5.0
- Appreciation +0.0/10.0
$274,900
🖨 Deal sheet 📄 Offer letter ✓ Due diligence
Listing remarks
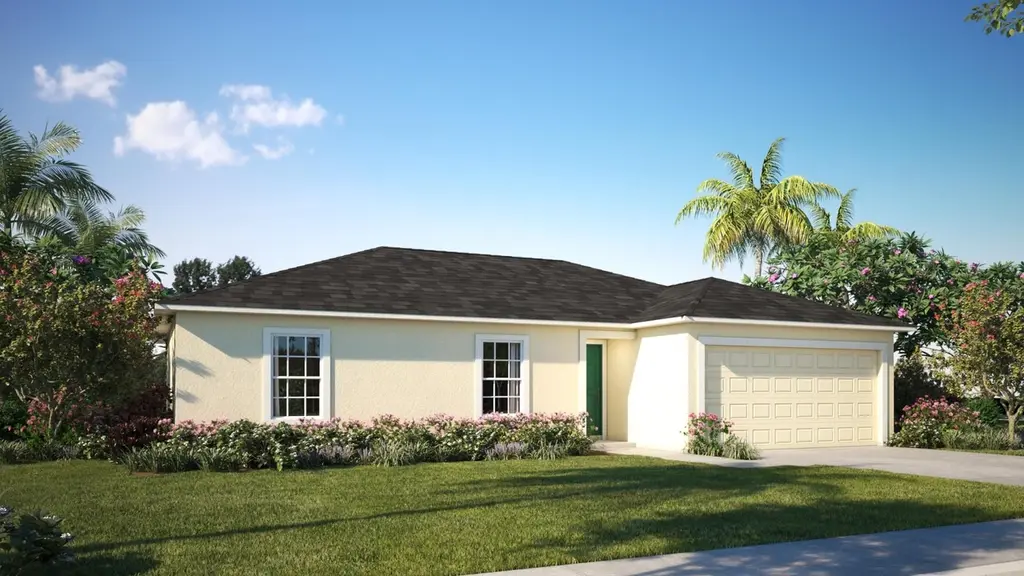
Welcome to The Poinsettia - Cozy, Smart Living Designed for You Discover The Poinsettia, a charming 3-bedroom home with a thoughtfully designed layout that feels spacious and inviting from the moment you step through the front porch and into the foyer. Two bedrooms are situated at the front of the home, while the owner's suite is tucked away at the back, offering privacy along with a walk-in closet and a private bathroom retreat. The open kitchen flows seamlessly into the dining nook and great room, maximizing every inch of this efficient 1,273-square-foot floor plan. Perfect for downsizers or those just starting their family, The Poinsettia offers all the comforts of home without any waste
Key facts
- 2 garage spots
- Built 2026
- Listed 18 days
Property features AI
Finance
- Other: Listing status: Active; Last modified: 2026-05-22
- Financial info: List price $274,900
Exterior
- Parking: 2 total parking spaces; 2-car garage
- Home design: Spec new-construction plan named Poinsettia
- Exterior features: Located on W 98th Ave, Vero Beach, FL
Interior
- Bedrooms: 3 bedrooms
- Bathrooms: 2 bathrooms (both full)
- Interior features: Living area of 1,237 (living area value provided)
Neighborhood map
What this means for you Summary
Snapshot
- This is a 3-bed/2.0-bath single-family listed at $275k. Condition is rated good.
Deal economics
- At list price, monthly cash flow is $-63 ($-761/yr) — negative.
- To cash-flow at today's rent, offer at most $266k (3.3% below list).
- To meet the 1% rule (rent ≥ 1% of price), the offer needs to be $232k (15.4% below list).
- Recommended offer: $232k (15.4% below list) — sets the bar for 1% rule.
- Cap rate 6.0% vs local median 4.9% in Vero Lake Estates — meaningfully above typical; check what's discounted (condition, days-on-market, listing class) to confirm the premium yield is real.
Location & tenants
- Location reads: area grade D — affects rentability + tenant quality, not the cash-flow math above.
- Indian River (other): math 48% / reading 52% proficiency, ranked #35 of 73 in FL (top 48%) — acceptable for families but not a draw, mixed tenant base, ~2y average lease.
- Market conditions: Rents soft (-1.2%/yr); 612 active listings in the ZIP; 5 comparable units currently listed for rent nearby; rentals at typical pace (median 22d on market — plan ~3-4 weeks tenant-placement turnaround); solid renter incomes; 564 units permitted in Indian River County in 2024 (281 in 5+ unit buildings).
- This rent runs 36% of the median local income ($78k/yr) — at the standard rent-burdened threshold; future hikes will face affordability resistance.
Forward outlook
- Local home prices are declining (-3.0%/yr); year-one equity from $2k of loan paydown is wiped out by about $8k of value loss. Plan a longer hold.
- Indian River County population projected at +18% by 2050 — long-run rental-demand tailwind backs the buy-and-hold thesis.
Negotiation context
- It's been on market 19 days — a 2% lower offer ($271k) is reasonable based on typical stale-listing flexibility.
Questions for the listing agent
- What do current leases actually rent for vs. the listed asking? Can we see a recent rent roll and the last 12 months of T-12 income?
- Is there a deadline driving the sale (1031 exchange, divorce, estate, relocation)? That informs how much negotiation room exists.
- The area grade is low — what's the realistic commute time and amenity access for the typical tenant pool here? Any planned neighborhood developments (good or bad) we should know about?
- What's the average days-on-market for RENTAL listings here right now (not sales)? A rising rental-DOM trend means longer vacancies and softer asking-rent achievability than the comps imply.
- What's the recent tenant-quality profile in this submarket — average credit score on applications, eviction rate, late-payment / NSF rate, and stable-employment percentage? A property-management company in the area should have these aggregated.
- How much new for-sale + rental construction is in the pipeline within 1–3 miles? Heavy new supply typically softens prices + rents 12–24 months out; constrained supply supports both.
Investment metrics
- 1% rule
- 0.85% ✗
- Cap rate
- 6.02%
- Cash-on-cash
- -0.99%
- DSCR
- 0.96
- GRM
- 9.9
CMA / ARV
- ARV (on-the-fly)
- $296,880
- Comps found
- 12
Show comp detail 12 sales within ~0.75 mi
| Address | Dist | Beds/Ba | Sqft | Sold | Price | $/sf | Match |
|---|---|---|---|---|---|---|---|
| 8436 99th Ct | 0.16mi | 3/2.0 | 1,270 (+3%) | 3mo | $338,900 | $267 | 86 |
| 8236 97th Ave | 0.30mi | 3/2.0 | 1,263 (+2%) | 3mo | $286,000 | $226 | 80 |
| 8646 98th Ct | 0.26mi | 3/2.0 | 1,192 (-4%) | 4mo | $280,000 | $235 | 79 |
| 8725 98th Ct | 0.35mi | 3/2.0 | 1,270 (+3%) | 2mo | $332,900 | $262 | 78 |
| 8616 101st Ct | 0.47mi | 3/2.0 | 1,263 (+2%) | 4mo | $280,000 | $222 | 72 |
| 8825 100th Ct | 0.57mi | 3/2.0 | 1,263 (+2%) | 2mo | $294,990 | $234 | 68 |
| 8616 102nd Ct | 0.58mi | 3/2.0 | 1,263 (+2%) | 4mo | $280,000 | $222 | 66 |
| 8025 96th Ct | 0.55mi | 3/2.0 | 1,263 (+2%) | 6mo | $299,990 | $238 | 66 |
| 8266 102nd Ave | 0.53mi | 2/2.0 (-1) | 1,144 (-8%) | 1mo | $275,000 | $240 | 57 |
| 10080 87th St | 0.49mi | 3/2.0 | 1,400 (+13%) | 2mo | $356,000 | $254 | 54 |
| 8060 96 Ave | 0.54mi | 3/2.0 | 1,392 (+12%) | 8mo | $335,000 | $241 | 48 |
| 8060 96th Ave | 0.54mi | 3/2.0 | 1,392 (+12%) | 8mo | $335,000 | $241 | 47 |
Match score weights: distance 35% · size 25% · config 20% · recency 20%. Top-matched comps best support the ARV.
Projected returns pro-forma
-3.0% appreciation · 0.0% rent growth · sell at horizon
- IRR
- -21.3%
- Equity multiple
- 0.28×
- Total profit
- $-55,363
- Equity at exit
- $40,988
- IRR
- -24.1%
- Equity multiple
- -0.03×
- Total profit
- $-79,596
- Equity at exit
- $23,768
Cash invested: $76,972 (down + closing). Projections, not guarantees.
Landlord ↔ Tenant lean methodology
- Overall (STATE)
- 87 Strongly Landlord-Friendly
- State Florida
- 87 Strongly Landlord-Friendly · R+3
- County
- — inherits STATE
- City
- — inherits STATE
ZIP-level market 32967
- Home prices YoY
- -24.4%
- Rents YoY
- -1.2%
- Active inventory
- 612
- Price-to-rent
- 9.9×
Monthly cashflow live
- Estimated rent
- $2,324 high interval (Pro) →
- Mortgage (P&I)
- −$1,442
- Tax est. 1.5%
- −$344 /mo · $4,124/yr
- Insurance
- −$115
- HOA
- −$0
- Vacancy / Maint / Mgmt
- −$488
- Net cashflow
- $-63
Break-even live
UW: 25.0% down · 7.5% · 30yr · 1.5% tax · 5.0% vac · 8.0% maint · 8.0% mgmt
Financing live
Cash to close
- Down payment
- $68,725
- Closing costs
- $8,247
- Reserves months
- —
- Total cash needed
- —
Loan-product check · same deal, 3 products live
Conventional
25% down · 7.5% · 30yr
- Down + closing
- —
- Monthly P&I
- —
- Monthly cashflow
- —
- DSCR
- —
- Eligible?
- —
Personal DTI + credit; lowest rate.
DSCR
20% down · 8.5% · 30yr
- Down + closing
- —
- Monthly P&I
- —
- Monthly cashflow
- —
- DSCR
- —
- Eligible?
- —
No personal income docs; deal must DSCR.
Hard money
10% down · 12.0% · 12mo
- Down + closing
- —
- Monthly P&I
- —
- Monthly cashflow
- —
- DSCR
- —
- Eligible?
- —
Short-term bridge; refi at stabilization.
Rent comps 5 comps
| Address | Beds | Baths | Sqft | Rent | $/sqft | DOM | Units | Dist |
|---|---|---|---|---|---|---|---|---|
| 8185 99th Ct Vero Beach, FL | 3.0 | 2.0 | 1449 | $2,075 | $1.43 | 21d | 1 | 0.37mi |
| 8415 102nd Ave Vero Beach, FL | 3.0 | 2.0 | 1400 | $2,065 | $1.48 | 21d | 1 | 0.51mi |
| 9715 79th St Vero Beach, FL | 3.0 | 2.0 | 1152 | $1,825 | $1.58 | 13d | 1 | 0.71mi |
| 8756 103rd Ave Vero Beach, FL | 3.0 | 2.0 | 1244 | $2,000 | $1.61 | 21d | 1 | 0.71mi |
| 10635 92nd St Vero Beach, FL | 3.0 | 2.0 | 1280 | $2,025 | $1.58 | 21d | 1 | 1.40mi |
Nearby sold comps map
Loading sold comps map…
Walkable amenities ~0.75 mi
Loading nearby amenities…
Taxation est. · year 1
- Rental income
- $27,894
- − Mortgage interest
- −$15,399
- − Property taxes
- −$4,124
- − Insurance
- −$1,374
- − Repairs & maintenance
- −$2,231
- − Management
- −$2,231
- − Depreciation
- −$7,997
- Taxable loss
- −$5,463
- Est. tax savings @ 24.0%
- +$1,311
- After-tax cash flow
- $550/yr
For passive investors: Depreciation is non-cash, so a rental often shows a tax loss while cash-flowing — sheltering income. Rental losses are passive: they offset passive income freely, and up to $25,000/yr can offset ordinary (W-2) income if you actively participate and your MAGI is under $100k (phasing out to $0 by $150k); unused losses carry forward. On sale, claimed depreciation is recaptured at up to 25%, and gains may owe capital-gains tax (a 1031 exchange can defer both). Figures are a year-1 estimate at your 24.0% rate — not tax advice; consult a CPA.
Condition & rehab AI · 6 photos
This home is in excellent condition with no visible repairs needed. It offers a good return on investment with updates that can significantly increase its resale and rental value.
Value-add opportunities
- Both Painting exterior and interior — Enhances curb appeal and interior aesthetics
- Both Landscaping improvements — Enhances curb appeal and adds value
- Rental HVAC maintenance — Improves comfort and energy efficiency
Renovation cost estimate screening
Value-add ROI direction
- Both Painting exterior and interior — Enhances curb appeal and interior aesthetics ↑
- Both Landscaping improvements — Enhances curb appeal and adds value ↑
- Rental HVAC maintenance — Improves comfort and energy efficiency ↑
ⓘ Cost ranges are severity-bucket heuristics (US national rule-of-thumb). Get contractor quotes + a written scope before underwriting a rehab budget.
Schools (NCES district)
- District
- Indian River
- NCES district ID
- 1200930
- Math proficiency
- 48% ▼ -9.00%
- Reading proficiency
- 52% ▼ -3.00%
- Median HH income
- $46,597
- Composite
- 42.45/100
- National rank
- #3218
- State rank
- #35 of 73 in FL
Livability — Vero Lake Estates
No livability data for this city. (Only ~50 U.S. cities are tracked.)
Census & demographics
- Census place
- Vero Lake Estates, FL
- County
- Indian River County · 143,738 people
- Metro
- Sebastian-Vero Beach, FL
- Population (ZIP)
- 27,240
- Household income
- $78,058
- Rent vs Own
- Severe rent burden
- 674.0
Population outlook (Indian River County) Hauer SSP2
- Today (2025)
- 165,104 people
- By 2030
- 172,869 · +4.7%
- By 2040
- 185,640 · +12.4%
- By 2050
- 194,465 · +17.8%
- By 2075
- 211,115 · +27.9%
- By 2100
- 211,781 · +28.3%
Race, ethnicity, and origin ACS 2023
- Neighborhood character
- Diverse neighborhood (Simpson 0.59)
- Race & ethnicity
- White 60% Black 17% Two or more races 16% Hispanic / Latino 15%
- Hispanic origin (detail)
- Mexican 4% Puerto Rican 4% Cuban 2% Salvadoran 2%
- Common ancestry
- Romanian 3% Hispanic 3% Lithuanian 3%
- Foreign-born
- 10% · Canada, Jamaica
- Languages at home
- 86% English-only · Spanish 9% French/Haitian/Cajun 3% Russian/Polish/Slavic 1%
Political lean MEDSL · Indian River
- 2024 margin
- Strong R (+27.4) · D 36.0% · R 63.4%
- 2008→2024 swing
- -12.5pp toward R · 2008: -14.8pp · 2024: -27.4pp
- All cycles
- 2024: R+27.4 2020: R+21.6 2016: R+24.5 2012: R+22.3 2008: R+14.8
Not yet ingested
- Civics
- —
Market trends
- HPI YoY
- ▼ -91.34%
- Current HPI
- 282.6156
- Rent YoY
- ▼ -1.16%
- Metro
- Sebastian-Vero Beach, FL
- State GDP YoY
- ▲ 3.28%
- F500 in state
- 36
Industry mix (Fortune 500 HQ in FL)
| Industry | F500 HQs | Revenue |
|---|---|---|
| Industrial Technology | 2 | $29B |
|
||
| Insurance | 2 | $17B |
|
||
| Retail | 1 | $60B |
|
||
| Technology Distribution | 1 | $58B |
|
||
| Homebuilding | 1 | $35B |
|
||
| Technology Manufacturing | 1 | $35B |
|
||
Cash-flow waterfall
monthlySold comps — $/sqft
last 12 mo · ≤1 miLoading sold comps…