N14099 W Central Ave · Fifield, WI
Flood risk 1/10 · Minimal
- FEMA flood zone
- X
- Chance of flooding over 30 yrs
- 0.0%
- Est. flood insurance / yr
- $473 – $860
Fire risk 3/10 · Minor
- Est. fire insurance / yr
- $636 – $1,182
Heat risk 1/10 · Minimal
- Hot days now (above 92°F)
- 7 days/yr
- Hot days in 30 yrs
- 13 days/yr
Wind risk 1/10 · Minimal
- Chance of severe wind over 30 yrs
- —
Air-quality risk 1/10 · Minimal
- Unhealthy air days now
- 0 days/yr
- Unhealthy air days in 30 yrs
- 0 days/yr
Risk factors via First Street. Map © Google.
Why this score? — see what drove the B+ grade
The composite is a weighted blend of 9 inputs, each scored 0–100. Each bar is that input's sub-score; the figure is the points it added to the 100-point composite (weight × sub-score).
- Cash flow +28.3/30.0
- ARV discount +15.0/15.0
- DSCR +10.0/10.0
- Appreciation +9.0/10.0
- 1% rule +6.7/10.0
- Rent growth +2.5/5.0
- Livability +2.5/5.0
- Condition / age +2.5/5.0
- Schools +2.3/10.0
$69,900
🖨 Deal sheet 📄 Offer letter ✓ Due diligence
Listing remarks MLS
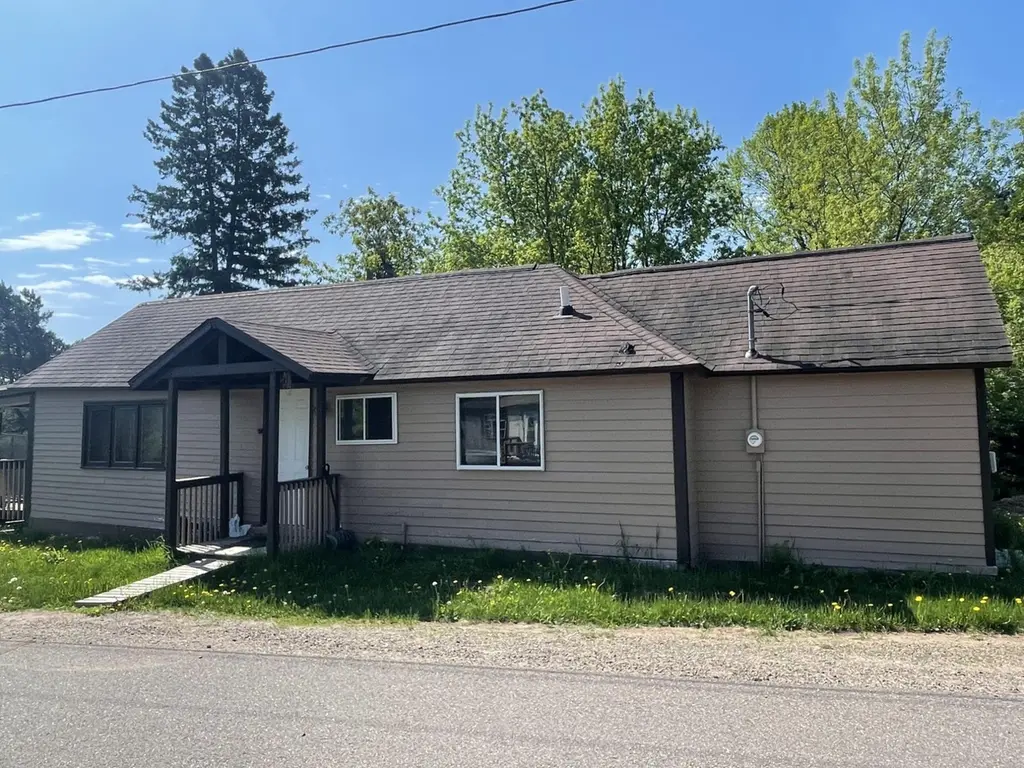
(370/DW) Affordable City Home! This 2-bedroom house is located on a corner lot in Fifield. The home features a roomy living, kitchen, dining area, 2 bedrooms and a bath. Electric baseboard heat and Warm Morning natural gas space heater in the carpeted living room. Crawl space. The exterior of the home has wood siding, and the shingles were replaced about 4 years ago. Nice gravel parking area and room for a garage. Home is serviced by city water and sewer. Take a Look! $69,900.
Key facts
- Gravel parking area
- City water
- Wood siding
Tags
Property features AI
Finance
- Other: Property listed by BIRCHLAND REALTY, INC - PARK FALLS
- Financial info: Tax information withheld from output
- HOA & community: Information not provided
Exterior
- Parking: No garage; Driveway; 2 total parking spaces
- Security: Information not provided
- Utilities: Public water; Public sewer; Electric with circuit breakers
- Home design: Single-family residence; One story; Residential property
- Construction: Frame construction with wood siding; Stone foundation; Composition/shingle roof; Built information not provided
- Exterior features: Public maintained road; City street frontage
Interior
- Kitchen: Electric oven; Electric range; Refrigerator
- Bedrooms: Information not provided
- Flooring: Carpet; Vinyl
- Bathrooms: 1 full bathroom
- Heating & cooling: Electric heating; Natural gas heating; Space heater
- Interior features: Electric water heater; No fireplace; Crawl space basement
- Laundry & utility: Information not provided
Neighborhood map
What this means for you Summary
Snapshot
- This is a 2-bed/1.0-bath single-family listed at $70k.
Deal economics
- At list price, monthly cash flow is $224 ($3k/yr) — positive.
- The deal already cash-flows at list — no discount required.
- Meets the 1% rule at list price ($817 rent vs $70k).
- Recommended offer: $69k (1.5% below list) — sets the bar for market timing.
Location & tenants
- Location reads: area grade B — affects rentability + tenant quality, not the cash-flow math above.
- Chequamegon School District (rural): math 25% / reading 29% proficiency, ranked #303 of 342 in WI (top 89%) — low school quality limits family demand, transient renter base, plan for 1-2y turnover.
- Zoned schools: Chequamegon Middle (math 22% / reading 37%, grade F, #261 of 383 statewide, top 73%, 129 students, 50% FRL); Chequamegon High (math 24% / reading 24%, grade F, #287 of 483 statewide, top 71%, 218 students, 46% FRL) — zoned schools at 48% FRL track the district average.
- Market conditions: 9 active listings in the ZIP; 47 units permitted in Price County in 2024 (0 in 5+ unit buildings).
Forward outlook
- In year one you build about $6k of equity ($483 loan paydown + $6k appreciation (8.0% local appreciation)).
- Price County population projected at -25% by 2050 — secular population decline; favor cash flow + early exit over multi-decade hold.
- At projected returns (8.0% appreciation + 3.0% rent growth), your $20k cash investment doubles in ~3 years — after that, you're playing with house money.
- By year 6, paydown + projected appreciation supports a ~$34k cash-out refi (75% LTV) — recoverable capital for the next deal without selling this one.
Negotiation context
- It's been on market 15 days — a 2% lower offer ($69k) is reasonable based on typical stale-listing flexibility.
- 2 sale attempts with the ask held roughly flat each time — persistent listings suggest the price (not the market) is what's stuck; bring a comps-based counter.
- Current owner paid $53k; 32% above their basis — modest negotiation headroom, anchor on the comps not their cost.
Risks & watch-outs
- Watch-outs: built in 1930 — expect roof / HVAC / electrical / plumbing capex.
Questions for the listing agent
- Built in 1930 — when were the roof, HVAC, electrical panel, plumbing, and water heater last replaced?
- Is there a deadline driving the sale (1031 exchange, divorce, estate, relocation)? That informs how much negotiation room exists.
- What's the average days-on-market for RENTAL listings here right now (not sales)? A rising rental-DOM trend means longer vacancies and softer asking-rent achievability than the comps imply.
- What's the recent tenant-quality profile in this submarket — average credit score on applications, eviction rate, late-payment / NSF rate, and stable-employment percentage? A property-management company in the area should have these aggregated.
- How much new for-sale + rental construction is in the pipeline within 1–3 miles? Heavy new supply typically softens prices + rents 12–24 months out; constrained supply supports both.
Investment metrics
- 1% rule
- 1.17% ✓
- Cap rate
- 10.14%
- Cash-on-cash
- 13.74%
- DSCR
- 1.61
- GRM
- 7.1
CMA / ARV
- ARV (on-the-fly)
- $118,184
- Comps found
- 2
Show comp detail 2 sales within ~0.75 mi
| Address | Dist | Beds/Ba | Sqft | Sold | Price | $/sf | Match |
|---|---|---|---|---|---|---|---|
| N14204 Central Ave | 0.28mi | 2/1.0 | 728 (-3%) | 11mo | $114,900 | $158 | 73 |
| N13937 W Central Ave | 0.40mi | 2/1.0 | 784 (+5%) | 8mo | $30,000 | $38 | 67 |
Match score weights: distance 35% · size 25% · config 20% · recency 20%. Top-matched comps best support the ARV.
Projected returns pro-forma
7.96% appreciation · 3.0% rent growth · sell at horizon
- IRR
- 30.6%
- Equity multiple
- 3.19×
- Total profit
- $42,861
- Equity at exit
- $52,917
- IRR
- 27.3%
- Equity multiple
- 6.81×
- Total profit
- $113,697
- Equity at exit
- $104,860
Cash invested: $19,572 (down + closing). Projections, not guarantees.
Landlord ↔ Tenant lean methodology
- Overall (STATE)
- 73 Landlord-Friendly
- State Wisconsin
- 73 Landlord-Friendly · R+2
- County
- — inherits STATE
- City
- — inherits STATE
ZIP-level market 54524
- Home prices YoY
- 3.6%
- Active inventory
- 9
- Price-to-rent
- 7.1×
Monthly cashflow live
- Estimated rent
- $817 medium interval (Pro) →
- Mortgage (P&I)
- −$367
- Tax from tax record
- −$26 /mo · $309/yr
- Insurance
- −$29
- HOA
- −$0
- Vacancy / Maint / Mgmt
- −$172
- Net cashflow
- $224
Break-even live
UW: 25.0% down · 7.5% · 30yr · 1.5% tax · 5.0% vac · 8.0% maint · 8.0% mgmt
Financing live
Cash to close
- Down payment
- $17,475
- Closing costs
- $2,097
- Reserves months
- —
- Total cash needed
- —
Loan-product check · same deal, 3 products live
Conventional
25% down · 7.5% · 30yr
- Down + closing
- —
- Monthly P&I
- —
- Monthly cashflow
- —
- DSCR
- —
- Eligible?
- —
Personal DTI + credit; lowest rate.
DSCR
20% down · 8.5% · 30yr
- Down + closing
- —
- Monthly P&I
- —
- Monthly cashflow
- —
- DSCR
- —
- Eligible?
- —
No personal income docs; deal must DSCR.
Hard money
10% down · 12.0% · 12mo
- Down + closing
- —
- Monthly P&I
- —
- Monthly cashflow
- —
- DSCR
- —
- Eligible?
- —
Short-term bridge; refi at stabilization.
Listing history 13 events
-
2026-06-18days on market $69,900 Active 15 DOM
-
2026-06-17days on market $69,900 Active 14 DOM
-
2026-06-16days on market $69,900 Active 13 DOM
-
2026-06-15days on market $69,900 Active 12 DOM
-
2026-06-15days on market $69,900 Active 11 DOM
-
2026-06-13days on market $69,900 Active 10 DOM
-
2026-06-12days on market $69,900 Active 9 DOM
-
2026-06-09days on market $69,900 Active 6 DOM
-
2026-06-08days on market $69,900 Active 5 DOM
-
2026-06-08days on market $69,900 Active 4 DOM
-
2026-06-05days on market $69,900 Active 2 DOM
-
2026-06-04remarks 549-char remark
-
2026-06-04$69,900 Active 1 DOM
ⓘ Source: listings_history table (triggers on properties + properties_extension) + one-shot
backfill from property_details.listing_events for pre-trigger history.
Tax reassessment forecast WI · Partial reset (capped growth)
- Current annual tax
- $309 · $26/mo
- Projected year-2 tax
- $801 · $67/mo
- Expected delta
- +$492/yr (+$41/mo · 159.0%)
ⓘ Screening estimate from a state-policy table — verify with the county assessor before closing.
Climate risk First Street
- Flood 1/10 Low FEMA zone X · 0% chance over 30 yrs
- Wildfire 3/10 Moderate
- Heat 1/10 Low 7 d/yr ≥92°F today · 13 d/yr by 30 yrs out
- Wind 1/10 Low
- Air quality 1/10 Low 0 unhealthy d/yr today · 0 by 30 yrs out
Nearby sold comps map
Loading sold comps map…
Walkable amenities ~0.75 mi
Loading nearby amenities…
Taxation est. · year 1
- Rental income
- $9,805
- − Mortgage interest
- −$3,915
- − Property taxes
- −$309
- − Insurance
- −$350
- − Repairs & maintenance
- −$784
- − Management
- −$784
- − Depreciation
- −$2,033
- Taxable income
- $1,629
- Est. tax owed @ 24.0%
- −$391
- After-tax cash flow
- $2,298/yr
For passive investors: Depreciation is non-cash, so a rental often shows a tax loss while cash-flowing — sheltering income. Rental losses are passive: they offset passive income freely, and up to $25,000/yr can offset ordinary (W-2) income if you actively participate and your MAGI is under $100k (phasing out to $0 by $150k); unused losses carry forward. On sale, claimed depreciation is recaptured at up to 25%, and gains may owe capital-gains tax (a 1031 exchange can defer both). Figures are a year-1 estimate at your 24.0% rate — not tax advice; consult a CPA.
Schools (NCES district)
- District
- Chequamegon School District
- NCES district ID
- 5500058
- Math proficiency
- 25% ▼ -18.00%
- Reading proficiency
- 29% ▼ -9.00%
- Median HH income
- $42,432
- Composite
- 22.98/100
- National rank
- #7984
- State rank
- #303 of 342 in WI
Livability — Fifield
No livability data for this city. (Only ~50 U.S. cities are tracked.)
Census & demographics
- Population (ZIP)
- 682
Population outlook (Price County) Hauer SSP2
- Today (2025)
- 12,757 people
- By 2030
- 12,157 · -4.7%
- By 2040
- 10,761 · -15.6%
- By 2050
- 9,515 · -25.4%
- By 2075
- 8,293 · -35.0%
- By 2100
- 7,470 · -41.4%
Race, ethnicity, and origin ACS 2023
- Neighborhood character
- Predominantly White (98%)
- Race & ethnicity
- White 98% Two or more races 2%
- Common ancestry
- Portuguese 7% Romanian 5% Lithuanian 2%
- Foreign-born
- 2% · Canada
Political lean MEDSL · Price
- 2024 margin
- Solid R (+31.1) · D 33.9% · R 65.1%
- 2008→2024 swing
- -44.5pp toward R · 2008: 13.4pp · 2024: -31.1pp
- All cycles
- 2024: R+31.1 2020: R+27.6 2016: R+25.0 2012: D+0.0 2008: D+13.4
Not yet ingested
- Civics
- —
Market trends
- HPI YoY
- ▲ 7.96%
- Current HPI
- 226.0184
- Rent YoY
- —
- Metro
- —
- State GDP YoY
- ▲ 2.10%
- F500 in state
- 20
Industry mix (Fortune 500 HQ in WI)
| Industry | F500 HQs | Revenue |
|---|---|---|
| Industrial Machinery | 4 | $23B |
|
||
| Industrial Technology | 2 | $36B |
|
||
| Insurance | 1 | $36B |
|
||
| Professional Services | 1 | $19B |
|
||
| Utilities | 1 | $9B |
|
||
| Consumer Goods | 1 | $3B |
|
||
Price history
+31.9% since first listed3 events — show timeline
- 2026-06-01 Listed $69,900 RANWW
- 2026-06-01 Listed $69,900 GNMLS
- 2022-09-26 Sold (Public Records) $53,000 Public Records
Property tax history
-3.6%/yrLatest (2025): $309 · +7.3% YoY. Source: county tax records.
Cash-flow waterfall
monthlySold comps — $/sqft
last 12 mo · ≤1 miLoading sold comps…