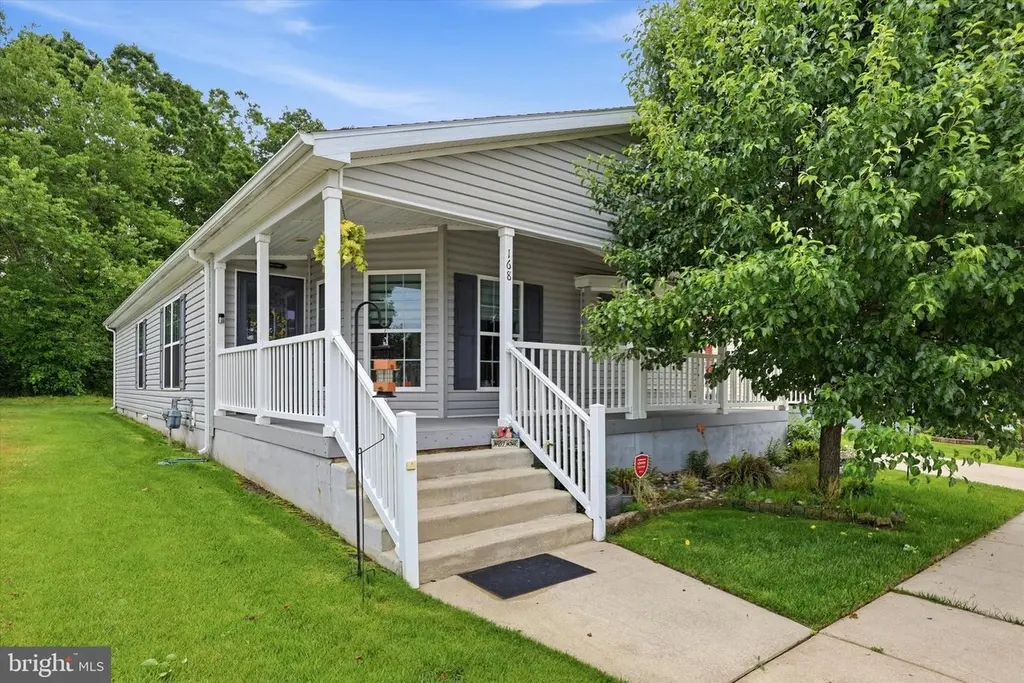
168 Dorian Dr · Sicklerville, NJ
Flood risk No data
- FEMA flood zone
- —
- Chance of flooding over 30 yrs
- —
- Est. flood insurance / yr
- —
Fire risk No data
- Est. fire insurance / yr
- —
Heat risk No data
- Hot days now (above threshold)
- —
- Hot days in 30 yrs
- —
Wind risk No data
- Chance of severe wind over 30 yrs
- —
Air-quality risk No data
- Unhealthy air days now
- —
- Unhealthy air days in 30 yrs
- —
Risk factors via First Street. Map © Google.
Why this score? — see what drove the D+ grade
The composite is a weighted blend of 9 inputs, each scored 0–100. Each bar is that input's sub-score; the figure is the points it added to the 100-point composite (weight × sub-score).
- Cash flow +20.1/30.0
- ARV discount +6.8/15.0
- DSCR +6.4/10.0
- 1% rule +5.3/10.0
- Schools +3.0/10.0
- Rent growth +2.5/5.0
- Livability +2.5/5.0
- Condition / age +2.5/5.0
- Appreciation +0.0/10.0
$249,999
🖨 Deal sheet (PDF) 📄 Offer letter ✓ Due diligence
Listing remarks MLS
Bright and Sunny on the outside, open and spacious on the inside. You are just going to love this well maintained manufactured home in Sunny Estates. Front porch greets you as you enter the home. Open and spacious living room and dining room. Bright and cheery kitchen with upgraded appliances, new flooring and lots of cabinets and counter space. Master suite with walk in closet and full bath with plenty of storage/linen closet. Great second bedroom that can double as a study or office. Hall bath is perfect for guest. Large laundry / utility area that opens to the backyard driveway and storage shed. Concrete crawl space with outside entry and sump pump. Nice yard with a treelined view. So much to see in this well cared for and beautifully maintained home.
Key facts
- Front porch
- Eat-in kitchen
- Lvp flooring
Tags
Property features AI
Finance
- HOA & community: Other community fees of $663 per month; Land lease payment of $769 per month
Exterior
- Parking: Driveway
- Utilities: Public water; Public septic; Electric service
- Home design: Manufactured home; Land lease ownership; Situated in a 55+ senior community
- Construction: Vinyl siding; Crawl space foundation; Estimated year built
- Exterior features: No basement; Above-grade structures
Interior
- Kitchen: Eat-in kitchen with pantry
- Bedrooms: 2 bedrooms on the main level
- Bathrooms: 2 full bathrooms on the main level
- Heating & cooling: Forced air heating (natural gas); Central air conditioning (electric); Electric hot water
- Interior features: Breakfast area; Ceiling fan(s); Dining area; Eat-in kitchen; Pantry; Skylight(s)
Neighborhood map
What this means for you Summary
Snapshot
- This is a 2-bed/2.0-bath single-family listed at $250k.
Deal economics
- At list price, monthly cash flow is $309 ($4k/yr) — positive.
- The deal already cash-flows at list — no discount required.
- Meets the 1% rule at list price ($3k rent vs $250k).
- Recommended offer: $246k (1.5% below list) — sets the bar for market timing.
- Cap rate 7.8% vs local median 4.7% in Sicklerville — top-decile yield for the area; either an underpriced asset or a hidden risk that comps aren't pricing in. Stress-test before assuming the spread holds.
Location & tenants
- Location reads: area grade D — affects rentability + tenant quality, not the cash-flow math above.
- Monroe Township Public School District (suburban): math 20% / reading 45% proficiency, ranked #302 of 472 in NJ (top 64%) — families likely to look elsewhere, expect single-tenant / working-renter base with shorter leases.
- Market conditions: 270 active listings in the ZIP; 5 comparable units currently listed for rent nearby; rentals leasing fast (median 0d on market — plan ~1-2 weeks tenant-placement turnaround); solid renter incomes; 1,047 units permitted in Gloucester County in 2024 (183 in 5+ unit buildings).
- This rent runs 32% of the median local income ($97k/yr) — at the standard rent-burdened threshold; future hikes will face affordability resistance.
Forward outlook
- Local home prices are declining (-3.0%/yr); year-one equity from $2k of loan paydown is wiped out by about $8k of value loss. Plan a longer hold.
- Gloucester County population projected to shrink 5% by 2050 — rents likely to lag national; underwrite the cash flow, not the appreciation.
Negotiation context
- It's been on market 24 days — a 2% lower offer ($246k) is reasonable based on typical stale-listing flexibility.
- 4 sale attempts since 11y ago with the ask held roughly flat each time — persistent listings suggest the price (not the market) is what's stuck; bring a comps-based counter.
- Current owner paid $165k; list at $250k implies a 52% gain — meaningful room to come down on a strong offer.
Questions for the listing agent
- Is there a deadline driving the sale (1031 exchange, divorce, estate, relocation)? That informs how much negotiation room exists.
- The area grade is low — what's the realistic commute time and amenity access for the typical tenant pool here? Any planned neighborhood developments (good or bad) we should know about?
- What's the average days-on-market for RENTAL listings here right now (not sales)? A rising rental-DOM trend means longer vacancies and softer asking-rent achievability than the comps imply.
- What's the recent tenant-quality profile in this submarket — average credit score on applications, eviction rate, late-payment / NSF rate, and stable-employment percentage? A property-management company in the area should have these aggregated.
- How much new for-sale + rental construction is in the pipeline within 1–3 miles? Heavy new supply typically softens prices + rents 12–24 months out; constrained supply supports both.
Investment metrics
- 1% rule
- 1.03% ✓
- Cap rate
- 7.78%
- Cash-on-cash
- 5.30%
- DSCR
- 1.24
- GRM
- 8.1
CMA / ARV
- ARV (on-the-fly)
- $246,400
- Comps found
- 12
Show comp detail 12 sales within ~0.75 mi
| Address | Dist | Beds/Ba | Sqft | Sold | Price | $/sf | Match |
|---|---|---|---|---|---|---|---|
| 165 Dorian Dr | 0.01mi | 2/2.0 | 1,680 (+5%) | 1mo | $259,900 | $155 | 90 |
| 161 Dorian Dr | 0.02mi | 2/2.0 | 1,680 (+5%) | 2mo | $265,000 | $158 | 89 |
| 14 Gibson Ln | 0.07mi | 2/2.0 | 1,680 (+5%) | 8mo | $235,000 | $140 | 82 |
| 301 Kennedy | 0.18mi | 3/2.0 (+1) | 1,568 (-2%) | 8mo | $129,000 | $82 | 77 |
| 45 Gregory Dr | 0.22mi | 2/2.0 | 1,680 (+5%) | 12mo | $258,000 | $154 | 71 |
| 200 Harrison Ave | 0.38mi | 3/2.0 (+1) | 1,650 (+3%) | 5mo | $139,500 | $85 | 68 |
| 209 Harrison Ave | 0.37mi | 3/2.0 (+1) | 1,700 (+6%) | 3mo | $145,000 | $85 | 65 |
| 522 Buchannan Ave | 0.50mi | 3/2.0 (+1) | 1,500 (-6%) | 7mo | $103,000 | $69 | 55 |
| 1510 N Main St | 0.63mi | 3/2.0 (+1) | 1,686 (+5%) | 9mo | $320,000 | $190 | 49 |
| 1804 Lillian Dr | 0.56mi | 3/1.5 (+1) | 1,784 (+12%) | 0mo | $280,000 | $157 | 47 |
| 509 Tuckahoe Rd | 0.68mi | 3/1.5 (+1) | 1,716 (+7%) | 4mo | $360,000 | $210 | 46 |
| 203 Tyler Ave | 0.60mi | 3/3.0 (+1) | 1,680 (+5%) | 11mo | $130,000 | $77 | 46 |
Match score weights: distance 35% · size 25% · config 20% · recency 20%. Top-matched comps best support the ARV.
Projected returns pro-forma
-3.0% appreciation · 3.0% rent growth · sell at horizon
- IRR
- -8.1%
- Equity multiple
- 0.70×
- Total profit
- $-20,778
- Equity at exit
- $37,276
- IRR
- 1.5%
- Equity multiple
- 1.11×
- Total profit
- $7,423
- Equity at exit
- $21,615
Cash invested: $70,000 (down + closing). Projections, not guarantees.
Landlord ↔ Tenant lean methodology
- Overall (STATE)
- 21 Tenant-Leaning
- State New Jersey
- 21 Tenant-Leaning · D+6
- County
- — inherits STATE
- City
- — inherits STATE
ZIP-level market 08094
- Active inventory
- 270
- Price-to-rent
- 8.1×
Monthly cashflow live
- Estimated rent
- $2,578 medium interval (Pro) →
- Mortgage (P&I)
- −$1,311
- Tax est. 1.5%
- −$312 /mo · $3,750/yr
- Insurance
- −$104
- HOA
- −$0
- Vacancy / Maint / Mgmt
- −$541
- Net cashflow
- $309
Break-even live
Sensitivity live
| Price | -10% $482 | -5% $396 | +0% $309 | +5% $223 | +10% $136 |
|---|---|---|---|---|---|
| Rent | -10% $106 | -5% $207 | +0% $309 | +5% $411 | +10% $513 |
| Rate | -1.0pp $435 | -0.5pp $373 | base $309 | +0.5pp $244 | +1.0pp $179 |
UW: 25.0% down · 7.5% · 30yr · 1.5% tax · 5.0% vac · 8.0% maint · 8.0% mgmt
Financing live
Cash to close
- Down payment
- $62,500
- Closing costs
- $7,500
- Reserves months
- —
- Total cash needed
- —
Loan-product check · same deal, 3 products live
Conventional
25% down · 7.5% · 30yr
- Down + closing
- —
- Monthly P&I
- —
- Monthly cashflow
- —
- DSCR
- —
- Eligible?
- —
Personal DTI + credit; lowest rate.
DSCR
20% down · 8.5% · 30yr
- Down + closing
- —
- Monthly P&I
- —
- Monthly cashflow
- —
- DSCR
- —
- Eligible?
- —
No personal income docs; deal must DSCR.
Hard money
10% down · 12.0% · 12mo
- Down + closing
- —
- Monthly P&I
- —
- Monthly cashflow
- —
- DSCR
- —
- Eligible?
- —
Short-term bridge; refi at stabilization.
Rent comps 5 comps
| Address | Beds | Baths | Sqft | Rent | $/sqft | DOM | Units | Dist |
|---|---|---|---|---|---|---|---|---|
| 1616 N Main St Williamstown, NJ | 2.0 | 2.0 | 1064 | $2,500 | $2.35 | 0d | 1 | 0.35mi |
| 1761 Glassboro Cross Keys Rd Williamstown, NJ | 2.0 | 1.0 | 1300 | $2,000 | $1.54 | 20d | 1 | 0.50mi |
| 1000 Fawn Dr Williamstown, NJ | 1.0–2.0 | 1.0–2.0 | 1209 | $6,006 | $4.97 | 0d | 1 | 0.55mi |
| 100 Town Center Blvd Sewell, NJ | 1.0–2.0 | 1.0–2.0 | 1107 | $3,110 | $2.81 | 0d | 17 | 1.30mi |
| 343 Brookdale Blvd Williamstown, NJ | 3.0 | 2.5 | 1438 | $2,500 | $1.74 | 0d | 1 | 1.32mi |
Listing history 14 events
-
2026-06-21days on market $249,999 Active 24 DOM
-
2026-06-18days on market $249,999 Active 21 DOM
-
2026-06-17days on market $249,999 Active 20 DOM
-
2026-06-16days on market $249,999 Active 19 DOM
-
2026-06-15days on market $249,999 Active 18 DOM
-
2026-06-13pricedays on market $249,999 Active 16 DOM
-
2026-06-09days on market $259,900 Active 12 DOM
-
2026-06-08days on market $259,900 Active 11 DOM
-
2026-06-07days on market $259,900 Active 10 DOM
-
2026-06-04days on market $259,900 Active 7 DOM
-
2026-06-03days on market $259,900 Active 6 DOM
-
2026-06-02days on market $259,900 Active 5 DOM
-
2026-06-01days on market $259,900 Active 4 DOM
-
2026-05-31days on market $259,900 Active 3 DOM
ⓘ Source: listings_history table (triggers on properties + properties_extension) + one-shot
backfill from property_details.listing_events for pre-trigger history.
Nearby sold comps map
Loading sold comps map…
Walkable amenities ~0.75 mi
Loading nearby amenities…
Taxation est. · year 1
- Rental income
- $30,940
- − Mortgage interest
- −$14,004
- − Property taxes
- −$3,750
- − Insurance
- −$1,250
- − Repairs & maintenance
- −$2,475
- − Management
- −$2,475
- − Depreciation
- −$7,273
- Taxable loss
- −$287
- Est. tax savings @ 24.0%
- +$69
- After-tax cash flow
- $3,779/yr
For passive investors: Depreciation is non-cash, so a rental often shows a tax loss while cash-flowing — sheltering income. Rental losses are passive: they offset passive income freely, and up to $25,000/yr can offset ordinary (W-2) income if you actively participate and your MAGI is under $100k (phasing out to $0 by $150k); unused losses carry forward. On sale, claimed depreciation is recaptured at up to 25%, and gains may owe capital-gains tax (a 1031 exchange can defer both). Figures are a year-1 estimate at your 24.0% rate — not tax advice; consult a CPA.
Schools (NCES district)
- District
- Monroe Township Public School District
- NCES district ID
- 3410470
- Math proficiency
- 20% ▼ -24.00%
- Reading proficiency
- 45% ▼ -9.00%
- Median HH income
- $71,557
- Composite
- 30.24/100
- National rank
- #6295
- State rank
- #302 of 472 in NJ
Livability — Sicklerville
No livability data for this city. (Only ~50 U.S. cities are tracked.)
Census & demographics
- County
- Gloucester County · 160,422 people
- City population
- 50,264
- Metro
- Philadelphia-Camden-Wilmington, PA-NJ-DE-MD
- Population (ZIP)
- 41,595
- Household income
- $96,699
- Rent vs Own
- Severe rent burden
- 721.0
Population outlook (Gloucester County) Hauer SSP2
- Today (2025)
- 298,895 people
- By 2030
- 299,031 · +0.0%
- By 2040
- 294,020 · -1.6%
- By 2050
- 284,188 · -4.9%
- By 2075
- 260,720 · -12.8%
- By 2100
- 229,565 · -23.2%
Race, ethnicity, and origin ACS 2023
- Neighborhood character
- Predominantly White (73%)
- Race & ethnicity
- White 73% Hispanic / Latino 11% Black 10% Two or more races 8% Asian 1%
- Hispanic origin (detail)
- Puerto Rican 6% Dominican 1%
- Common ancestry
- Romanian 6% Slovak 2% Lithuanian 1%
- Foreign-born
- 4% · Canada
- Languages at home
- 92% English-only · Spanish 5% Russian/Polish/Slavic 1%
Political lean MEDSL · Gloucester
- 2024 margin
- Toss-up / Even · D 47.8% · R 50.6% · Other 1.6%
- 2008→2024 swing
- -15.0pp toward R · 2008: 12.2pp · 2024: -2.8pp
- All cycles
- 2024: R+2.8 2020: D+1.9 2016: R+0.4 2012: D+10.5 2008: D+12.2
Not yet ingested
- Civics
- —
Market trends
- HPI YoY
- ▼ -213.12%
- Current HPI
- 278.3849
- Rent YoY
- —
- Metro
- Philadelphia-Camden-Wilmington, PA-NJ-DE-MD
- State GDP YoY
- ▲ 2.05%
- F500 in state
- 34
Industry mix (Fortune 500 HQ in NJ)
| Industry | F500 HQs | Revenue |
|---|---|---|
| Consumer Goods | 3 | $31B |
|
||
| Pharmaceuticals | 2 | $153B |
|
||
| Technology | 2 | $21B |
|
||
| Insurance | 2 | $20B |
|
||
| Healthcare | 2 | $19B |
|
||
| Financial Services | 1 | $70B |
|
||
Price history
+136.3% since first listed11 events — show timeline
- 2026-05-28 Listed $259,900 BRIGHT MLS
- 2021-10-15 Sold (MLS) $165,000 BRIGHT MLS
- 2021-09-09 Pending — BRIGHT MLS
- 2021-09-07 Contingent — BRIGHT MLS
- 2021-08-27 Price Changed $175,000 BRIGHT MLS
- 2021-08-27 Relisted — BRIGHT MLS
- 2021-06-08 Listing Removed — BRIGHT MLS
- 2021-06-05 Price Changed $149,900 BRIGHT MLS
- 2021-05-21 Listed $149,000 BRIGHT MLS
- 2015-03-31 Listing Removed — BRIGHT MLS
- 2015-03-27 Listed $110,000 BRIGHT MLS
Cash-flow waterfall
monthlySold comps — $/sqft
last 12 mo · ≤1 miLoading sold comps…