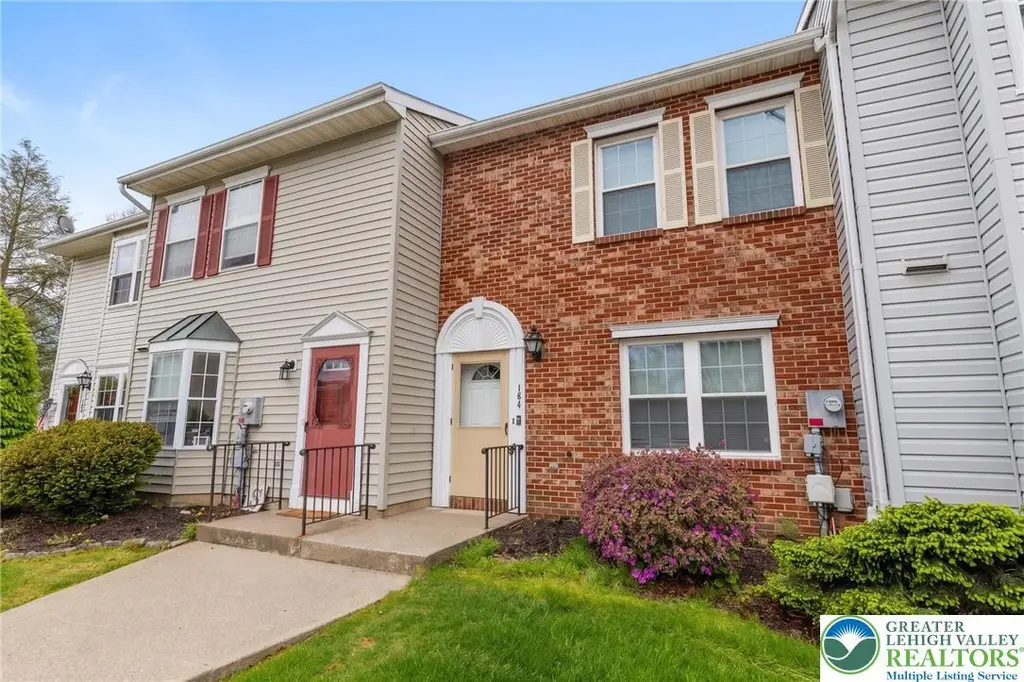
104 Empire Ct · Middletown, PA
Flood risk 1/10 · Minimal
- FEMA flood zone
- X (unshaded)
- Chance of flooding over 30 yrs
- 0.0%
- Est. flood insurance / yr
- $507 – $1,088
Fire risk 1/10 · Minimal
- Est. fire insurance / yr
- $511 – $949
Heat risk 5/10 · Moderate
- Hot days now (above 101°F)
- 7 days/yr
- Hot days in 30 yrs
- 15 days/yr
Wind risk 4/10 · Minor
- Chance of severe wind over 30 yrs
- 19.0%
Air-quality risk 3/10 · Minor
- Unhealthy air days now
- 3 days/yr
- Unhealthy air days in 30 yrs
- 4 days/yr
Risk factors via First Street. Map © Google.
Why this score? — see what drove the C- grade
The composite is a weighted blend of 9 inputs, each scored 0–100. Each bar is that input's sub-score; the figure is the points it added to the 100-point composite (weight × sub-score).
- Cash flow +18.1/30.0
- ARV discount +9.6/15.0
- 1% rule +6.5/10.0
- DSCR +5.7/10.0
- Livability +4.0/5.0
- Schools +3.5/10.0
- Rent growth +2.5/5.0
- Condition / age +2.5/5.0
- Appreciation +0.0/10.0
$239,900
🖨 Deal sheet 📄 Offer letter ✓ Due diligence
Listing remarks MLS
* * No More Showings!!!! Executrix of Estate Has Conditionally Accepted An Offer Subject To Review By Attorney. * * Affordable 2 story Condo/Townhome in a desirable Bethlehem Township location. Easy access to Rt's 33 & 78 for the commuter. 3 BR, 1 1/2 baths. Open layout. Utility room on first floor houses the economical gas furnace and hot water heater. Rear patio plus attached utility shed for storage. Windows replaced in 2021. Second floor laundry. HOA fees cover trash, lawn care, snow removal, use of clubhouse, swimming pool and tennis courts. This one won't last long, see it today!
Key facts
- New stove
- Private patio
- Eat-in kitchen
Tags
Property features AI
Finance
- Other: Zoned 05MHDR
- HOA & community: Monthly association fee of $365
Exterior
- Parking: Parking lot
- Security: Smoke detector(s)
- Utilities: Public water; Public sewer; Cable available
- Home design: 2-story property; Brick and vinyl siding exterior; Asphalt/fiberglass roof
- Construction: Brick and vinyl siding construction; Asphalt/fiberglass roof
- Exterior features: Patio; Shed(s); Flat lot; Paved private road frontage
Interior
- Kitchen: Dishwasher; Electric cooktop; Electric oven; Electric range; Microwave; Refrigerator; Eat-in kitchen
- Bedrooms: Second-floor bedrooms (multiple)
- Flooring: Engineered hardwood
- Bathrooms: One full bathroom on the second floor; One half bathroom on the first floor
- Heating & cooling: Gas heating; Central air conditioning; Gas water heater
- Interior features: Engineered hardwood flooring; Dining area; Separate/formal dining room; Eat-in kitchen
- Laundry & utility: Washer/dryer included; Washer hookup; Dryer hookup; Upper-level laundry hookups
Neighborhood map
What this means for you Summary
Snapshot
- This is a 3-bed/1.5-bath townhouse listed at $240k.
Deal economics
- At list price, monthly cash flow is $209 ($3k/yr) — positive.
- The deal already cash-flows at list — no discount required.
- Meets the 1% rule at list price ($3k rent vs $240k).
- Cap rate 7.3% vs local median 3.1% in Middletown — top-decile yield for the area; either an underpriced asset or a hidden risk that comps aren't pricing in. Stress-test before assuming the spread holds.
Location & tenants
- Location reads 80/100 on livability (#214 in PA, #1,886 nationally) — a professional / high-income tenant draw. Strengths: cost of living A+, housing A+, health & safety A+; Watch: schools C-, amenities F.
- Bethlehem Area SD (urban): math 31% / reading 49% proficiency, ranked #342 of 539 in PA (top 64%) — families likely to look elsewhere, expect single-tenant / working-renter base with shorter leases.
- Market conditions: 75 active listings in the ZIP; 3 comparable units currently listed for rent nearby; rentals lingering (median 44d on market — plan ~5-8 weeks vacancy on turnover, expect pricing pressure); 67% of comp listings sitting > 30 days — soft ceiling on asking rent; high-income renter base; 567 units permitted in Northampton County in 2024 (151 in 5+ unit buildings).
Forward outlook
- Local home prices are declining (-3.0%/yr); year-one equity from $2k of loan paydown is wiped out by about $7k of value loss. Plan a longer hold.
Negotiation context
- Only 2 days on market — expect competitive offers; lowballing is unlikely to land.
- 2 sale attempts since 5y ago with the ask held roughly flat each time — persistent listings suggest the price (not the market) is what's stuck; bring a comps-based counter.
- Current owner paid $181k; 33% above their basis — modest negotiation headroom, anchor on the comps not their cost.
Risks & watch-outs
- Climate carrying-cost: extreme-heat days projected 7→15/yr by 2055 (HVAC capex compounding) — expect insurance premiums to compound above CPI over the hold.
Questions for the listing agent
- What does the HOA fee cover, when was the last increase, and are there any pending special assessments or reserve-fund shortfalls?
- Is there a deadline driving the sale (1031 exchange, divorce, estate, relocation)? That informs how much negotiation room exists.
- What's the average days-on-market for RENTAL listings here right now (not sales)? A rising rental-DOM trend means longer vacancies and softer asking-rent achievability than the comps imply.
- What's the recent tenant-quality profile in this submarket — average credit score on applications, eviction rate, late-payment / NSF rate, and stable-employment percentage? A property-management company in the area should have these aggregated.
- How much new for-sale + rental construction is in the pipeline within 1–3 miles? Heavy new supply typically softens prices + rents 12–24 months out; constrained supply supports both.
Investment metrics
- 1% rule
- 1.15% ✓
- Cap rate
- 7.34%
- Cash-on-cash
- 3.74%
- DSCR
- 1.17
- GRM
- 7.2
CMA / ARV
- ARV (on-the-fly)
- $251,652
- Comps found
- 6
Show comp detail 6 sales within ~0.75 mi
| Address | Dist | Beds/Ba | Sqft | Sold | Price | $/sf | Match |
|---|---|---|---|---|---|---|---|
| 104 Empire Ct | 0.00mi | 3/1.5 | 1,252 (0%) | 0mo | $251,500 | $201 | 100 |
| 117 Brandywine Dr | 0.02mi | 3/1.5 | 1,231 (-2%) | 3mo | $255,000 | $207 | 93 |
| 113 Empire Ct | 0.03mi | 3/1.5 | 1,231 (-2%) | 6mo | $247,000 | $201 | 91 |
| 121 Empire Ct | 0.03mi | 3/1.5 | 1,252 (0%) | 13mo | $210,000 | $168 | 87 |
| 113 Commonwealth Dr | 0.21mi | 3/1.5 | 1,396 (+12%) | 11mo | $290,000 | $208 | 62 |
| 117 Commonwealth Dr | 0.23mi | 3/1.5 | 1,396 (+12%) | 19mo | $248,000 | $178 | 54 |
Match score weights: distance 35% · size 25% · config 20% · recency 20%. Top-matched comps best support the ARV.
Projected returns pro-forma
-3.0% appreciation · 3.0% rent growth · sell at horizon
- IRR
- -10.3%
- Equity multiple
- 0.62×
- Total profit
- $-25,316
- Equity at exit
- $35,770
- IRR
- -0.8%
- Equity multiple
- 0.94×
- Total profit
- $-3,939
- Equity at exit
- $20,742
Cash invested: $67,172 (down + closing). Projections, not guarantees.
Landlord ↔ Tenant lean methodology
- Overall (STATE)
- 62 Landlord-Friendly
- State Pennsylvania
- 62 Landlord-Friendly · EVEN
- County
- — inherits STATE
- City
- — inherits STATE
ZIP-level market 18020
- Active inventory
- 75
- Price-to-rent
- 7.2×
Monthly cashflow live
- Estimated rent
- $2,758 medium interval (Pro) →
- Mortgage (P&I)
- −$1,258
- Tax from tax record
- −$246 /mo · $2,957/yr
- Insurance
- −$100
- HOA
- −$365
- Vacancy / Maint / Mgmt
- −$579
- Net cashflow
- $209
Break-even live
UW: 25.0% down · 7.5% · 30yr · 1.5% tax · 5.0% vac · 8.0% maint · 8.0% mgmt
Financing live
Cash to close
- Down payment
- $59,975
- Closing costs
- $7,197
- Reserves months
- —
- Total cash needed
- —
Loan-product check · same deal, 3 products live
Conventional
25% down · 7.5% · 30yr
- Down + closing
- —
- Monthly P&I
- —
- Monthly cashflow
- —
- DSCR
- —
- Eligible?
- —
Personal DTI + credit; lowest rate.
DSCR
20% down · 8.5% · 30yr
- Down + closing
- —
- Monthly P&I
- —
- Monthly cashflow
- —
- DSCR
- —
- Eligible?
- —
No personal income docs; deal must DSCR.
Hard money
10% down · 12.0% · 12mo
- Down + closing
- —
- Monthly P&I
- —
- Monthly cashflow
- —
- DSCR
- —
- Eligible?
- —
Short-term bridge; refi at stabilization.
Rent comps 3 comps
| Address | Beds | Baths | Sqft | Rent | $/sqft | DOM | Units | Dist |
|---|---|---|---|---|---|---|---|---|
| 112 Freedom Ct Bethlehem, PA | 3.0 | 2.5 | 1508 | $2,595 | $1.72 | 43d | 1 | 0.13mi |
| 4034 Easton Ave Unit 1A 2nd Floor Bethlehem, PA | 3.0 | 1.0 | 1500 | $2,495 | $1.66 | 23d | 1 | 0.58mi |
| 3547 Carter Rd Bethlehem, PA | 3.0 | 1.0 | 1800 | $2,495 | $1.39 | 43d | 1 | 1.39mi |
HOA detail
- Monthly dues
- $365 · $4,380/yr
- Likely covers
- watertrashgaslandscapingsnow removalpool
Listing history 7 events
-
2026-05-07status Pending
-
2026-05-04$239,900 Active
-
2021-09-23soldstatus $181,000
-
2021-09-17soldstatus $181,000 Sold 603-char remark
Show marketing remark (603 chars)
* * No More Showings!!!! Executrix of Estate Has Conditionally Accepted An Offer Subject To Review By Attorney. * * Affordable 2 story Condo/Townhome in a desirable Bethlehem Township location. Easy access to Rt's 33 & 78 for the commuter. 3 BR, 1 1/2 baths. Open layout. Utility room on first floor houses the economical gas furnace and hot water heater. Rear patio plus attached utility shed for storage. Windows replaced in 2021. Second floor laundry. HOA fees cover trash, lawn care, snow removal, use of clubhouse, swimming pool and tennis courts. This one won't last long, see it today!
-
2021-08-20status Pending 603-char remark
Show marketing remark (603 chars)
* * No More Showings!!!! Executrix of Estate Has Conditionally Accepted An Offer Subject To Review By Attorney. * * Affordable 2 story Condo/Townhome in a desirable Bethlehem Township location. Easy access to Rt's 33 & 78 for the commuter. 3 BR, 1 1/2 baths. Open layout. Utility room on first floor houses the economical gas furnace and hot water heater. Rear patio plus attached utility shed for storage. Windows replaced in 2021. Second floor laundry. HOA fees cover trash, lawn care, snow removal, use of clubhouse, swimming pool and tennis courts. This one won't last long, see it today!
-
2021-08-10$179,900 Active - No Show 603-char remark
Show marketing remark (603 chars)
* * No More Showings!!!! Executrix of Estate Has Conditionally Accepted An Offer Subject To Review By Attorney. * * Affordable 2 story Condo/Townhome in a desirable Bethlehem Township location. Easy access to Rt's 33 & 78 for the commuter. 3 BR, 1 1/2 baths. Open layout. Utility room on first floor houses the economical gas furnace and hot water heater. Rear patio plus attached utility shed for storage. Windows replaced in 2021. Second floor laundry. HOA fees cover trash, lawn care, snow removal, use of clubhouse, swimming pool and tennis courts. This one won't last long, see it today!
-
1989-12-01soldstatus $87,225
ⓘ Source: listings_history table (triggers on properties + properties_extension) + one-shot
backfill from property_details.listing_events for pre-trigger history.
Tax reassessment forecast PA · Partial reset (capped growth)
- Current annual tax
- $2,957 · $246/mo
- Projected year-2 tax
- $3,374 · $281/mo
- Expected delta
- +$417/yr (+$35/mo · 14.1%)
ⓘ Screening estimate from a state-policy table — verify with the county assessor before closing.
Climate risk First Street
- Flood 1/10 Low FEMA zone X (unshaded) · 0% chance over 30 yrs
- Wildfire 1/10 Low
- Heat 5/10 Major 7 d/yr ≥101°F today · 15 d/yr by 30 yrs out
- Wind 4/10 Moderate 19% chance of damaging wind over 30 yrs
- Air quality 3/10 Moderate 3 unhealthy d/yr today · 4 by 30 yrs out
Nearby sold comps map
Loading sold comps map…
Walkable amenities ~0.75 mi
Loading nearby amenities…
Taxation est. · year 1
- Rental income
- $33,093
- − Mortgage interest
- −$13,438
- − Property taxes
- −$2,957
- − Insurance
- −$1,200
- − Repairs & maintenance
- −$2,647
- − Management
- −$2,647
- − HOA
- −$4,380
- − Depreciation
- −$6,979
- Taxable loss
- −$1,155
- Est. tax savings @ 24.0%
- +$277
- After-tax cash flow
- $2,788/yr
For passive investors: Depreciation is non-cash, so a rental often shows a tax loss while cash-flowing — sheltering income. Rental losses are passive: they offset passive income freely, and up to $25,000/yr can offset ordinary (W-2) income if you actively participate and your MAGI is under $100k (phasing out to $0 by $150k); unused losses carry forward. On sale, claimed depreciation is recaptured at up to 25%, and gains may owe capital-gains tax (a 1031 exchange can defer both). Figures are a year-1 estimate at your 24.0% rate — not tax advice; consult a CPA.
Schools (NCES district)
- District
- Bethlehem Area SD
- NCES district ID
- 4203570
- Math proficiency
- 31% ▼ -2.00%
- Reading proficiency
- 49% ▼ -6.00%
- Median HH income
- $55,124
- Composite
- 34.92/100
- National rank
- #5068
- State rank
- #342 of 539 in PA
Livability — Middletown
- Score
- 80/100
- State rank
- #214
- US rank
- #1886
Category grades
Schools grade is shown separately in the Schools card above.
Census & demographics
- County
- Northampton County · 236,814 people
- City population
- 23,560
- Metro
- Allentown-Bethlehem-Easton, PA-NJ
- Population (ZIP)
- 21,204
- Household income
- $126,166
- Rent vs Own
- Severe rent burden
- 249.0
Population outlook (Northampton County) Hauer SSP2
- Today (2025)
- 312,227 people
- By 2030
- 314,769 · +0.8%
- By 2040
- 316,914 · +1.5%
- By 2050
- 318,037 · +1.9%
- By 2075
- 334,003 · +7.0%
- By 2100
- 344,696 · +10.4%
Race, ethnicity, and origin ACS 2023
- Neighborhood character
- Predominantly White (70%)
- Race & ethnicity
- White 70% Hispanic / Latino 15% Two or more races 10% Black 5% Asian 5%
- Hispanic origin (detail)
- Mexican 1% Puerto Rican 7% Dominican 2%
- Common ancestry
- Romanian 8% Russian 2% Slovak 1%
- Foreign-born
- 10% · Canada, China, Jamaica
- Languages at home
- 86% English-only · Spanish 6% Other Indo-European 4% Russian/Polish/Slavic 1%
Political lean MEDSL · Northampton
- 2024 margin
- Toss-up / Even · D 48.6% · R 50.4%
- 2008→2024 swing
- -14.1pp toward R · 2008: 12.3pp · 2024: -1.8pp
- All cycles
- 2024: R+1.8 2020: D+0.7 2016: R+3.8 2012: D+4.6 2008: D+12.3
Not yet ingested
- Civics
- —
Market trends
- HPI YoY
- ▼ -240.51%
- Current HPI
- 206.2873
- Rent YoY
- —
- Metro
- Allentown-Bethlehem-Easton, PA-NJ
- State GDP YoY
- ▲ 1.68%
- F500 in state
- 34
Industry mix (Fortune 500 HQ in PA)
| Industry | F500 HQs | Revenue |
|---|---|---|
| Healthcare | 2 | $309B |
|
||
| Insurance | 2 | $27B |
|
||
| Telecommunications / Media | 1 | $124B |
|
||
| Industrial Distribution | 1 | $22B |
|
||
| Financial Services | 1 | $20B |
|
||
| Chemicals / Materials | 1 | $18B |
|
||
Price history
+175.0% since first listed7 events — show timeline
- 2026-05-07 Pending — GLVRMLS
- 2026-05-04 Listed $239,900 GLVRMLS
- 2021-09-23 Sold (Public Records) $181,000 Public Records
- 2021-09-17 Sold (MLS) $181,000 GLVRMLS
- 2021-08-20 Pending — GLVRMLS
- 2021-08-10 Listed $179,900 GLVRMLS
- 1989-12-01 Sold (Public Records) $87,225 Public Records
Property tax history
+1.6%/yrLatest (2026): $2,957 · +4.2% YoY. Source: county tax records.
Cash-flow waterfall
monthlySold comps — $/sqft
last 12 mo · ≤1 miLoading sold comps…