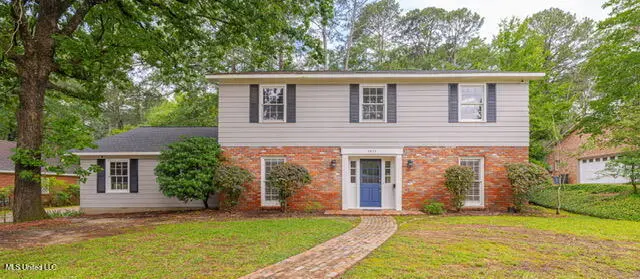
5477 River Thames Pl · Jackson, MS
Flood risk 1/10 · Minimal
- FEMA flood zone
- X (unshaded)
- Chance of flooding over 30 yrs
- 0.0%
- Est. flood insurance / yr
- $507 – $1,088
Fire risk 1/10 · Minimal
- Est. fire insurance / yr
- $1,241 – $2,305
Heat risk 7/10 · Major
- Hot days now (above 108°F)
- 7 days/yr
- Hot days in 30 yrs
- 20 days/yr
Wind risk 8/10 · Major
- Chance of severe wind over 30 yrs
- 80.0%
Air-quality risk 2/10 · Minimal
- Unhealthy air days now
- 0 days/yr
- Unhealthy air days in 30 yrs
- 1 days/yr
Risk factors via First Street. Map © Google.
Why this score? — see what drove the D- grade
The composite is a weighted blend of 9 inputs, each scored 0–100. Each bar is that input's sub-score; the figure is the points it added to the 100-point composite (weight × sub-score).
- ARV discount +11.3/15.0
- Cash flow +7.8/30.0
- Rent growth +4.5/5.0
- Livability +3.4/5.0
- 1% rule +3.1/10.0
- Condition / age +2.5/5.0
- DSCR +1.9/10.0
- Schools +1.1/10.0
- Appreciation +0.0/10.0
$299,900
🖨 Deal sheet (PDF) 📄 Offer letter ✓ Due diligence
Listing remarks MLS
SELLER FINANCING AVAILABLE! Welcome to Heatherwood subdivision, where you'll find this charming 5 bedroom 4 bathroom home for sale. This lovely home boasts 3,131 square feet of space, providing ample room for all your needs. It is full of 70's charm, with unique architectural features that add to its character. Recent updates have been made to appeal to the modern buyer. The five bedrooms are perfect for a large family or for those who need extra space for an office or guest room-which has a private entrance from the driveway. The four bathrooms provides space for everyone to have privacy. The updated kitchen has all stainless steel appliances and granite countertops. The living room is spacious and perfect for entertaining guests or relaxing after a long day. If you are looking for a comfortable and charming home, look no further than this gem in Heatherwood subdivision. Call your REALTOR to schedule a tour.
Key facts
- 0.31 acre lot
- 2 garage spots
- Built 1975
Neighborhood map
What this means for you Summary
Snapshot
- This is a 3-bed/3.0-bath single-family listed at $300k.
Deal economics
- At list price, monthly cash flow is $-334 ($-4k/yr) — negative.
- To cash-flow at today's rent, offer at most $241k (19.6% below list).
- To meet the 1% rule (rent ≥ 1% of price), the offer needs to be $242k (19.3% below list).
- Recommended offer: $241k (19.6% below list) — sets the bar for cash-flow.
- Cap rate 5.0% vs local median 9.9% in Jackson — below-typical yield; the buyer is paying a premium for something (appreciation thesis, condition, location) that the cap rate doesn't capture.
Location & tenants
- Location reads 68/100 on livability (#66 in MS) — a middle-class / working-renter tenant base. Strengths: commute A+, cost of living A+, housing A+; Watch: amenities F, employment F, health & safety F.
- Jackson Public School District (urban): math 9% / reading 18% proficiency, ranked #112 of 130 in MS (top 86%) — low school quality limits family demand, transient renter base, plan for 1-2y turnover; 88% free/reduced lunch — lower-income household profile, screen leases tightly.
- Zoned schools: Spann Elementary School (math 7% / reading 21%, grade F, #289 of 375 statewide, top 78%, 395 students, 100% FRL); Chastain Middle School (math 5% / reading 11%, grade F, #165 of 179 statewide, top 93%, 499 students, 100% FRL); Murrah High School (math 12% / reading 27%, grade F, #130 of 197 statewide, top 68%, 1,326 students, 100% FRL).
- Market conditions: Rents rising fast (+7.9%/yr); 221 active listings in the ZIP; 2 comparable units currently listed for rent nearby; 167 units permitted in Hinds County in 2024 (0 in 5+ unit buildings).
- This rent runs 42% of the median local income ($69k/yr) — at the standard rent-burdened threshold; future hikes will face affordability resistance.
Forward outlook
- Local home prices are declining (-3.0%/yr); year-one equity from $2k of loan paydown is wiped out by about $9k of value loss. Plan a longer hold.
- Hinds County population projected to shrink 6% by 2050 — rents likely to lag national; underwrite the cash flow, not the appreciation.
Negotiation context
- It's been on market 65 days — a 6% lower offer ($282k) is reasonable based on typical stale-listing flexibility.
- 12 sale attempts since 20y ago with the ask held roughly flat each time — persistent listings suggest the price (not the market) is what's stuck; bring a comps-based counter.
Risks & watch-outs
- Climate carrying-cost: severe wind risk, 80% chance of damaging wind over 30y; extreme-heat days projected 7→20/yr by 2055 (HVAC capex compounding) — expect insurance premiums to compound above CPI over the hold.
Questions for the listing agent
- What do current leases actually rent for vs. the listed asking? Can we see a recent rent roll and the last 12 months of T-12 income?
- It's been on market 65 days. Have you received any prior offers? Is the seller open to a 20% concession, seller financing, or rate buy-down credit?
- Built in 1975 — when were the roof, HVAC, electrical panel, plumbing, and water heater last replaced?
- What does the HOA fee cover, when was the last increase, and are there any pending special assessments or reserve-fund shortfalls?
- Why hasn't it sold? Are there any deal-killer items the seller is aware of (foundation, flood, title, zoning, code violations)?
- Is there a deadline driving the sale (1031 exchange, divorce, estate, relocation)? That informs how much negotiation room exists.
- Schools are F-rated, which usually means shorter tenancies and higher turnover. Who's the typical renter profile here, and what's been the actual vacancy rate?
- The area grade is low — what's the realistic commute time and amenity access for the typical tenant pool here? Any planned neighborhood developments (good or bad) we should know about?
- What's the average days-on-market for RENTAL listings here right now (not sales)? A rising rental-DOM trend means longer vacancies and softer asking-rent achievability than the comps imply.
- What's the recent tenant-quality profile in this submarket — average credit score on applications, eviction rate, late-payment / NSF rate, and stable-employment percentage? A property-management company in the area should have these aggregated.
- How much new for-sale + rental construction is in the pipeline within 1–3 miles? Heavy new supply typically softens prices + rents 12–24 months out; constrained supply supports both.
Investment metrics
- 1% rule
- 0.81% ✗
- Cap rate
- 4.96%
- Cash-on-cash
- -4.77%
- DSCR
- 0.79
- GRM
- 10.3
CMA / ARV
- ARV (median comp)
- $327,389
- List price
- $299,900
- Delta
- -8.40%
- Verdict
- FAIR
- Comps
- 20 within 1.0 mi
Show comp detail 12 sales within ~0.75 mi
| Address | Dist | Beds/Ba | Sqft | Sold | Price | $/sf | Match |
|---|---|---|---|---|---|---|---|
| 5550 River Thames Rd | 0.09mi | 4/3.5 (+1) | 3,154 (-2%) | 3mo | $308,000 | $98 | 84 |
| 5405 Kaywood Dr | 0.23mi | 4/4.5 (+1) | 3,283 (+2%) | 5mo | $269,900 | $82 | 70 |
| 5345 Runnymede Rd | 0.34mi | 4/3.0 (+1) | 3,236 (+1%) | 12mo | $299,000 | $92 | 67 |
| 5346 Carolwood Dr | 0.36mi | 4/3.5 (+1) | 3,226 (+1%) | 11mo | $359,900 | $112 | 66 |
| 5485 River Thames Rd | 0.12mi | 4/3.5 (+1) | 2,822 (-12%) | 7mo | $270,000 | $96 | 61 |
| 5325 Red Fox Rd | 0.35mi | 3/2.5 | 2,974 (-7%) | 10mo | $328,000 | $110 | 61 |
| 5146 Canton Heights Dr | 0.47mi | 4/3.5 (+1) | 3,393 (+6%) | 1mo | $380,000 | $112 | 61 |
| 5465 Saratoga Dr | 0.22mi | 4/2.5 (+1) | 2,875 (-10%) | 9mo | $265,000 | $92 | 58 |
| 5308 Briarfield Rd | 0.15mi | 4/2.0 (+1) | 2,737 (-14%) | 11mo | $187,200 | $68 | 50 |
| 5519 Pine Lane Dr | 0.54mi | 3/3.0 | 2,752 (-14%) | 5mo | $150,000 | $55 | 47 |
| 445 Armour Dr | 0.74mi | 4/3.0 (+1) | 2,917 (-9%) | 3mo | $347,777 | $119 | 43 |
| 916 Newland St | 0.55mi | 4/3.5 (+1) | 2,824 (-12%) | 9mo | $305,000 | $108 | 40 |
Match score weights: distance 35% · size 25% · config 20% · recency 20%. Top-matched comps best support the ARV.
Projected returns pro-forma
-3.0% appreciation · 7.9% rent growth · sell at horizon
- IRR
- -18.5%
- Equity multiple
- 0.32×
- Total profit
- $-57,174
- Equity at exit
- $44,716
- IRR
- -2.8%
- Equity multiple
- 0.77×
- Total profit
- $-19,690
- Equity at exit
- $25,930
Cash invested: $83,972 (down + closing). Projections, not guarantees.
Landlord ↔ Tenant lean methodology
- Overall (STATE)
- 90 Strongly Landlord-Friendly
- State Mississippi
- 90 Strongly Landlord-Friendly · R+11
- County
- — inherits STATE
- City
- — inherits STATE
ZIP-level market 39211
- Rents YoY
- 7.9%
- Active inventory
- 221
- Price-to-rent
- 10.3×
Monthly cashflow live
- Estimated rent
- $2,420 medium interval (Pro) →
- Mortgage (P&I)
- −$1,573
- Tax from tax record
- −$531 /mo · $6,367/yr
- Insurance
- −$125
- HOA
- −$17
- Vacancy / Maint / Mgmt
- −$508
- Net cashflow
- $-334
Break-even live
Sensitivity live
| Price | -10% $-164 | -5% $-249 | +0% $-334 | +5% $-418 | +10% $-503 |
|---|---|---|---|---|---|
| Rent | -10% $-525 | -5% $-429 | +0% $-334 | +5% $-238 | +10% $-142 |
| Rate | -1.0pp $-182 | -0.5pp $-257 | base $-334 | +0.5pp $-411 | +1.0pp $-490 |
UW: 25.0% down · 7.5% · 30yr · 1.5% tax · 5.0% vac · 8.0% maint · 8.0% mgmt
Financing live
Cash to close
- Down payment
- $74,975
- Closing costs
- $8,997
- Reserves months
- —
- Total cash needed
- —
Loan-product check · same deal, 3 products live
Conventional
25% down · 7.5% · 30yr
- Down + closing
- —
- Monthly P&I
- —
- Monthly cashflow
- —
- DSCR
- —
- Eligible?
- —
Personal DTI + credit; lowest rate.
DSCR
20% down · 8.5% · 30yr
- Down + closing
- —
- Monthly P&I
- —
- Monthly cashflow
- —
- DSCR
- —
- Eligible?
- —
No personal income docs; deal must DSCR.
Hard money
10% down · 12.0% · 12mo
- Down + closing
- —
- Monthly P&I
- —
- Monthly cashflow
- —
- DSCR
- —
- Eligible?
- —
Short-term bridge; refi at stabilization.
Rent comps 2 comps
| Address | Beds | Baths | Sqft | Rent | $/sqft | DOM | Units | Dist |
|---|---|---|---|---|---|---|---|---|
| 1046 Newland St Jackson, MS | 4.0 | 2.5 | 2700 | $3,200 | $1.19 | 25d | 1 | 0.52mi |
| 5855 Canton Park Dr Jackson, MS | 4.0 | 2.0 | 2401 | $1,675 | $0.70 | 15d | 1 | 1.05mi |
HOA detail
- Monthly dues
- $17 · $204/yr
Listing history 50 events
-
2026-06-22days on market $299,900 Active 65 DOM
-
2026-06-18days on market $299,900 Active 62 DOM
-
2026-06-17days on market $299,900 Active 61 DOM
-
2026-06-16days on market $299,900 Active 60 DOM
-
2026-06-15days on market $299,900 Active 59 DOM
-
2026-06-14days on market $299,900 Active 57 DOM
-
2026-06-13days on market $299,900 Active 56 DOM
-
2026-06-10days on market $299,900 Active 54 DOM
-
2026-06-09days on market $299,900 Active 53 DOM
-
2026-06-08days on market $299,900 Active 52 DOM
-
2026-06-07days on market $299,900 Active 51 DOM
-
2026-06-05days on market $299,900 Active 48 DOM
-
2026-06-03days on market $299,900 Active 47 DOM
-
2026-06-02days on market $299,900 Active 46 DOM
-
2026-06-01days on market $299,900 Active 45 DOM
-
2026-05-31days on market $299,900 Active 44 DOM
-
2026-05-30days on market $299,900 Active 43 DOM
-
2026-04-17$299,900 Active
-
2025-11-29price $299,998
-
2025-11-23status Active
-
2025-11-21price $299,999
-
2025-11-01price $316,499
-
2025-09-15price $319,999
-
2025-08-25status Active
-
2025-08-07status Pending
-
2025-08-07historical
-
2025-08-07historical
-
2025-07-02price $321,899
-
2025-06-20price $321,900
-
2025-05-22$324,900 Active
-
2024-02-17historical $3,110
-
2024-01-17$3,110
-
2024-01-12status Pending
Show marketing remark (924 chars)
SELLER FINANCING AVAILABLE! Welcome to Heatherwood subdivision, where you'll find this charming 5 bedroom 4 bathroom home for sale. This lovely home boasts 3,131 square feet of space, providing ample room for all your needs. It is full of 70's charm, with unique architectural features that add to its character. Recent updates have been made to appeal to the modern buyer. The five bedrooms are perfect for a large family or for those who need extra space for an office or guest room-which has a private entrance from the driveway. The four bathrooms provides space for everyone to have privacy. The updated kitchen has all stainless steel appliances and granite countertops. The living room is spacious and perfect for entertaining guests or relaxing after a long day. If you are looking for a comfortable and charming home, look no further than this gem in Heatherwood subdivision. Call your REALTOR to schedule a tour.
-
2024-01-12soldstatus Closed
Show marketing remark (924 chars)
SELLER FINANCING AVAILABLE! Welcome to Heatherwood subdivision, where you'll find this charming 5 bedroom 4 bathroom home for sale. This lovely home boasts 3,131 square feet of space, providing ample room for all your needs. It is full of 70's charm, with unique architectural features that add to its character. Recent updates have been made to appeal to the modern buyer. The five bedrooms are perfect for a large family or for those who need extra space for an office or guest room-which has a private entrance from the driveway. The four bathrooms provides space for everyone to have privacy. The updated kitchen has all stainless steel appliances and granite countertops. The living room is spacious and perfect for entertaining guests or relaxing after a long day. If you are looking for a comfortable and charming home, look no further than this gem in Heatherwood subdivision. Call your REALTOR to schedule a tour.
-
2024-01-11soldstatus
-
2023-12-03$315,000 Active
Show marketing remark (924 chars)
SELLER FINANCING AVAILABLE! Welcome to Heatherwood subdivision, where you'll find this charming 5 bedroom 4 bathroom home for sale. This lovely home boasts 3,131 square feet of space, providing ample room for all your needs. It is full of 70's charm, with unique architectural features that add to its character. Recent updates have been made to appeal to the modern buyer. The five bedrooms are perfect for a large family or for those who need extra space for an office or guest room-which has a private entrance from the driveway. The four bathrooms provides space for everyone to have privacy. The updated kitchen has all stainless steel appliances and granite countertops. The living room is spacious and perfect for entertaining guests or relaxing after a long day. If you are looking for a comfortable and charming home, look no further than this gem in Heatherwood subdivision. Call your REALTOR to schedule a tour.
-
2022-06-11historical
-
2022-06-01price $305,000
-
2022-05-13$319,999 Active
-
2022-05-10historical
-
2022-05-06$320,000 Active
-
2022-01-12soldstatus
-
2021-10-08historical
-
2021-08-27historical
-
2021-07-13$281,600
-
2020-04-15$269,900
-
2016-06-02soldstatus
-
2016-06-02soldstatus
-
2015-07-04$255,000
-
2006-10-13soldstatus
ⓘ Source: listings_history table (triggers on properties + properties_extension) + one-shot
backfill from property_details.listing_events for pre-trigger history.
Tax reassessment forecast MS · Resets to sale price
- Current annual tax
- $6,367 · $531/mo
- Projected year-2 tax
- $6,367 · $531/mo
- Expected delta
- $0/yr ($0/mo · 0.0%)
ⓘ Screening estimate from a state-policy table — verify with the county assessor before closing.
Climate risk First Street
- Flood 1/10 Low FEMA zone X (unshaded) · 0% chance over 30 yrs
- Wildfire 1/10 Low
- Heat 7/10 Severe 7 d/yr ≥108°F today · 20 d/yr by 30 yrs out
- Wind 8/10 Severe 80% chance of damaging wind over 30 yrs
- Air quality 2/10 Low 0 unhealthy d/yr today · 1 by 30 yrs out
Nearby sold comps map
Loading sold comps map…
Walkable amenities ~0.75 mi
Loading nearby amenities…
Taxation est. · year 1
- Rental income
- $29,040
- − Mortgage interest
- −$16,799
- − Property taxes
- −$6,367
- − Insurance
- −$1,500
- − Repairs & maintenance
- −$2,323
- − Management
- −$2,323
- − HOA
- −$204
- − Depreciation
- −$8,724
- Taxable loss
- −$9,201
- Est. tax savings @ 24.0%
- +$2,208
- After-tax cash flow
- $-1,794/yr
For passive investors: Depreciation is non-cash, so a rental often shows a tax loss while cash-flowing — sheltering income. Rental losses are passive: they offset passive income freely, and up to $25,000/yr can offset ordinary (W-2) income if you actively participate and your MAGI is under $100k (phasing out to $0 by $150k); unused losses carry forward. On sale, claimed depreciation is recaptured at up to 25%, and gains may owe capital-gains tax (a 1031 exchange can defer both). Figures are a year-1 estimate at your 24.0% rate — not tax advice; consult a CPA.
Schools (NCES district)
- District
- Jackson Public School District
- NCES district ID
- 2802190
- Math proficiency
- 9% ▼ -14.00%
- Reading proficiency
- 18% ▼ -7.00%
- Median HH income
- $33,234
- Composite
- 10.89/100
- National rank
- #9755
- State rank
- #112 of 130 in MS
Livability — Jackson
- Score
- 68/100
- State rank
- #66
- US rank
- #9695
Category grades
Schools grade is shown separately in the Schools card above.
Census & demographics
- Census place
- Jackson, MS
- County
- Hinds County · 167,040 people
- City population
- 140,204
- Metro
- Jackson, MS
- Population (ZIP)
- 23,838
- Household income
- $69,426
- Rent vs Own
- Severe rent burden
- 736.0
Population outlook (Hinds County) Hauer SSP2
- Today (2025)
- 242,528 people
- By 2030
- 241,113 · -0.6%
- By 2040
- 235,557 · -2.9%
- By 2050
- 226,946 · -6.4%
- By 2075
- 199,995 · -17.5%
- By 2100
- 164,165 · -32.3%
Race, ethnicity, and origin ACS 2023
- Neighborhood character
- Majority Black (59%)
- Race & ethnicity
- Black 59% White 36% Hispanic / Latino 3% Two or more races 2%
- Common ancestry
- Serbian 2% Italian 2% Slovak 1%
- Foreign-born
- 2% · Canada, China
- Languages at home
- 96% English-only · Spanish 3% Chinese 1%
Political lean MEDSL · Hinds
- 2024 margin
- Solid D (+46.1) · D 72.4% · R 26.3% · Other 1.4%
- 2008→2024 swing
- +7.1pp toward D · 2008: 39.0pp · 2024: 46.1pp
- All cycles
- 2024: D+46.1 2020: D+48.3 2016: D+43.7 2012: D+45.1 2008: D+39.0
Not yet ingested
- Civics
- —
Market trends
- HPI YoY
- ▼ -135.99%
- Current HPI
- 145.5192
- Rent YoY
- ▲ 7.90%
- Metro
- Jackson, MS
- State GDP YoY
- —
- F500 in state
- 0
Price history
+7.1% since first listed39 events — show timeline
- 2026-04-17 Listed $299,900 MLSU
- 2025-11-29 Price Changed $299,998 MLSU
- 2025-11-23 Relisted — MLSU
- 2025-11-21 Price Changed $299,999 MLSU
- 2025-11-01 Price Changed $316,499 MLSU
- 2025-09-15 Price Changed $319,999 MLSU
- 2025-08-25 Relisted — MLSU
- 2025-08-07 Pending — MLSU
- 2025-08-07 Listing Removed — MLSU
- 2025-08-07 Listing Removed — MLSU
- 2025-07-02 Price Changed $321,899 MLSU
- 2025-06-20 Price Changed $321,900 MLSU
- 2025-05-22 Listed $324,900 MLSU
- 2024-02-17 Rental Removed $3,110 RENT.
- 2024-01-17 Listed for Rent $3,110 RENT.
- 2024-01-12 Pending — MLSU
- 2024-01-12 Sold (MLS) — MLSU
- 2024-01-11 Sold (Public Records) — Public Records
- 2023-12-03 Listed $315,000 MLSU
- 2022-06-11 Listing Removed — MLSU
- 2022-06-01 Price Changed $305,000 MLSU
- 2022-05-13 Listed $319,999 MLSU
- 2022-05-10 Listing Removed — MLSU
- 2022-05-06 Listed $320,000 MLSU
- 2022-01-12 Sold (Public Records) — Public Records
- 2021-10-08 Listing Removed — MLSU
- 2021-08-27 Listing Removed — MLSU
- 2021-07-13 Listed $281,600 MLSU
- 2020-04-15 Listed $269,900 MLSU
- 2016-06-02 Sold (Public Records) — Public Records
- 2016-06-02 Sold (MLS) — MLSU
- 2015-07-04 Listed $255,000 MLSU
- 2006-10-13 Sold (Public Records) — Public Records
- 2006-10-13 Sold (MLS) — MLSU
- 2006-06-14 Listed $280,000 MLSU
- 2005-11-29 Sold (Public Records) — Public Records
- 2000-03-20 Sold (Public Records) — Public Records
- 2000-01-28 Sold (Public Records) — Public Records
- 1978-11-01 Sold (Public Records) — Public Records
Property tax history
+5.8%/yrLatest (2025): $6,367 · +2.7% YoY. Source: county tax records.
Cash-flow waterfall
monthlySold comps — $/sqft
last 12 mo · ≤1 miLoading sold comps…