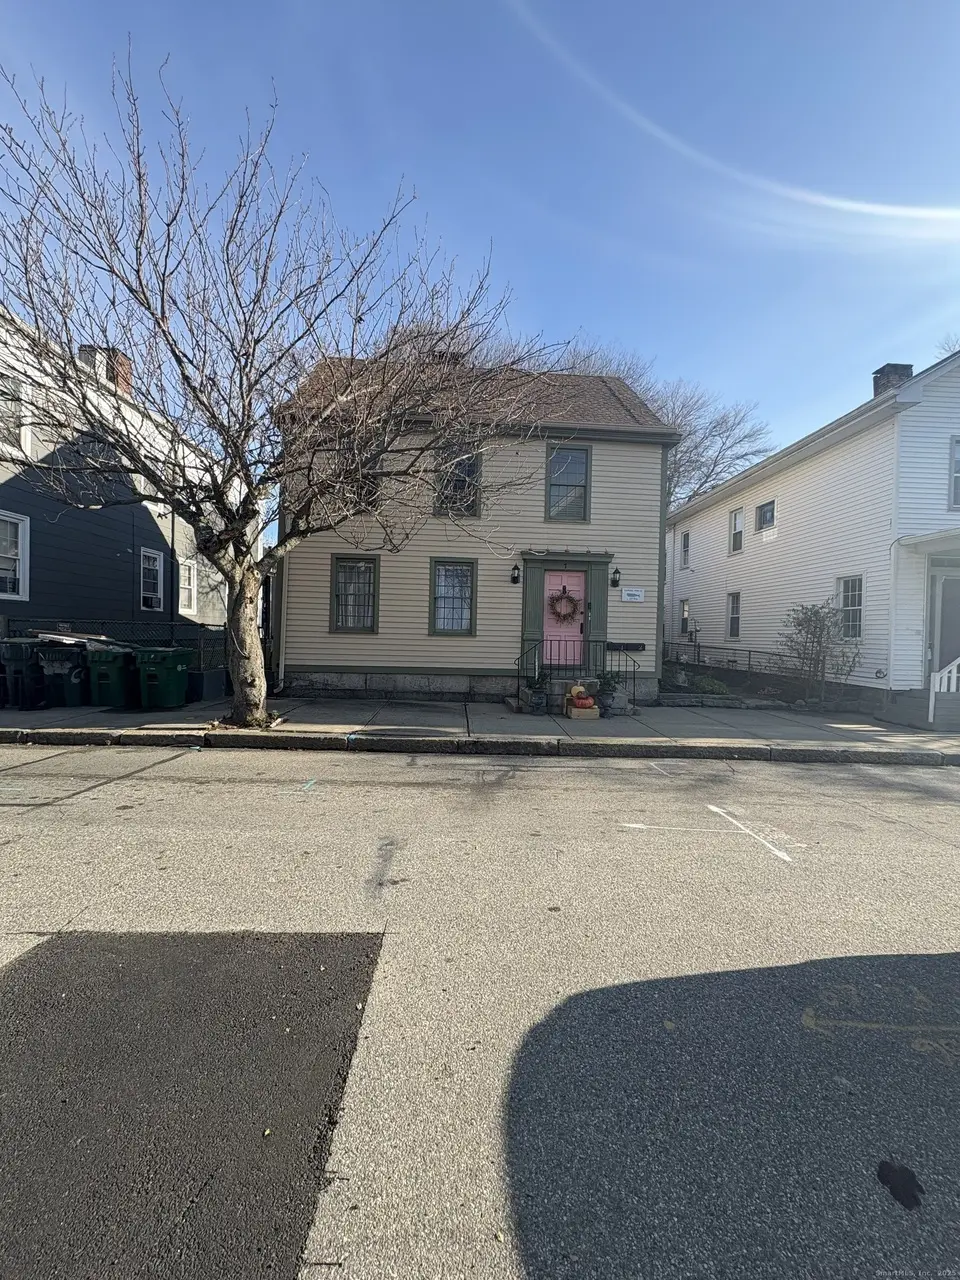
7 Coit St #2 · New London, CT
Flood risk No data
- FEMA flood zone
- —
- Chance of flooding over 30 yrs
- —
- Est. flood insurance / yr
- —
Fire risk No data
- Est. fire insurance / yr
- —
Heat risk No data
- Hot days now (above threshold)
- —
- Hot days in 30 yrs
- —
Wind risk No data
- Chance of severe wind over 30 yrs
- —
Air-quality risk No data
- Unhealthy air days now
- —
- Unhealthy air days in 30 yrs
- —
Risk factors via First Street. Map © Google.
Why this score? — see what drove the C grade
The composite is a weighted blend of 9 inputs, each scored 0–100. Each bar is that input's sub-score; the figure is the points it added to the 100-point composite (weight × sub-score).
- Cash flow +21.3/30.0
- ARV discount +15.0/15.0
- DSCR +6.8/10.0
- 1% rule +5.7/10.0
- Livability +3.7/5.0
- Rent growth +2.7/5.0
- Condition / age +2.5/5.0
- Schools +1.4/10.0
- Appreciation +0.0/10.0
$190,000
🖨 Deal sheet 📄 Offer letter ✓ Due diligence
Listing remarks
Charming historic condo unit for sale located in downtown. This unit has been renovated and offers timeless details with modern upgrades.
Key facts
- Renovated
- Modern upgrades
- Historic condo unit
Tags
Property features AI
Finance
- HOA & community: Pets allowed (see association documents for details)
Exterior
- Parking: Off-street parking; One parking space
- Utilities: Public water connected; Public sewer connected; Hot water: other
- Home design: Condominium (unit in a two-unit building); End unit; Located on the 2nd floor; Part of the Bream Cove Four complex
- Construction: Frame construction
- Exterior features: Vinyl siding; Located in a historic district
Interior
- Kitchen: Electric range; Refrigerator; Dishwasher
- Bedrooms: Three bedrooms
- Bathrooms: One full bathroom
- Heating & cooling: Hot air heating; Natural gas furnace; Wall-mounted cooling unit
- Interior features: Partial unfinished basement; Attic with walk-up access; Five total rooms; Single-level unit
- Laundry & utility: Washer and dryer on the main level
Neighborhood map
What this means for you Summary
Snapshot
- This is a 3-bed/1.0-bath condo listed at $190k.
Deal economics
- At list price, monthly cash flow is $279 ($3k/yr) — positive.
- The deal already cash-flows at list — no discount required.
- Meets the 1% rule at list price ($2k rent vs $190k).
- Recommended offer: $184k (3.0% below list) — sets the bar for market timing.
- Cap rate 8.1% vs local median 4.3% in New London — top-decile yield for the area; either an underpriced asset or a hidden risk that comps aren't pricing in. Stress-test before assuming the spread holds.
Location & tenants
- Location reads 74/100 on livability (#66 in CT, #4,772 nationally) — a middle-class / working-renter tenant base. Strengths: health & safety A+, housing A-, crime B+; Watch: employment D+, schools F, amenities F.
- New London School District (urban): math 11% / reading 21% proficiency, ranked #149 of 153 in CT (top 97%) — low school quality limits family demand, transient renter base, plan for 1-2y turnover; 72% free/reduced lunch — lower-income household profile, screen leases tightly.
- Market conditions: Rents flat; 69 active listings in the ZIP; 22 comparable units currently listed for rent nearby; rentals lingering (median 44d on market — plan ~5-8 weeks vacancy on turnover, expect pricing pressure); 55% of comp listings sitting > 30 days — soft ceiling on asking rent; 487 units permitted in Southeastern Connecticut Planning Region in 2024 (244 in 5+ unit buildings).
- This rent runs 41% of the median local income ($59k/yr) — at the standard rent-burdened threshold; future hikes will face affordability resistance.
Forward outlook
- Local home prices are declining (-3.0%/yr); year-one equity from $1k of loan paydown is wiped out by about $6k of value loss. Plan a longer hold.
Negotiation context
- It's been on market 43 days — a 3% lower offer ($184k) is reasonable based on typical stale-listing flexibility.
- 6 sale attempts since 2y ago; this cycle's ask is 9900% above the opening price — seller raised mid-cycle; expect resistance to lowballs.
Risks & watch-outs
- Watch-outs: built in 1740 — expect roof / HVAC / electrical / plumbing capex.
Questions for the listing agent
- It's been on market 43 days. Have you received any prior offers? Is the seller open to a 3% concession, seller financing, or rate buy-down credit?
- Built in 1740 — when were the roof, HVAC, electrical panel, plumbing, and water heater last replaced?
- Any open or pending special assessments — roof, HVAC, plumbing, elevator, façade? What's the per-unit balance and payoff schedule, and is the seller paying it off at close or rolling it to the buyer?
- Is there a deadline driving the sale (1031 exchange, divorce, estate, relocation)? That informs how much negotiation room exists.
- Schools are F-rated, which usually means shorter tenancies and higher turnover. Who's the typical renter profile here, and what's been the actual vacancy rate?
- What's the average days-on-market for RENTAL listings here right now (not sales)? A rising rental-DOM trend means longer vacancies and softer asking-rent achievability than the comps imply.
- What's the recent tenant-quality profile in this submarket — average credit score on applications, eviction rate, late-payment / NSF rate, and stable-employment percentage? A property-management company in the area should have these aggregated.
- How much new apartment / multifamily construction is in the pipeline within 1–3 miles? Heavy new supply (>2% of stock underway) typically softens rents 12–24 months out; light construction supports rent growth.
Investment metrics
- 1% rule
- 1.07% ✓
- Cap rate
- 8.05%
- Cash-on-cash
- 6.28%
- DSCR
- 1.28
- GRM
- 7.8
CMA / ARV
- ARV (median comp)
- $320,684
- List price
- $190,000
- Delta
- -40.75%
- Verdict
- UNDERPRICED
- Comps
- 20 within 1.0 mi
Projected returns pro-forma
-3.0% appreciation · 0.7% rent growth · sell at horizon
- IRR
- -9.3%
- Equity multiple
- 0.67×
- Total profit
- $-17,610
- Equity at exit
- $28,330
- IRR
- -3.3%
- Equity multiple
- 0.81×
- Total profit
- $-10,367
- Equity at exit
- $16,428
Cash invested: $53,200 (down + closing). Projections, not guarantees.
Landlord ↔ Tenant lean methodology
- Overall (STATE)
- 27 Tenant-Leaning
- State Connecticut
- 27 Tenant-Leaning · D+7
- County
- — inherits STATE
- City
- — inherits STATE
ZIP-level market 06320
- Home prices YoY
- -20.7%
- Rents YoY
- 0.7%
- Active inventory
- 69
- Price-to-rent
- 7.8×
Monthly cashflow live
- Estimated rent
- $2,035 high interval (Pro) →
- Mortgage (P&I)
- −$996
- Tax from tax record
- −$254 /mo · $3,047/yr
- Insurance
- −$79
- HOA
- −$0
- Vacancy / Maint / Mgmt
- −$427
- Net cashflow
- $279
Break-even live
UW: 25.0% down · 7.5% · 30yr · 1.5% tax · 5.0% vac · 8.0% maint · 8.0% mgmt
Financing live
Cash to close
- Down payment
- $47,500
- Closing costs
- $5,700
- Reserves months
- —
- Total cash needed
- —
Loan-product check · same deal, 3 products live
Conventional
25% down · 7.5% · 30yr
- Down + closing
- —
- Monthly P&I
- —
- Monthly cashflow
- —
- DSCR
- —
- Eligible?
- —
Personal DTI + credit; lowest rate.
DSCR
20% down · 8.5% · 30yr
- Down + closing
- —
- Monthly P&I
- —
- Monthly cashflow
- —
- DSCR
- —
- Eligible?
- —
No personal income docs; deal must DSCR.
Hard money
10% down · 12.0% · 12mo
- Down + closing
- —
- Monthly P&I
- —
- Monthly cashflow
- —
- DSCR
- —
- Eligible?
- —
Short-term bridge; refi at stabilization.
Rent comps 22 comps
| Address | Beds | Baths | Sqft | Rent | $/sqft | DOM | Units | Dist |
|---|---|---|---|---|---|---|---|---|
| 28 Reed St #1 New London, CT | 2.0 | 1.5 | 1131 | $1,820 | $1.61 | 20d | 1 | 0.06mi |
| 157 Green St Unit 2B New London, CT | 2.0 | 1.0 | 1134 | $2,650 | $2.34 | 43d | 1 | 0.18mi |
| 13 Thompson Ct New London, CT | 3.0 | 1.0 | 1000 | $1,900 | $1.90 | 43d | 1 | 0.28mi |
| 50 Montauk Ave Unit 1 New London, CT | 2.0 | 1.0 | 936 | $1,600 | $1.71 | 20d | 1 | 0.36mi |
| 121 Shaw St Unit 1 New London, CT | 2.0 | 2.0 | 1173 | $1,700 | $1.45 | 43d | 1 | 0.39mi |
| 1 Hamilton St #3 New London, CT | 2.0 | 1.5 | 1248 | $2,300 | $1.84 | 43d | 1 | 0.41mi |
| 42 Jefferson Ave New London, CT | 2.0 | 1.0 | 825 | $1,600 | $1.94 | 43d | 1 | 0.42mi |
| 835 Bank St New London, CT | 2.0 | 1.0 | 1031 | $1,750 | $1.70 | 43d | 1 | 0.44mi |
| 848 Bank St Unit 1st Floor New London, CT | 2.0 | 1.0 | 913 | $1,850 | $2.03 | 43d | 1 | 0.46mi |
| 120 Broad St New London, CT | 2.0 | 1.0–3.0 | 977 | $2,500 | $2.56 | 20d | 7 | 0.47mi |
| 159 Connecticut Ave New London, CT | 3.0 | 1.0 | 1047 | $1,850 | $1.77 | 43d | 1 | 0.57mi |
| 196 Ocean Ave Unit 2 New London, CT | 3.0 | 2.0 | 1400 | $1,900 | $1.36 | 20d | 1 | 0.75mi |
| 78 West St Unit 2A New London, CT | 4.0 | 4.0 | 1250 | $1,895 | $1.52 | 20d | 1 | 0.80mi |
| 195 Pequot Ave New London, CT | 2.0 | 1.0 | 1450 | $2,000 | $1.38 | 43d | 1 | 1.05mi |
| 216 Vauxhall St Unit 2 New London, CT | 2.0 | 1.0 | 912 | $1,700 | $1.86 | 43d | 1 | 1.08mi |
| 16 School St Unit 2 New London, CT | 2.0 | 1.0 | 1000 | $2,300 | $2.30 | 13d | 1 | 1.09mi |
| 16 Grove St New London, CT | 2.0 | 1.0 | 960 | $1,500 | $1.56 | 43d | 1 | 1.12mi |
| 37 Hamilton Ave Groton, CT | 2.0 | 1.0 | 1300 | $2,200 | $1.69 | 20d | 1 | 1.16mi |
| 394 Willetts Ave Waterford, CT | 1.0–2.0 | 1.0–2.0 | 963 | $2,725 | $2.83 | 20d | 7 | 1.18mi |
| 394 Willetts Ave Waterford, CT | 1.0–2.0 | 1.0–2.0 | 963 | $2,725 | $2.83 | 43d | 14 | 1.18mi |
| 16 Benham Rd Unit D Groton, CT | 2.0 | 1.0 | 1350 | $2,400 | $1.78 | 20d | 1 | 1.31mi |
| 14 Clark Ln Waterford, CT | 3.0 | 1.5 | 1230 | $2,600 | $2.11 | 13d | 1 | 1.47mi |
HOA detail condo
- Monthly dues
- $0 · $0/yr
- Assessments
- None detected in remarks — confirm with the listing agent.
Listing history 31 events
-
2026-06-19days on market $190,000 Active 43 DOM
-
2026-06-18days on market $190,000 Active 42 DOM
-
2026-06-17days on market $190,000 Active 41 DOM
-
2026-06-16days on market $190,000 Active 40 DOM
-
2026-06-15days on market $190,000 Active 39 DOM
-
2026-06-14days on market $190,000 Active 37 DOM
-
2026-06-13days on market $190,000 Active 36 DOM
-
2026-06-10days on market $190,000 Active 34 DOM
-
2026-06-09days on market $190,000 Active 33 DOM
-
2026-06-08days on market $190,000 Active 32 DOM
-
2026-06-07days on market $190,000 Active 31 DOM
-
2026-06-05days on market $190,000 Active 28 DOM
-
2026-06-03days on market $190,000 Active 27 DOM
-
2026-06-02days on market $190,000 Active 26 DOM
-
2026-06-01days on market $190,000 Active 25 DOM
-
2026-05-31days on market $190,000 Active 24 DOM
-
2026-05-30days on market $190,000 Active 23 DOM
-
2026-05-06$190,000 Active 137-char remark
-
2026-02-10historical
-
2026-01-16status Active
-
2026-01-09historical Under Contract - Continue to Show
-
2025-12-08$195,000 Active
-
2025-08-28$210,000 Active
-
2024-08-13historical
-
2024-07-30status Active
-
2024-06-20status Under Contract
-
2024-05-31historical Under Contract - Continue to Show
-
2024-05-19price $205,000
-
2024-04-19price $209,000
-
2024-03-26$215,000 Active
-
2024-03-20historical
ⓘ Source: listings_history table (triggers on properties + properties_extension) + one-shot
backfill from property_details.listing_events for pre-trigger history.
Tax reassessment forecast CT · Partial reset (capped growth)
- Current annual tax
- $3,047 · $254/mo
- Projected year-2 tax
- $3,556 · $296/mo
- Expected delta
- +$510/yr (+$42/mo · 16.7%)
ⓘ Screening estimate from a state-policy table — verify with the county assessor before closing.
Nearby sold comps map
Loading sold comps map…
Walkable amenities ~0.75 mi
Loading nearby amenities…
Taxation est. · year 1
- Rental income
- $24,426
- − Mortgage interest
- −$10,643
- − Property taxes
- −$3,047
- − Insurance
- −$950
- − Repairs & maintenance
- −$1,954
- − Management
- −$1,954
- − Depreciation
- −$5,527
- Taxable income
- $351
- Est. tax owed @ 24.0%
- −$84
- After-tax cash flow
- $3,259/yr
For passive investors: Depreciation is non-cash, so a rental often shows a tax loss while cash-flowing — sheltering income. Rental losses are passive: they offset passive income freely, and up to $25,000/yr can offset ordinary (W-2) income if you actively participate and your MAGI is under $100k (phasing out to $0 by $150k); unused losses carry forward. On sale, claimed depreciation is recaptured at up to 25%, and gains may owe capital-gains tax (a 1031 exchange can defer both). Figures are a year-1 estimate at your 24.0% rate — not tax advice; consult a CPA.
Schools (NCES district)
- District
- New London School District
- NCES district ID
- 0902820
- Math proficiency
- 11% ▼ -11.00%
- Reading proficiency
- 21% ▼ -11.00%
- Median HH income
- $40,640
- Composite
- 13.66/100
- National rank
- #9502
- State rank
- #149 of 153 in CT
Livability — New London
- Score
- 74/100
- State rank
- #66
- US rank
- #4772
Category grades
Schools grade is shown separately in the Schools card above.
Census & demographics
- Census place
- New London, CT
- County
- New London County · 147,197 people
- City population
- 27,703
- Metro
- Norwich-New London, CT
- Population (ZIP)
- 27,703
- Household income
- $59,170
- Rent vs Own
- Severe rent burden
- 2014.0
Population outlook (Southeastern Connecticut County) Hauer SSP2
- By 2040
- 293,442
Race, ethnicity, and origin ACS 2023
- Neighborhood character
- Diverse neighborhood (Simpson 0.66)
- Race & ethnicity
- White 45% Hispanic / Latino 34% Black 13% Two or more races 13% Asian 2%
- Hispanic origin (detail)
- Mexican 1% Puerto Rican 17% Dominican 7%
- Common ancestry
- Romanian 3% Hispanic 3% Lithuanian 1%
- Foreign-born
- 19% · Canada, Jamaica
- Languages at home
- 67% English-only · Spanish 27% French/Haitian/Cajun 2% Other Indo-European 1%
Political lean MEDSL · Southeastern Connecticut
- 2024 margin
- D (+13.0) · D 55.6% · R 42.6% · Other 1.8%
- All cycles
- 2024: D+13.0
Not yet ingested
- Civics
- —
Market trends
- HPI YoY
- ▼ -71.39%
- Current HPI
- 273.3024
- Rent YoY
- ▲ 0.70%
- Metro
- Norwich-New London, CT
- State GDP YoY
- ▲ 1.06%
- F500 in state
- 38
Industry mix (Fortune 500 HQ in CT)
| Industry | F500 HQs | Revenue |
|---|---|---|
| Industrial Machinery | 4 | $38B |
|
||
| Insurance | 3 | $71B |
|
||
| Financial Services | 2 | $25B |
|
||
| Transportation / Logistics | 2 | $18B |
|
||
| Healthcare | 1 | $247B |
|
||
| Telecommunications | 1 | $55B |
|
||
Price history
-99.1% since first listed14 events — show timeline
- 2026-06-13 Listed for Rent $1,900 SMARTMLS
- 2026-05-06 Listed $190,000 Smart MLS
- 2026-02-10 Listing Removed — Smart MLS
- 2026-01-16 Relisted — Smart MLS
- 2026-01-09 Contingent — Smart MLS
- 2025-12-08 Listed $195,000 Smart MLS
- 2024-08-13 Listing Removed — Smart MLS
- 2024-07-30 Relisted — Smart MLS
- 2024-06-20 Pending — Smart MLS
- 2024-05-31 Contingent — Smart MLS
- 2024-05-19 Price Changed $205,000 Smart MLS
- 2024-04-19 Price Changed $209,000 Smart MLS
- 2024-03-26 Listed $215,000 Smart MLS
- 2024-03-20 Coming Soon — Smart MLS
Property tax history
-1.2%/yrLatest (2023): $3,047 · -0.2% YoY. Source: county tax records.
Cash-flow waterfall
monthlySold comps — $/sqft
last 12 mo · ≤1 miLoading sold comps…