716 SW 2nd Way · Pompano Beach, FL
Flood risk 4/10 · Minor
- FEMA flood zone
- AH
- Chance of flooding over 30 yrs
- 0.13%
- Est. flood insurance / yr
- $1,142 – $2,507
Fire risk 1/10 · Minimal
- Est. fire insurance / yr
- $947 – $1,759
Heat risk 10/10 · Severe
- Hot days now (above 106°F)
- 7 days/yr
- Hot days in 30 yrs
- 26 days/yr
Wind risk 10/10 · Severe
- Chance of severe wind over 30 yrs
- 99.0%
Air-quality risk 2/10 · Minimal
- Unhealthy air days now
- 1 days/yr
- Unhealthy air days in 30 yrs
- 2 days/yr
Risk factors via First Street. Map © Google.
Why this score? — see what drove the C+ grade
The composite is a weighted blend of 9 inputs, each scored 0–100. Each bar is that input's sub-score; the figure is the points it added to the 100-point composite (weight × sub-score).
- Cash flow +21.2/30.0
- ARV discount +15.0/15.0
- 1% rule +7.4/10.0
- DSCR +6.8/10.0
- Schools +4.1/10.0
- Livability +3.7/5.0
- Rent growth +3.0/5.0
- Condition / age +2.5/5.0
- Appreciation +0.0/10.0
$325,000
🖨 Deal sheet 📄 Offer letter ✓ Due diligence
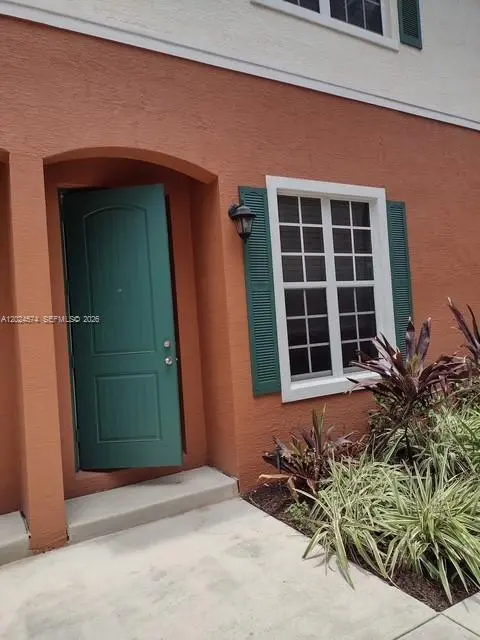
Listing remarks
Best Deal in town. 3 Bedrooms, 2.5 Baths townhouse with 1-car garage. Impact windows, newer AC with a HEPA filter, and a car charger. Short drive to the beach. Can be rented right away.
Key facts
- Newer ac
- Hepa filter
- Car charger
Tags
Property features AI
Finance
- Other: Property listed in fixer condition; Pets allowed with restrictions/conditions
- HOA & community: Monthly association fee of $300; Association amenities include clubhouse, fitness center, and pool; Association fees cover common areas, cable TV, pools, and security
Exterior
- Parking: 1-car garage; Garage door opener
- Security: Association provides security
- Utilities: Cable available
- Home design: 2 stories; Entry level is 1st floor; Attached property
- Construction: Block construction; Effective year built
- Exterior features: Association pool; No additional exterior features listed
Interior
- Kitchen: Electric range; Microwave
- Bedrooms: Primary bedroom on upper level
- Flooring: Tile flooring
- Bathrooms: 2 full bathrooms; 1 half bathroom
- Heating & cooling: Central heating (electric); Electric cooling
- Interior features: First floor entry; Upper-level primary bedroom; Blinds; Impact glass windows
- Laundry & utility: Washer; Dryer
Neighborhood map
What this means for you Summary
Snapshot
- This is a 3-bed/3.0-bath townhouse listed at $325k.
Deal economics
- At list price, monthly cash flow is $320 ($4k/yr) — positive.
- The deal already cash-flows at list — no discount required.
- Meets the 1% rule at list price ($4k rent vs $325k).
- Cap rate 8.0% vs local median 3.1% in Pompano Beach — top-decile yield for the area; either an underpriced asset or a hidden risk that comps aren't pricing in. Stress-test before assuming the spread holds.
Location & tenants
- Location reads 74/100 on livability (#284 in FL, #4,541 nationally) — a middle-class / working-renter tenant base. Strengths: commute A+, housing A+, cost of living B+; Watch: schools D+, employment D+, amenities F.
- Broward (suburban): math 42% / reading 53% proficiency, ranked #46 of 73 in FL (top 63%) — families likely to look elsewhere, expect single-tenant / working-renter base with shorter leases.
- Market conditions: Rents rising (+2.1%/yr); 338 active listings in the ZIP; 40 comparable units currently listed for rent nearby; rentals at typical pace (median 24d on market — plan ~3-4 weeks tenant-placement turnaround); 2,111 units permitted in Broward County in 2024 (1,265 in 5+ unit buildings).
- At $4,018/mo this rent would consume 74% of the median local household income ($65k/yr) (locally 2870% of renters already pay >50% of income on rent) — very limited rent-growth headroom before tenants either downsize or default.
Forward outlook
- Local home prices are declining (-3.0%/yr); year-one equity from $2k of loan paydown is wiped out by about $10k of value loss. Plan a longer hold.
- Broward County population projected at +34% by 2050 — long-run rental-demand tailwind backs the buy-and-hold thesis.
Negotiation context
- Only 7 days on market — expect competitive offers; lowballing is unlikely to land.
Risks & watch-outs
- Watch-outs: flood insurance adds $152/mo.
- Climate carrying-cost: in FEMA flood zone AH (mandatory federal flood insurance); severe wind risk, 99% chance of damaging wind over 30y; extreme-heat days projected 7→26/yr by 2055 (HVAC capex compounding) — expect insurance premiums to compound above CPI over the hold.
Questions for the listing agent
- What's the actual annual flood-insurance premium (NFIP or private), and is the property in a SFHA with mandatory coverage?
- What does the HOA fee cover, when was the last increase, and are there any pending special assessments or reserve-fund shortfalls?
- Is there a deadline driving the sale (1031 exchange, divorce, estate, relocation)? That informs how much negotiation room exists.
- Schools are D-rated, which usually means shorter tenancies and higher turnover. Who's the typical renter profile here, and what's been the actual vacancy rate?
- What's the average days-on-market for RENTAL listings here right now (not sales)? A rising rental-DOM trend means longer vacancies and softer asking-rent achievability than the comps imply.
- What's the recent tenant-quality profile in this submarket — average credit score on applications, eviction rate, late-payment / NSF rate, and stable-employment percentage? A property-management company in the area should have these aggregated.
- How much new for-sale + rental construction is in the pipeline within 1–3 miles? Heavy new supply typically softens prices + rents 12–24 months out; constrained supply supports both.
Investment metrics
- 1% rule
- 1.24% ✓
- Cap rate
- 8.04%
- Cash-on-cash
- 6.23%
- DSCR
- 1.28
- GRM
- 6.7
CMA / ARV
- ARV (on-the-fly)
- $399,672
- Comps found
- 3
Show comp detail 3 sales within ~0.75 mi
| Address | Dist | Beds/Ba | Sqft | Sold | Price | $/sf | Match |
|---|---|---|---|---|---|---|---|
| 712 SW 1st Ter | 0.18mi | 3/2.5 | 1,586 (0%) | 14mo | $400,000 | $252 | 78 |
| 664 SW 6th Ct | 0.26mi | 3/2.5 | 1,478 (-7%) | 18mo | $357,000 | $242 | 60 |
| 185 SW 6th Pl | 0.19mi | 3/2.5 | 1,784 (+12%) | 24mo | $475,000 | $266 | 48 |
Match score weights: distance 35% · size 25% · config 20% · recency 20%. Top-matched comps best support the ARV.
Projected returns pro-forma
-3.0% appreciation · 2.12% rent growth · sell at horizon
- IRR
- -10.8%
- Equity multiple
- 0.61×
- Total profit
- $-35,348
- Equity at exit
- $48,459
- IRR
- -2.9%
- Equity multiple
- 0.81×
- Total profit
- $-16,955
- Equity at exit
- $28,100
Cash invested: $91,000 (down + closing). Projections, not guarantees.
Landlord ↔ Tenant lean methodology
- Overall (STATE)
- 87 Strongly Landlord-Friendly
- State Florida
- 87 Strongly Landlord-Friendly · R+3
- County
- — inherits STATE
- City
- — inherits STATE
ZIP-level market 33060
- Home prices YoY
- -23.6%
- Rents YoY
- 2.1%
- Active inventory
- 338
- Price-to-rent
- 6.7×
Monthly cashflow live
- Estimated rent
- $4,018 high interval (Pro) →
- Mortgage (P&I)
- −$1,704
- Tax from tax record
- −$562 /mo · $6,739/yr
- Insurance
- −$135
- Flood insurance flood zone
- −$152 /mo · $1,824/yr
- HOA
- −$300
- Vacancy / Maint / Mgmt
- −$844
- Net cashflow
- $320
Break-even live
UW: 25.0% down · 7.5% · 30yr · 1.5% tax · 5.0% vac · 8.0% maint · 8.0% mgmt
Financing live
Cash to close
- Down payment
- $81,250
- Closing costs
- $9,750
- Reserves months
- —
- Total cash needed
- —
Loan-product check · same deal, 3 products live
Conventional
25% down · 7.5% · 30yr
- Down + closing
- —
- Monthly P&I
- —
- Monthly cashflow
- —
- DSCR
- —
- Eligible?
- —
Personal DTI + credit; lowest rate.
DSCR
20% down · 8.5% · 30yr
- Down + closing
- —
- Monthly P&I
- —
- Monthly cashflow
- —
- DSCR
- —
- Eligible?
- —
No personal income docs; deal must DSCR.
Hard money
10% down · 12.0% · 12mo
- Down + closing
- —
- Monthly P&I
- —
- Monthly cashflow
- —
- DSCR
- —
- Eligible?
- —
Short-term bridge; refi at stabilization.
Rent comps 40 comps
| Address | Beds | Baths | Sqft | Rent | $/sqft | DOM | Units | Dist |
|---|---|---|---|---|---|---|---|---|
| 618 SW 1st Ter Pompano Beach, FL | 3.0 | 3.0 | 1803 | $3,295 | $1.83 | 24d | 1 | 0.19mi |
| 1065 SW 4th Ter Pompano Beach, FL | 3.0 | 2.0 | 1292 | $4,000 | $3.10 | 7d | 1 | 0.33mi |
| 1040 Lyons Park Dr Pompano Beach, FL | 3.0 | 2.0 | 1564 | $3,500 | $2.24 | 24d | 1 | 0.36mi |
| 1029 SW 1st Ave Pompano Beach, FL | 4.0 | 2.0 | 1316 | $3,750 | $2.85 | 14d | 1 | 0.36mi |
| 1029 SW 1st Ave Pompano Beach, FL | 4.0 | 2.0 | 1316 | $3,750 | $2.85 | 7d | 1 | 0.36mi |
| 1048 SW 1st Ter Pompano Beach, FL | 3.0 | 3.0 | 1649 | $3,800 | $2.30 | 13d | 1 | 0.38mi |
| 850 SE 1st Ave Pompano Beach, FL | 3.0 | 3.0 | 1673 | $4,450 | $2.66 | 24d | 1 | 0.39mi |
| 151 SE 6th Ct Pompano Beach, FL | 4.0 | 3.0 | 2146 | $6,980 | $3.25 | 24d | 1 | 0.41mi |
| 151 SE 6th Ct Pompano Beach, FL | 4.0 | 3.0 | 2146 | $6,495 | $3.03 | 7d | 1 | 0.41mi |
| 1101 SW 1st Ave Pompano Beach, FL | 3.0 | 1.5 | 1206 | $3,400 | $2.82 | 24d | 1 | 0.41mi |
| 170 SE 7th St #170 Pompano Beach, FL | 3.0 | 2.5 | 1798 | $3,550 | $1.97 | 10d | 1 | 0.43mi |
| 170 SE 7th St #170 Pompano Beach, FL | 3.0 | 2.5 | 1798 | $3,650 | $2.03 | 24d | 1 | 0.43mi |
| 161 SE 5th Ct Pompano Beach, FL | 3.0 | 2.0 | 1605 | $5,150 | $3.21 | 24d | 1 | 0.47mi |
| 860 SW 10th St Pompano Beach, FL | 3.0 | 2.0 | 1354 | $3,300 | $2.44 | 24d | 1 | 0.51mi |
| 300 SE 8th Ct Pompano Beach, FL | 4.0 | 2.0 | 2204 | $6,200 | $2.81 | 24d | 1 | 0.58mi |
| 342 SW 14th St Pompano Beach, FL | 3.0 | 2.0 | 1458 | $5,000 | $3.43 | 24d | 1 | 0.61mi |
| 218 SW 1st Ct Pompano Beach, FL | 2.0 | 2.0 | 1912 | $2,100 | $1.10 | 24d | 1 | 0.62mi |
| 280 SE 3rd Ct Pompano Beach, FL | 3.0 | 2.0 | 2042 | $5,900 | $2.89 | 24d | 1 | 0.63mi |
| 200 SE 3rd St Pompano Beach, FL | 3.0 | 2.0 | 1481 | $6,999 | $4.73 | 11d | 1 | 0.63mi |
| 160 SE 12th Ct Pompano Beach, FL | 3.0 | 2.0 | 1372 | $12,000 | $8.75 | 21d | 1 | 0.67mi |
| 511 SE 5th St Pompano Beach, FL | 2.0 | 2.0 | 1276 | $4,200 | $3.29 | 24d | 1 | 0.78mi |
| 511 SE 5th St Pompano Beach, FL | 2.0 | 2.0 | 1276 | $4,200 | $3.29 | 21d | 1 | 0.78mi |
| 1001 SE 5th Ave Pompano Beach, FL | 3.0 | 2.0 | 1492 | $4,500 | $3.02 | 24d | 1 | 0.79mi |
| 20 NW 7th Ave #6 Pompano Beach, FL | 3.0 | 1.5 | 1088 | $2,150 | $1.98 | 14d | 1 | 0.82mi |
| 100 SW 17th St Pompano Beach, FL | 3.0 | 2.0 | 1788 | $4,500 | $2.52 | 7d | 1 | 0.86mi |
| 100 SW 17th St Pompano Beach, FL | 3.0 | 2.0 | 1788 | $4,500 | $2.52 | 24d | 1 | 0.86mi |
| 475 SE 1st St Pompano Beach, FL | 3.0 | 1.0–2.0 | 1017 | $4,345 | $4.27 | 1d | 19 | 0.90mi |
| 200 NE 1st Ave Pompano Beach, FL | 2.0 | 1.0–2.5 | 1149 | $3,600 | $3.13 | 2d | 47 | 0.90mi |
| 425 NE 1st St Pompano Beach, FL | 4.0 | 3.5 | 1864 | $3,900 | $2.09 | 3d | 1 | 0.95mi |
| 425 NE 1st St Pompano Beach, FL | 4.0 | 3.5 | 1864 | $3,900 | $2.09 | 20d | 1 | 0.95mi |
| 425 NE 1st St Pompano Beach, FL | 4.0 | 3.5 | 1864 | $3,700 | $1.98 | 1d | 1 | 0.95mi |
| 511 SE 14th St Unit 1 Pompano Beach, FL | 4.0 | 2.5 | 1880 | $7,000 | $3.72 | 24d | 1 | 0.97mi |
| 701 Pine Dr #204 Pompano Beach, FL | 3.0 | 2.0 | 1200 | $2,150 | $1.79 | 14d | 1 | 0.98mi |
| 1740 NE 64th St Fort Lauderdale, FL | 3.0 | 2.0 | 1364 | $4,800 | $3.52 | 10d | 1 | 0.99mi |
| 1740 NE 64th St Fort Lauderdale, FL | 3.0 | 2.0 | 1364 | $4,800 | $3.52 | 3d | 1 | 0.99mi |
| 111 SE 7th Ave Pompano Beach, FL | 4.0 | 3.5 | 2161 | $3,900 | $1.80 | 24d | 1 | 0.99mi |
| 751 Pine Dr #101 Pompano Beach, FL | 3.0 | 2.0 | 1200 | $2,600 | $2.17 | 24d | 1 | 1.02mi |
| 751 Pine Dr #104 Pompano Beach, FL | 3.0 | 2.0 | 1200 | $2,400 | $2.00 | 5d | 1 | 1.02mi |
| 939 NW 3rd St Unit 939 Pompano Beach, FL | 3.0 | 2.5 | 1597 | $3,300 | $2.07 | 24d | 1 | 1.04mi |
| 1601 NE 63rd St Fort Lauderdale, FL | 3.0 | 2.0 | 1875 | $6,125 | $3.27 | 24d | 1 | 1.06mi |
HOA detail
- Monthly dues
- $300 · $3,600/yr
Listing history 6 events
-
2026-06-01status $325,000 Pending 7 DOM
-
2026-05-31days on market $325,000 Active 7 DOM
-
2026-05-24$325,000 Active
-
2014-09-11soldstatus $1,880,000
-
2005-05-26soldstatus $5,000,000
-
2005-05-26soldstatus $5,000,000
ⓘ Source: listings_history table (triggers on properties + properties_extension) + one-shot
backfill from property_details.listing_events for pre-trigger history.
Tax reassessment forecast FL · Resets to sale price
- Current annual tax
- $6,739 · $562/mo
- Projected year-2 tax
- $6,739 · $562/mo
- Expected delta
- $0/yr ($0/mo · 0.0%)
ⓘ Screening estimate from a state-policy table — verify with the county assessor before closing.
Climate risk First Street
- Flood 4/10 Moderate FEMA zone AH · 13% chance over 30 yrs
- Wildfire 1/10 Low
- Heat 10/10 Extreme 7 d/yr ≥106°F today · 26 d/yr by 30 yrs out
- Wind 10/10 Extreme 99% chance of damaging wind over 30 yrs
- Air quality 2/10 Low 1 unhealthy d/yr today · 2 by 30 yrs out
Nearby sold comps map
Loading sold comps map…
Walkable amenities ~0.75 mi
Loading nearby amenities…
Taxation est. · year 1
- Rental income
- $48,210
- − Mortgage interest
- −$18,205
- − Property taxes
- −$6,739
- − Insurance
- −$3,450
- − Repairs & maintenance
- −$3,857
- − Management
- −$3,857
- − HOA
- −$3,600
- − Depreciation
- −$9,455
- Taxable loss
- −$952
- Est. tax savings @ 24.0%
- +$228
- After-tax cash flow
- $4,074/yr
For passive investors: Depreciation is non-cash, so a rental often shows a tax loss while cash-flowing — sheltering income. Rental losses are passive: they offset passive income freely, and up to $25,000/yr can offset ordinary (W-2) income if you actively participate and your MAGI is under $100k (phasing out to $0 by $150k); unused losses carry forward. On sale, claimed depreciation is recaptured at up to 25%, and gains may owe capital-gains tax (a 1031 exchange can defer both). Figures are a year-1 estimate at your 24.0% rate — not tax advice; consult a CPA.
Schools (NCES district)
- District
- Broward
- NCES district ID
- 1200180
- Math proficiency
- 42% ▼ -18.00%
- Reading proficiency
- 53% ▼ -5.00%
- Median HH income
- $52,139
- Composite
- 40.88/100
- National rank
- #3621
- State rank
- #46 of 73 in FL
Livability — Pompano Beach
- Score
- 74/100
- State rank
- #284
- US rank
- #4541
Category grades
Schools grade is shown separately in the Schools card above.
Census & demographics
- Census place
- Pompano Beach, FL
- County
- Broward County · 1,963,430 people
- City population
- 155,861
- Metro
- Miami-Fort Lauderdale-Pompano Beach, FL
- Population (ZIP)
- 37,233
- Household income
- $64,819
- Rent vs Own
- Severe rent burden
- 2870.0
Population outlook (Broward County) Hauer SSP2
- Today (2025)
- 2,207,033 people
- By 2030
- 2,360,704 · +7.0%
- By 2040
- 2,661,208 · +20.6%
- By 2050
- 2,946,698 · +33.5%
- By 2075
- 3,602,273 · +63.2%
- By 2100
- 3,970,984 · +79.9%
Race, ethnicity, and origin ACS 2023
- Neighborhood character
- Diverse neighborhood (Simpson 0.69)
- Race & ethnicity
- Black 38% White 33% Hispanic / Latino 26% Two or more races 14%
- Hispanic origin (detail)
- Mexican 9% Puerto Rican 2% Cuban 3% Dominican 1%
- Common ancestry
- Hispanic 13% Romanian 2% Slovak 1%
- Foreign-born
- 31% · Canada, Jamaica
- Languages at home
- 60% English-only · Spanish 23% French/Haitian/Cajun 13% Other Indo-European 2%
Political lean MEDSL · Broward
- 2024 margin
- D (+17.0) · D 58.0% · R 41.0%
- 2008→2024 swing
- -17.8pp toward R · 2008: 34.7pp · 2024: 17.0pp
- All cycles
- 2024: D+17.0 2020: D+29.8 2016: D+35.0 2012: D+34.9 2008: D+34.7
Not yet ingested
- Civics
- —
Market trends
- HPI YoY
- ▼ -131.09%
- Current HPI
- 425.3083
- Rent YoY
- ▲ 2.12%
- Metro
- Miami-Fort Lauderdale-Pompano Beach, FL
- State GDP YoY
- ▲ 3.28%
- F500 in state
- 36
Industry mix (Fortune 500 HQ in FL)
| Industry | F500 HQs | Revenue |
|---|---|---|
| Industrial Technology | 2 | $29B |
|
||
| Insurance | 2 | $17B |
|
||
| Retail | 1 | $60B |
|
||
| Technology Distribution | 1 | $58B |
|
||
| Homebuilding | 1 | $35B |
|
||
| Technology Manufacturing | 1 | $35B |
|
||
Price history
-93.5% since first listed4 events — show timeline
- 2026-05-24 Listed $325,000 MARMLS
- 2014-09-11 Sold (Public Records) $1,880,000 Public Records
- 2005-05-26 Sold (Public Records) $5,000,000 Public Records
- 2005-05-26 Sold (Public Records) $5,000,000 Public Records
Property tax history
+10.2%/yrLatest (2025): $6,739 · +2.6% YoY. Source: county tax records.
Cash-flow waterfall
monthlySold comps — $/sqft
last 12 mo · ≤1 miLoading sold comps…