1561 Tuscarora Rd · Niagara Falls, NY
Flood risk 1/10 · Minimal
- FEMA flood zone
- X (shaded)
- Chance of flooding over 30 yrs
- 0.0%
- Est. flood insurance / yr
- $473 – $860
Fire risk 1/10 · Minimal
- Est. fire insurance / yr
- $691 – $1,283
Heat risk 2/10 · Minimal
- Hot days now (above 94°F)
- 7 days/yr
- Hot days in 30 yrs
- 14 days/yr
Wind risk 1/10 · Minimal
- Chance of severe wind over 30 yrs
- —
Air-quality risk 3/10 · Minor
- Unhealthy air days now
- 2 days/yr
- Unhealthy air days in 30 yrs
- 3 days/yr
Risk factors via First Street. Map © Google.
Why this score? — see what drove the B grade
The composite is a weighted blend of 9 inputs, each scored 0–100. Each bar is that input's sub-score; the figure is the points it added to the 100-point composite (weight × sub-score).
- Cash flow +30.0/30.0
- 1% rule +10.0/10.0
- DSCR +10.0/10.0
- ARV discount +7.5/15.0
- Schools +5.8/10.0
- Livability +3.0/5.0
- Rent growth +2.5/5.0
- Condition / age +2.5/5.0
- Appreciation +0.0/10.0
$39,900
🖨 Deal sheet (PDF) 📄 Offer letter ✓ Due diligence
Listing remarks
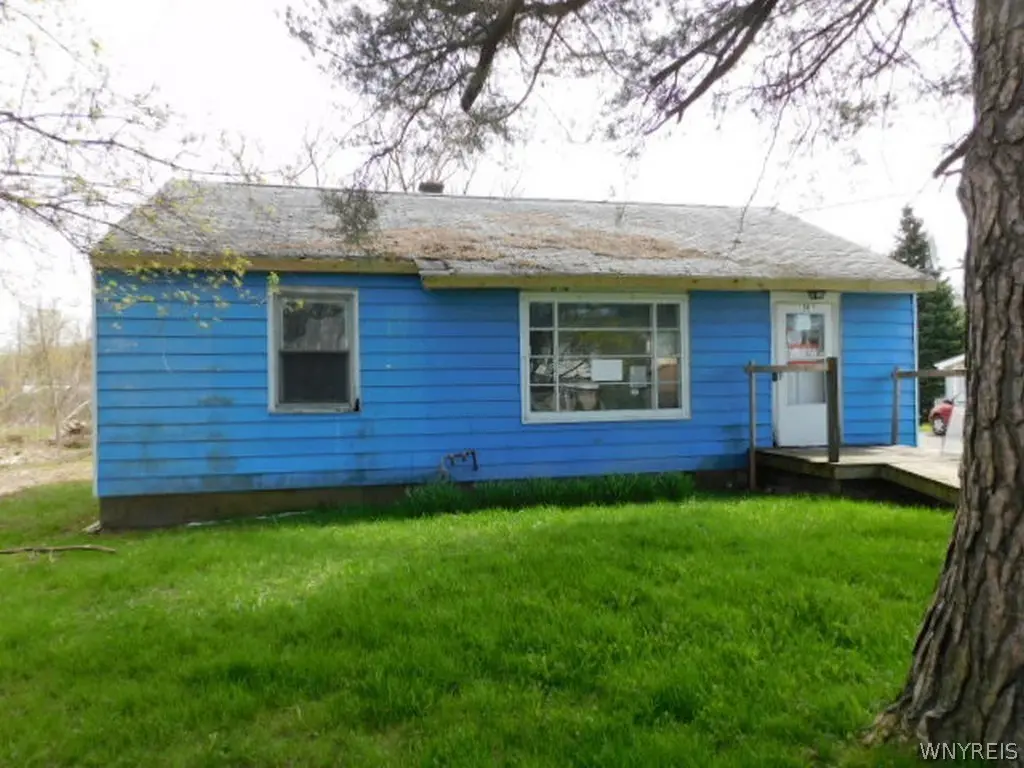
If you're looking for your next project, this could be it. Quaint ranch featuring two bedrooms and a full bath, It needs your vision and your toolbelt to make it a home once again. Perfect for owner occupancy or investment purposes. Close to Military Rd with retail and restaurants, its in a great location. Easy to show!
Key facts
- 4.5 acre lot
- Built 1955
- Listed 15 days
Property features AI
Exterior
- Parking: No garage
- Utilities: Public water connected; Sewer connected
- Home design: Single-story home; Resale property; Vinyl siding
- Construction: Vinyl siding construction; Block foundation; Existing (year built details listed as existing)
- Exterior features: Deck; Gravel driveway; Irregular residential lot; Road frontage on a city street; Lot dimensions approximately 242 x 460
Interior
- Kitchen: Eat-in kitchen
- Bedrooms: 2 main-level bedrooms
- Flooring: Laminate; Tile; Vinyl; Varies
- Bathrooms: 1 full bathroom (main level)
- Heating & cooling: Gas heating; Baseboard heating
- Interior features: Eat-in kitchen; Separate/formal living room; Bedroom on main level; Full basement
- Laundry & utility: Main-level laundry; Gas water heater
Neighborhood map
What this means for you Summary
Snapshot
- This is a 3-bed/2.5-bath single-family listed at $40k.
Deal economics
- At list price, monthly cash flow is $778 ($9k/yr) — positive.
- The deal already cash-flows at list — no discount required.
- Meets the 1% rule at list price ($1k rent vs $40k).
- Recommended offer: $39k (1.5% below list) — sets the bar for market timing.
- Cap rate 29.7% vs local median 7.7% in Niagara Falls — top-decile yield for the area; either an underpriced asset or a hidden risk that comps aren't pricing in. Stress-test before assuming the spread holds.
Location & tenants
- Location reads 60/100 on livability (#956 in NY) — a middle-class / working-renter tenant base. Strengths: cost of living A+, housing A+; Watch: schools F, crime F, amenities F.
- Niagara-Wheatfield Central School District (rural): math 64% / reading 70% proficiency, ranked #163 of 590 in NY (top 28%) — acceptable for families but not a draw, mixed tenant base, ~2y average lease.
- Market conditions: 142 active listings in the ZIP; 5 comparable units currently listed for rent nearby; rentals leasing fast (median 2d on market — plan ~1-2 weeks tenant-placement turnaround); 167 units permitted in Niagara County in 2024 (0 in 5+ unit buildings).
Forward outlook
- Local home prices are declining (-3.0%/yr); year-one equity from $276 of loan paydown is wiped out by about $1k of value loss. Plan a longer hold.
- Niagara County population projected at -19% by 2050 — secular population decline; favor cash flow + early exit over multi-decade hold.
- At projected returns (-3.0% appreciation + 3.0% rent growth), your $11k cash investment doubles in ~2 years — after that, you're playing with house money.
Negotiation context
- It's been on market 15 days — a 2% lower offer ($39k) is reasonable based on typical stale-listing flexibility.
- 2 sale attempts; this cycle's ask has dropped $2k (5%) from the opening price — seller is motivated, your offer sets the floor, not the list.
Risks & watch-outs
- Watch-outs: built in 1955 — expect roof / HVAC / electrical / plumbing capex.
Questions for the listing agent
- Built in 1955 — when were the roof, HVAC, electrical panel, plumbing, and water heater last replaced?
- Is there a deadline driving the sale (1031 exchange, divorce, estate, relocation)? That informs how much negotiation room exists.
- Schools are F-rated, which usually means shorter tenancies and higher turnover. Who's the typical renter profile here, and what's been the actual vacancy rate?
- Crime grade is F in this area — have there been break-ins, vandalism, or insurance claims at this property in the last 3 years? What carrier currently insures it and at what premium?
- What's the average days-on-market for RENTAL listings here right now (not sales)? A rising rental-DOM trend means longer vacancies and softer asking-rent achievability than the comps imply.
- What's the recent tenant-quality profile in this submarket — average credit score on applications, eviction rate, late-payment / NSF rate, and stable-employment percentage? A property-management company in the area should have these aggregated.
- How much new for-sale + rental construction is in the pipeline within 1–3 miles? Heavy new supply typically softens prices + rents 12–24 months out; constrained supply supports both.
Investment metrics
- 1% rule
- 3.34% ✓
- Cap rate
- 29.69%
- Cash-on-cash
- 83.57%
- DSCR
- 4.72
- GRM
- 2.5
CMA / ARV
- ARV (on-the-fly)
- $165,024
- Comps found
- 12
Show comp detail 12 sales within ~0.75 mi
| Address | Dist | Beds/Ba | Sqft | Sold | Price | $/sf | Match |
|---|---|---|---|---|---|---|---|
| 1020 Sunnyside | 0.16mi | 2/1.0 (-1) | 840 (-3%) | 1mo | $29,900 | $36 | 76 |
| 1284 92nd St | 0.48mi | 3/2.0 | 960 (+11%) | 7mo | $225,000 | $234 | 51 |
| 1216 90th St | 0.49mi | 3/1.0 | 924 (+7%) | 11mo | $225,000 | $244 | 50 |
| 1266 91st St | 0.43mi | 3/1.0 | 960 (+11%) | 9mo | $192,048 | $200 | 48 |
| 674 79th St | 0.67mi | 3/1.0 | 937 (+8%) | 4mo | $165,000 | $176 | 46 |
| 9321 Saint Johns Pkwy | 0.52mi | 3/1.0 | 960 (+11%) | 8mo | $210,000 | $219 | 45 |
| 1032 91st St | 0.69mi | 2/1.0 (-1) | 823 (-5%) | 7mo | $165,000 | $200 | 43 |
| 1025 90th St | 0.69mi | 2/1.0 (-1) | 832 (-4%) | 15mo | $100,000 | $120 | 39 |
| 1118 91st St | 0.61mi | 3/1.5 | 955 (+10%) | 14mo | $147,000 | $154 | 38 |
| 1008 N Military Rd | 0.66mi | 2/1.0 (-1) | 924 (+7%) | 10mo | $165,000 | $179 | 38 |
| 1122 93rd St | 0.68mi | 2/1.5 (-1) | 942 (+9%) | 10mo | $180,000 | $191 | 36 |
| 677 78th St | 0.68mi | 3/1.0 | 986 (+14%) | 11mo | $183,600 | $186 | 29 |
Match score weights: distance 35% · size 25% · config 20% · recency 20%. Top-matched comps best support the ARV.
Projected returns pro-forma
-3.0% appreciation · 3.0% rent growth · sell at horizon
- IRR
- 83.9%
- Equity multiple
- 4.86×
- Total profit
- $43,110
- Equity at exit
- $5,949
- IRR
- 87.2%
- Equity multiple
- 10.08×
- Total profit
- $101,432
- Equity at exit
- $3,450
Cash invested: $11,172 (down + closing). Projections, not guarantees.
Landlord ↔ Tenant lean methodology
- Overall (STATE)
- 15 Strongly Tenant-Friendly
- State New York
- 15 Strongly Tenant-Friendly · D+10
- County
- — inherits STATE
- City
- — inherits STATE
ZIP-level market 14304
- Active inventory
- 142
- Price-to-rent
- 2.5×
Monthly cashflow live
- Estimated rent
- $1,334 high interval (Pro) →
- Mortgage (P&I)
- −$209
- Tax est. 1.5%
- −$50 /mo · $598/yr
- Insurance
- −$17
- HOA
- −$0
- Vacancy / Maint / Mgmt
- −$280
- Net cashflow
- $778
Break-even live
Sensitivity live
| Price | -10% $806 | -5% $792 | +0% $778 | +5% $764 | +10% $750 |
|---|---|---|---|---|---|
| Rent | -10% $673 | -5% $725 | +0% $778 | +5% $831 | +10% $883 |
| Rate | -1.0pp $798 | -0.5pp $788 | base $778 | +0.5pp $768 | +1.0pp $757 |
UW: 25.0% down · 7.5% · 30yr · 1.5% tax · 5.0% vac · 8.0% maint · 8.0% mgmt
Financing live
Cash to close
- Down payment
- $9,975
- Closing costs
- $1,197
- Reserves months
- —
- Total cash needed
- —
Loan-product check · same deal, 3 products live
Conventional
25% down · 7.5% · 30yr
- Down + closing
- —
- Monthly P&I
- —
- Monthly cashflow
- —
- DSCR
- —
- Eligible?
- —
Personal DTI + credit; lowest rate.
DSCR
20% down · 8.5% · 30yr
- Down + closing
- —
- Monthly P&I
- —
- Monthly cashflow
- —
- DSCR
- —
- Eligible?
- —
No personal income docs; deal must DSCR.
Hard money
10% down · 12.0% · 12mo
- Down + closing
- —
- Monthly P&I
- —
- Monthly cashflow
- —
- DSCR
- —
- Eligible?
- —
Short-term bridge; refi at stabilization.
Rent comps 5 comps
| Address | Beds | Baths | Sqft | Rent | $/sqft | DOM | Units | Dist |
|---|---|---|---|---|---|---|---|---|
| 8833 Pear Ave Niagara Falls, NY | 2.0 | 1.0 | 1096 | $1,700 | $1.55 | 2d | 1 | 0.62mi |
| 1735 Caravelle Dr Niagara Falls, NY | 2.0 | 1.0 | 740 | $891 | $1.20 | 2d | 1 | 1.05mi |
| 730 66th St Niagara Falls, NY | 2.0 | 1.0 | 748 | $963 | $1.29 | 2d | 1 | 1.29mi |
| 51 S 86th St Unit 11B Niagara Falls, NY | 2.0 | 1.0 | 720 | $1,100 | $1.53 | 3d | 1 | 1.34mi |
| 8405 Buffalo Ave Niagara Falls, NY | 2.0 | 1.0 | 706 | $850 | $1.20 | 12d | 1 | 1.35mi |
Listing history 5 events
-
2026-04-30status Pending
-
2026-04-22price $39,900
-
2026-04-22status Active
-
2026-03-25status Pending
-
2026-03-17$42,000 Active
ⓘ Source: listings_history table (triggers on properties + properties_extension) + one-shot
backfill from property_details.listing_events for pre-trigger history.
Climate risk First Street
- Flood 1/10 Low FEMA zone X (shaded) · 0% chance over 30 yrs
- Wildfire 1/10 Low
- Heat 2/10 Low 7 d/yr ≥94°F today · 14 d/yr by 30 yrs out
- Wind 1/10 Low
- Air quality 3/10 Moderate 2 unhealthy d/yr today · 3 by 30 yrs out
Nearby sold comps map
Loading sold comps map…
Walkable amenities ~0.75 mi
Loading nearby amenities…
Taxation est. · year 1
- Rental income
- $16,007
- − Mortgage interest
- −$2,235
- − Property taxes
- −$598
- − Insurance
- −$200
- − Repairs & maintenance
- −$1,281
- − Management
- −$1,281
- − Depreciation
- −$1,161
- Taxable income
- $9,252
- Est. tax owed @ 24.0%
- −$2,221
- After-tax cash flow
- $7,116/yr
For passive investors: Depreciation is non-cash, so a rental often shows a tax loss while cash-flowing — sheltering income. Rental losses are passive: they offset passive income freely, and up to $25,000/yr can offset ordinary (W-2) income if you actively participate and your MAGI is under $100k (phasing out to $0 by $150k); unused losses carry forward. On sale, claimed depreciation is recaptured at up to 25%, and gains may owe capital-gains tax (a 1031 exchange can defer both). Figures are a year-1 estimate at your 24.0% rate — not tax advice; consult a CPA.
Schools (NCES district)
- District
- Niagara-Wheatfield Central School District
- NCES district ID
- 3620850
- Math proficiency
- 64% ▼ -1.00%
- Reading proficiency
- 70% ▲ 10.00%
- Median HH income
- $57,051
- Composite
- 57.53/100
- National rank
- #1067
- State rank
- #163 of 590 in NY
Livability — Niagara Falls
- Score
- 60/100
- State rank
- #956
- US rank
- #18749
Category grades
Schools grade is shown separately in the Schools card above.
Census & demographics
- County
- Niagara County · 157,377 people
- City population
- 62,983
- Metro
- Buffalo-Cheektowaga, NY
- Population (ZIP)
- 29,208
- Household income
- $66,660
- Rent vs Own
- Severe rent burden
- 698.0
Population outlook (Niagara County) Hauer SSP2
- Today (2025)
- 204,149 people
- By 2030
- 197,900 · -3.1%
- By 2040
- 182,239 · -10.7%
- By 2050
- 165,198 · -19.1%
- By 2075
- 129,416 · -36.6%
- By 2100
- 96,222 · -52.9%
Race, ethnicity, and origin ACS 2023
- Neighborhood character
- Predominantly White (85%)
- Race & ethnicity
- White 85% Two or more races 6% Hispanic / Latino 4% Black 3% Asian 2%
- Common ancestry
- Romanian 10% Lithuanian 3% Slovak 2%
- Foreign-born
- 3% · Canada, China, Vietnam
- Languages at home
- 93% English-only · Spanish 3% Other Indo-European 1% Russian/Polish/Slavic 1%
Political lean MEDSL · Niagara
- 2024 margin
- R (+14.9) · D 42.5% · R 57.5%
- 2008→2024 swing
- -15.9pp toward R · 2008: 1.0pp · 2024: -14.9pp
- All cycles
- 2024: R+14.9 2020: R+9.7 2016: R+19.0 2012: D+0.6 2008: D+1.0
Not yet ingested
- Civics
- —
Market trends
- HPI YoY
- ▼ -231.77%
- Current HPI
- 280.3295
- Rent YoY
- —
- Metro
- Buffalo-Cheektowaga, NY
- State GDP YoY
- ▲ 2.60%
- F500 in state
- 92
Industry mix (Fortune 500 HQ in NY)
| Industry | F500 HQs | Revenue |
|---|---|---|
| Financial Services | 10 | $950B |
|
||
| Consumer Goods | 9 | $162B |
|
||
| Insurance | 4 | $225B |
|
||
| Telecommunications | 2 | $144B |
|
||
| Pharmaceuticals | 2 | $112B |
|
||
| Media / Entertainment | 2 | $69B |
|
||
Price history
-5.0% since first listed5 events — show timeline
- 2026-04-30 Pending — WNYREIS
- 2026-04-22 Price Changed $39,900 WNYREIS
- 2026-04-22 Relisted — WNYREIS
- 2026-03-25 Pending — WNYREIS
- 2026-03-17 Listed $42,000 WNYREIS
Property tax history
+18.1%/yrLatest (2025): $4,418 · -6.2% YoY. Source: county tax records.
Cash-flow waterfall
monthlySold comps — $/sqft
last 12 mo · ≤1 miLoading sold comps…