 Duplex
33 Terrace Vw · Norfolk, CT
Flood risk No data
- FEMA flood zone
- —
- Chance of flooding over 30 yrs
- —
- Est. flood insurance / yr
- —
Fire risk No data
- Est. fire insurance / yr
- —
Heat risk No data
- Hot days now (above threshold)
- —
- Hot days in 30 yrs
- —
Wind risk No data
- Chance of severe wind over 30 yrs
- —
Air-quality risk No data
- Unhealthy air days now
- —
- Unhealthy air days in 30 yrs
- —
Risk factors via First Street. Map © Google.
Why this score? — see what drove the C+ grade
The composite is a weighted blend of 9 inputs, each scored 0–100. Each bar is that input's sub-score; the figure is the points it added to the 100-point composite (weight × sub-score).
- Cash flow +19.9/30.0
- Appreciation +10.0/10.0
- ARV discount +7.5/15.0
- DSCR +6.3/10.0
- 1% rule +4.9/10.0
- Schools +4.4/10.0
- Livability +3.6/5.0
- Rent growth +2.5/5.0
- Condition / age +2.5/5.0
$399,000
🖨 Deal sheet 📄 Offer letter ✓ Due diligence
Multi-family units
County records classify this as Multi-Family (2-4 Unit). Listing-text estimate: 2 units. confirmed
Listing remarks
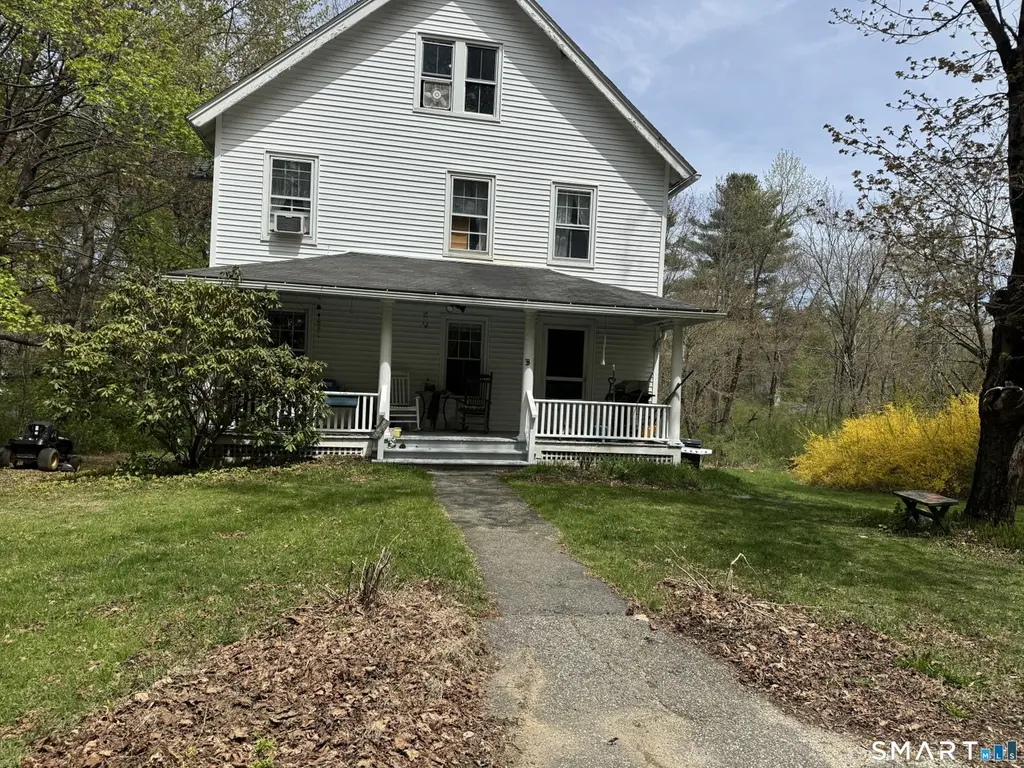
Located just minutes from the heart of Norfolk, this two-family home offers space, character and excellent income potential. The first-floor apartment features 2 bedrooms and 1 full bath, enhanced by a welcoming front porch-perfect for relaxing and enjoying the surroundings. The second-floor unit offers a generous layout with 4 bedrooms and 1 full bath, highlighted by a beautiful claw-foot tub and a large, bright living room providing both charm and comfort. Outside, the property sits on a large yard with ample parking on both sides of the home, allowing separate parking for each tenant. The property is in a desirable location close tot he center of town.
Key facts
- Ample parking
- Front porch
- Desirable location
Tags
Property features AI
Exterior
- Utilities: Public water connected; Public sewer connected; Power utilities available
- Home design: Multi-family property (2-family); Multi-Family For Sale
- Construction: Frame construction; Concrete foundation
- Exterior features: Secluded lot; Vinyl siding; Asphalt shingle roof
Interior
- Bedrooms: 6 bedrooms
- Bathrooms: 2 full bathrooms
- Heating & cooling: Hot air heating; Oil-fired heating; 40-gallon hot water tank (oil) located in basement
- Interior features: Total of 10 rooms; Full basement; Walk-up attic
Neighborhood map
What this means for you Summary
Snapshot
- This is a 2 × 3-bed/1.0-bath units multifamily listed at $399k.
Deal economics
- At list price, monthly cash flow is $482 ($6k/yr) — positive. Per door: $241/mo.
- The deal already cash-flows at list — no discount required.
- To meet the 1% rule (rent ≥ 1% of price), the offer needs to be $395k (1.0% below list).
- Recommended offer: $387k (3.0% below list) — sets the bar for market timing.
Location & tenants
- Location reads 72/100 on livability (#79 in CT) — a middle-class / working-renter tenant base. Strengths: health & safety A+, housing A, crime A-; Watch: amenities F, commute F.
- Regional School District 07 (town): math 38% / reading 63% proficiency, ranked #81 of 153 in CT (top 53%) — acceptable for families but not a draw, mixed tenant base, ~2y average lease; only 8% free/reduced lunch — higher-income household profile.
- Market conditions: 21 active listings in the ZIP; 154 units permitted in Northwest Hills Planning Region in 2024 (6 in 5+ unit buildings).
Forward outlook
- In year one you build about $43k of equity ($3k loan paydown + $40k appreciation (10.0% local appreciation)).
- At projected returns (10.0% appreciation + 3.0% rent growth), your $112k cash investment doubles in ~3 years — after that, you're playing with house money.
- By year 2, paydown + projected appreciation supports a ~$69k cash-out refi (75% LTV) — recoverable capital for the next deal without selling this one.
Negotiation context
- It's been on market 48 days — a 3% lower offer ($387k) is reasonable based on typical stale-listing flexibility.
- 2 sale attempts since 3y ago; this cycle's ask has dropped $26k (6%) from the opening price — seller is motivated, your offer sets the floor, not the list.
Risks & watch-outs
- Watch-outs: built in 1900 — expect roof / HVAC / electrical / plumbing capex.
Questions for the listing agent
- It's been on market 48 days. Have you received any prior offers? Is the seller open to a 3% concession, seller financing, or rate buy-down credit?
- Can we see the unit-by-unit rent roll, current vacancy, and any below-market leases? What's the average tenancy length?
- What capital expenditures (roof, boiler, parking lot, exteriors) have been made in the last 5 years, and what's planned in the next 2?
- Built in 1900 — when were the roof, HVAC, electrical panel, plumbing, and water heater last replaced?
- Is there a deadline driving the sale (1031 exchange, divorce, estate, relocation)? That informs how much negotiation room exists.
- Schools are B-rated — typically a magnet for longer-tenancy family renters. What's the average tenant stay here, and is there a school-zone premium baked into asking?
- What's the average days-on-market for RENTAL listings here right now (not sales)? A rising rental-DOM trend means longer vacancies and softer asking-rent achievability than the comps imply.
- What's the recent tenant-quality profile in this submarket — average credit score on applications, eviction rate, late-payment / NSF rate, and stable-employment percentage? A property-management company in the area should have these aggregated.
- How much new apartment / multifamily construction is in the pipeline within 1–3 miles? Heavy new supply (>2% of stock underway) typically softens rents 12–24 months out; light construction supports rent growth.
Investment metrics
- 1% rule
- 0.99% ✗
- Cap rate
- 7.74%
- Cash-on-cash
- 5.18%
- DSCR
- 1.23
- GRM
- 8.4
CMA / ARV
No comps found within radius.
Projected returns pro-forma
10.0% appreciation · 3.0% rent growth · sell at horizon
- IRR
- 28.0%
- Equity multiple
- 3.22×
- Total profit
- $248,009
- Equity at exit
- $359,451
- IRR
- 24.4%
- Equity multiple
- 7.32×
- Total profit
- $706,166
- Equity at exit
- $775,169
Cash invested: $111,720 (down + closing). Projections, not guarantees.
Landlord ↔ Tenant lean methodology
- Overall (STATE)
- 27 Tenant-Leaning
- State Connecticut
- 27 Tenant-Leaning · D+7
- County
- — inherits STATE
- City
- — inherits STATE
ZIP-level market 06058
- Home prices YoY
- 3.8%
- Active inventory
- 21
- Price-to-rent
- 16.8×
Monthly cashflow live
- Estimated rent
- $3,952 medium interval (Pro) →
- Mortgage (P&I)
- −$2,092
- Tax from tax record
- −$381 /mo · $4,574/yr
- Insurance
- −$166
- HOA
- −$0
- Vacancy / Maint / Mgmt
- −$830
- Net cashflow
- $482
Break-even live
2-unit breakdown (identical units grouped — click to expand)
| Units | Beds | Baths | Est. rent |
|---|---|---|---|
| 2× units | 3 | 1 | $3,952 |
| #1 | 3 | 1 | $1,976 |
| #2 | 3 | 1 | $1,976 |
| Total (2 units) | $3,952 | ||
UW: 25.0% down · 7.5% · 30yr · 1.5% tax · 5.0% vac · 8.0% maint · 8.0% mgmt
Financing live
Cash to close
- Down payment
- $99,750
- Closing costs
- $11,970
- Reserves months
- —
- Total cash needed
- —
Loan-product check · same deal, 3 products live
Conventional
25% down · 7.5% · 30yr
- Down + closing
- —
- Monthly P&I
- —
- Monthly cashflow
- —
- DSCR
- —
- Eligible?
- —
Personal DTI + credit; lowest rate.
DSCR
20% down · 8.5% · 30yr
- Down + closing
- —
- Monthly P&I
- —
- Monthly cashflow
- —
- DSCR
- —
- Eligible?
- —
No personal income docs; deal must DSCR.
Hard money
10% down · 12.0% · 12mo
- Down + closing
- —
- Monthly P&I
- —
- Monthly cashflow
- —
- DSCR
- —
- Eligible?
- —
Short-term bridge; refi at stabilization.
Listing history 21 events
-
2026-06-19days on market $399,000 Active 48 DOM
-
2026-06-18price $399,000 Active 47 DOM
-
2026-06-18days on market $425,000 Active 47 DOM
-
2026-06-17days on market $425,000 Active 46 DOM
-
2026-06-16days on market $425,000 Active 45 DOM
-
2026-06-15days on market $425,000 Active 44 DOM
-
2026-06-14days on market $425,000 Active 42 DOM
-
2026-06-13days on market $425,000 Active 41 DOM
-
2026-06-10days on market $425,000 Active 39 DOM
-
2026-06-09days on market $425,000 Active 38 DOM
-
2026-06-08days on market $425,000 Active 37 DOM
-
2026-06-07days on market $425,000 Active 36 DOM
-
2026-06-05days on market $425,000 Active 33 DOM
-
2026-06-03days on market $425,000 Active 32 DOM
-
2026-06-02days on market $425,000 Active 31 DOM
-
2026-06-01days on market $425,000 Active 30 DOM
-
2026-05-31days on market $425,000 Active 29 DOM
-
2026-05-30days on market $425,000 Active 28 DOM
-
2026-04-30$425,000 Active
-
2023-11-06historical
-
2023-07-30$309,000 Active
ⓘ Source: listings_history table (triggers on properties + properties_extension) + one-shot
backfill from property_details.listing_events for pre-trigger history.
Tax reassessment forecast CT · Partial reset (capped growth)
- Current annual tax
- $4,574 · $381/mo
- Projected year-2 tax
- $6,556 · $546/mo
- Expected delta
- +$1,982/yr (+$165/mo · 43.3%)
ⓘ Screening estimate from a state-policy table — verify with the county assessor before closing.
Nearby sold comps map
Loading sold comps map…
Walkable amenities ~0.75 mi
Loading nearby amenities…
Taxation est. · year 1
- Rental income
- $47,424
- − Mortgage interest
- −$22,350
- − Property taxes
- −$4,574
- − Insurance
- −$1,995
- − Repairs & maintenance
- −$3,794
- − Management
- −$3,794
- − Depreciation
- −$11,607
- Taxable loss
- −$690
- Est. tax savings @ 24.0%
- +$166
- After-tax cash flow
- $5,953/yr
For passive investors: Depreciation is non-cash, so a rental often shows a tax loss while cash-flowing — sheltering income. Rental losses are passive: they offset passive income freely, and up to $25,000/yr can offset ordinary (W-2) income if you actively participate and your MAGI is under $100k (phasing out to $0 by $150k); unused losses carry forward. On sale, claimed depreciation is recaptured at up to 25%, and gains may owe capital-gains tax (a 1031 exchange can defer both). Figures are a year-1 estimate at your 24.0% rate — not tax advice; consult a CPA.
Schools (NCES district)
- District
- Regional School District 07
- NCES district ID
- 0903720
- Math proficiency
- 38% ▼ -18.00%
- Reading proficiency
- 63% ▼ -12.00%
- Median HH income
- $58,205
- Composite
- 43.88/100
- National rank
- #2918
- State rank
- #81 of 153 in CT
Livability — Norfolk
- Score
- 72/100
- State rank
- #79
- US rank
- #5707
Category grades
Schools grade is shown separately in the Schools card above.
Census & demographics
- Census place
- Norfolk, CT
- Population (ZIP)
- 1,819
Population outlook (Northwest Hills County) Hauer SSP2
- By 2040
- 118,998
Race, ethnicity, and origin ACS 2023
- Neighborhood character
- Predominantly White (82%)
- Race & ethnicity
- White 82% Two or more races 12% Hispanic / Latino 11% Asian 1%
- Hispanic origin (detail)
- Puerto Rican 4%
- Common ancestry
- Lithuanian 9% Romanian 7% Slovak 3%
- Foreign-born
- 5% · Canada, Jamaica
- Languages at home
- 93% English-only · Spanish 4% Other Indo-European 1% French/Haitian/Cajun 1%
Political lean MEDSL · Northwest Hills
- 2024 margin
- Toss-up / Even · D 48.6% · R 49.9% · Other 1.6%
- All cycles
- 2024: R+1.3
Not yet ingested
- Civics
- —
Market trends
- HPI YoY
- ▲ 10.32%
- Current HPI
- 283.0526
- Rent YoY
- —
- Metro
- —
- State GDP YoY
- ▲ 1.06%
- F500 in state
- 38
Industry mix (Fortune 500 HQ in CT)
| Industry | F500 HQs | Revenue |
|---|---|---|
| Industrial Machinery | 4 | $38B |
|
||
| Insurance | 3 | $71B |
|
||
| Financial Services | 2 | $25B |
|
||
| Transportation / Logistics | 2 | $18B |
|
||
| Healthcare | 1 | $247B |
|
||
| Telecommunications | 1 | $55B |
|
||
Price history
+37.5% since first listed3 events — show timeline
- 2026-04-30 Listed $425,000 Smart MLS
- 2023-11-06 Listing Removed — Smart MLS
- 2023-07-30 Listed $309,000 Smart MLS
Property tax history
+2.8%/yrLatest (2023): $4,574 · -0.5% YoY. Source: county tax records.
Cash-flow waterfall
monthlySold comps — $/sqft
last 12 mo · ≤1 miLoading sold comps…