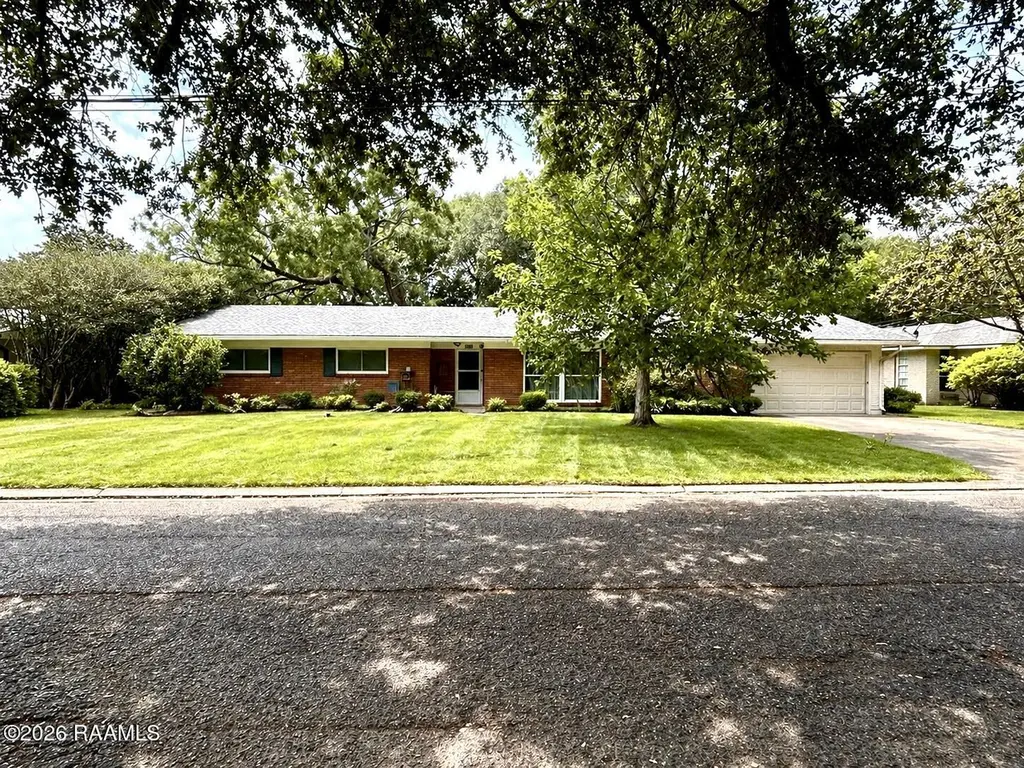
222 Louise Dr · Lafayette, LA
Flood risk 4/10 · Minor
- FEMA flood zone
- X (shaded)
- Chance of flooding over 30 yrs
- 0.22%
- Est. flood insurance / yr
- $507 – $1,088
Fire risk 1/10 · Minimal
- Est. fire insurance / yr
- $1,269 – $2,357
Heat risk 9/10 · Severe
- Hot days now (above 108°F)
- 7 days/yr
- Hot days in 30 yrs
- 21 days/yr
Wind risk 9/10 · Severe
- Chance of severe wind over 30 yrs
- 99.0%
Air-quality risk 2/10 · Minimal
- Unhealthy air days now
- 0 days/yr
- Unhealthy air days in 30 yrs
- 1 days/yr
Risk factors via First Street. Map © Google.
Why this score? — see what drove the D grade
The composite is a weighted blend of 9 inputs, each scored 0–100. Each bar is that input's sub-score; the figure is the points it added to the 100-point composite (weight × sub-score).
- ARV discount +15.0/15.0
- Cash flow +8.7/30.0
- Schools +3.6/10.0
- Rent growth +3.5/5.0
- Livability +3.5/5.0
- Condition / age +2.5/5.0
- DSCR +2.4/10.0
- 1% rule +2.0/10.0
- Appreciation +0.0/10.0
$269,000
🖨 Deal sheet (PDF) 📄 Offer letter ✓ Due diligence
Listing remarks MLS
BRIGHT AND OPEN SAINT STREET HOME LOCATED ON A QUIET STREET. BOASTING UPDATED CERAMIC TILE COUNTERTOPS AND TERRAZO FLOORS IN THE KITCHEN, STAINED CONCRETE IN THE FORMAL DINING, SPACIOUS KEEPING AREA, MODERN UPDATED PAINT COLORS, LARGE BACKYARD AND MORE! THE ROOF IS 2 YEARS OLD; ALL WINDOWS ARE 1 YR OLD; APPLIANCES, 3YRS OLD. MUST SEE TO APPRECIATE.
Key facts
- 0.36 acre lot
- 2 garage spots
- Built 1958
Property features AI
Exterior
- Parking: 2 parking spaces; 2 covered spaces (garage)
- Utilities: Gas service by Atmos; Public sewer; City electric
- Home design: Single-family residence; City street frontage; Residential zoning
- Construction: Brick veneer and frame construction; Composition roof
- Exterior features: Outdoor lighting; Covered patio/porch; Shed(s)
Interior
- Kitchen: Dishwasher; Electric cooktop; Electric stove connection; Gas stove connection; Microwave
- Flooring: Carpet; Stained/Scored concrete; Tile; Wood; Other flooring
- Bathrooms: 2 full bathrooms
- Heating & cooling: Central heating (natural gas); Central air conditioning
- Interior features: Built-in features; Separate shower; Tile counters; Interior lighting
Neighborhood map
What this means for you Summary
Snapshot
- This is a 4-bed/2.0-bath single-family listed at $269k.
Deal economics
- At list price, monthly cash flow is $-226 ($-3k/yr) — negative.
- To cash-flow at today's rent, offer at most $229k (14.8% below list).
- To meet the 1% rule (rent ≥ 1% of price), the offer needs to be $187k (30.4% below list).
- Recommended offer: $187k (30.4% below list) — sets the bar for 1% rule.
Location & tenants
- Location reads 70/100 on livability (#63 in LA) — a middle-class / working-renter tenant base. Strengths: cost of living A+, housing A+, health & safety A+; Watch: amenities C-, employment C-, crime F.
- Lafayette Parish (urban): math 38% / reading 46% proficiency, ranked #19 of 98 in LA (top 19%) — families likely to look elsewhere, expect single-tenant / working-renter base with shorter leases.
- Zoned schools: L.J. Alleman Middle School (math 48% / reading 56%, grade C+, #23 of 218 statewide, top 10%, 952 students, 54% FRL); Lafayette High School (math 57% / reading 51%, grade C-, #28 of 265 statewide, top 11%, 1,852 students, 52% FRL) — zoned schools at 53% FRL track the district average.
- Market conditions: Rents rising fast (+4.1%/yr); 413 active listings in the ZIP; 8 comparable units currently listed for rent nearby; rentals at typical pace (median 22d on market — plan ~3-4 weeks tenant-placement turnaround); 1,585 units permitted in Lafayette Parish in 2024 (10 in 5+ unit buildings).
- This rent runs 39% of the median local income ($57k/yr) — at the standard rent-burdened threshold; future hikes will face affordability resistance.
Forward outlook
- Local home prices are declining (-3.0%/yr); year-one equity from $2k of loan paydown is wiped out by about $8k of value loss. Plan a longer hold.
- Lafayette County population projected at +34% by 2050 — long-run rental-demand tailwind backs the buy-and-hold thesis.
Negotiation context
- It's been on market 32 days — a 3% lower offer ($261k) is reasonable based on typical stale-listing flexibility.
- 3 sale attempts since 25y ago with the ask held roughly flat each time — persistent listings suggest the price (not the market) is what's stuck; bring a comps-based counter.
- Current owner paid $175k; list at $269k implies a 54% gain — meaningful room to come down on a strong offer.
Risks & watch-outs
- Watch-outs: built in 1958 — expect roof / HVAC / electrical / plumbing capex.
- Climate carrying-cost: severe wind risk, 99% chance of damaging wind over 30y; extreme-heat days projected 7→21/yr by 2055 (HVAC capex compounding) — expect insurance premiums to compound above CPI over the hold.
Questions for the listing agent
- What do current leases actually rent for vs. the listed asking? Can we see a recent rent roll and the last 12 months of T-12 income?
- It's been on market 32 days. Have you received any prior offers? Is the seller open to a 30% concession, seller financing, or rate buy-down credit?
- Built in 1958 — when were the roof, HVAC, electrical panel, plumbing, and water heater last replaced?
- Is there a deadline driving the sale (1031 exchange, divorce, estate, relocation)? That informs how much negotiation room exists.
- Schools are B-rated — typically a magnet for longer-tenancy family renters. What's the average tenant stay here, and is there a school-zone premium baked into asking?
- Crime grade is F in this area — have there been break-ins, vandalism, or insurance claims at this property in the last 3 years? What carrier currently insures it and at what premium?
- The area grade is low — what's the realistic commute time and amenity access for the typical tenant pool here? Any planned neighborhood developments (good or bad) we should know about?
- What's the average days-on-market for RENTAL listings here right now (not sales)? A rising rental-DOM trend means longer vacancies and softer asking-rent achievability than the comps imply.
- What's the recent tenant-quality profile in this submarket — average credit score on applications, eviction rate, late-payment / NSF rate, and stable-employment percentage? A property-management company in the area should have these aggregated.
- How much new for-sale + rental construction is in the pipeline within 1–3 miles? Heavy new supply typically softens prices + rents 12–24 months out; constrained supply supports both.
Investment metrics
- 1% rule
- 0.70% ✗
- Cap rate
- 5.28%
- Cash-on-cash
- -3.60%
- DSCR
- 0.84
- GRM
- 12.0
CMA / ARV
- ARV (median comp)
- $360,426
- List price
- $269,000
- Delta
- -25.37%
- Verdict
- UNDERPRICED
- Comps
- 20 within 1.0 mi
Show comp detail 12 sales within ~0.75 mi
| Address | Dist | Beds/Ba | Sqft | Sold | Price | $/sf | Match |
|---|---|---|---|---|---|---|---|
| 1203 Jeanne St | 0.16mi | 3/2.0 (-1) | 2,341 (-2%) | 4mo | $280,000 | $120 | 81 |
| 1709 W University Ave | 0.44mi | 4/2.0 | 2,330 (-3%) | 1mo | $259,900 | $112 | 75 |
| 103 Brookside Dr | 0.27mi | 3/2.0 (-1) | 2,375 (-1%) | 10mo | $256,000 | $108 | 72 |
| 104 Memory Ln | 0.21mi | 4/2.0 | 2,564 (+7%) | 12mo | $330,000 | $129 | 69 |
| 1218 Myrtle Pl | 0.31mi | 3/2.5 (-1) | 2,540 (+6%) | 4mo | $375,000 | $148 | 66 |
| 309 Evangeline Dr | 0.53mi | 4/2.5 | 2,282 (-5%) | 1mo | $255,000 | $112 | 65 |
| 625 Saint Louis St | 0.52mi | 4/3.0 | 2,346 (-2%) | 8mo | $390,000 | $166 | 62 |
| 1411 W St Mary Blvd | 0.42mi | 3/3.0 (-1) | 2,449 (+2%) | 9mo | $362,000 | $148 | 60 |
| 1703 W University Ave | 0.44mi | 3/2.0 (-1) | 2,252 (-6%) | 12mo | $288,000 | $128 | 55 |
| 903 Myrtle Pl | 0.39mi | 3/2.0 (-1) | 2,093 (-12%) | 8mo | $306,000 | $146 | 49 |
| 111 Delmar Ln | 0.67mi | 3/2.5 (-1) | 2,188 (-9%) | 0mo | $190,000 | $87 | 47 |
| 1635 Myrtle Pl | 0.37mi | 3/2.0 (-1) | 2,073 (-13%) | 12mo | $305,000 | $147 | 45 |
Match score weights: distance 35% · size 25% · config 20% · recency 20%. Top-matched comps best support the ARV.
Projected returns pro-forma
-3.0% appreciation · 4.12% rent growth · sell at horizon
- IRR
- -21.3%
- Equity multiple
- 0.26×
- Total profit
- $-55,916
- Equity at exit
- $40,109
- IRR
- -12.7%
- Equity multiple
- 0.22×
- Total profit
- $-58,536
- Equity at exit
- $23,258
Cash invested: $75,320 (down + closing). Projections, not guarantees.
Landlord ↔ Tenant lean methodology
- Overall (STATE)
- 90 Strongly Landlord-Friendly
- State Louisiana
- 90 Strongly Landlord-Friendly · R+12
- County
- — inherits STATE
- City
- — inherits STATE
ZIP-level market 70506
- Home prices YoY
- -34.8%
- Rents YoY
- 4.1%
- Active inventory
- 413
- Price-to-rent
- 12.0×
Monthly cashflow live
- Estimated rent
- $1,873 high interval (Pro) →
- Mortgage (P&I)
- −$1,411
- Tax from tax record
- −$183 /mo · $2,191/yr
- Insurance
- −$112
- HOA
- −$0
- Vacancy / Maint / Mgmt
- −$393
- Net cashflow
- $-226
Break-even live
Sensitivity live
| Price | -10% $-74 | -5% $-150 | +0% $-226 | +5% $-302 | +10% $-378 |
|---|---|---|---|---|---|
| Rent | -10% $-374 | -5% $-300 | +0% $-226 | +5% $-152 | +10% $-78 |
| Rate | -1.0pp $-91 | -0.5pp $-158 | base $-226 | +0.5pp $-296 | +1.0pp $-367 |
UW: 25.0% down · 7.5% · 30yr · 1.5% tax · 5.0% vac · 8.0% maint · 8.0% mgmt
Financing live
Cash to close
- Down payment
- $67,250
- Closing costs
- $8,070
- Reserves months
- —
- Total cash needed
- —
Loan-product check · same deal, 3 products live
Conventional
25% down · 7.5% · 30yr
- Down + closing
- —
- Monthly P&I
- —
- Monthly cashflow
- —
- DSCR
- —
- Eligible?
- —
Personal DTI + credit; lowest rate.
DSCR
20% down · 8.5% · 30yr
- Down + closing
- —
- Monthly P&I
- —
- Monthly cashflow
- —
- DSCR
- —
- Eligible?
- —
No personal income docs; deal must DSCR.
Hard money
10% down · 12.0% · 12mo
- Down + closing
- —
- Monthly P&I
- —
- Monthly cashflow
- —
- DSCR
- —
- Eligible?
- —
Short-term bridge; refi at stabilization.
Rent comps 8 comps
| Address | Beds | Baths | Sqft | Rent | $/sqft | DOM | Units | Dist |
|---|---|---|---|---|---|---|---|---|
| 903 Myrtle Pl Lafayette, LA | 3.0 | 2.0 | 2093 | $2,000 | $0.96 | 22d | 1 | 0.38mi |
| 1312 W University Ave Lafayette, LA | 3.0 | 2.0 | 1700 | $1,300 | $0.76 | 44d | 1 | 0.59mi |
| 517 Saint Patrick St Lafayette, LA | 3.0 | 2.0 | 1600 | $1,650 | $1.03 | 22d | 1 | 0.61mi |
| 215 Versailles Blvd Unit 3 Lafayette, LA | 3.0 | 2.0 | 1800 | $1,675 | $0.93 | 22d | 1 | 0.69mi |
| 244 N College Rd Lafayette, LA | 3.0 | 2.0 | 1721 | $2,000 | $1.16 | 44d | 1 | 1.13mi |
| 119 Saint Julien Ave Lafayette, LA | 4.0 | 3.0 | 1600 | $1,785 | $1.12 | 44d | 1 | 1.17mi |
| 228 Amelia St Lafayette, LA | 3.0 | 1.5 | 1796 | $2,300 | $1.28 | 22d | 1 | 1.17mi |
| 121 Oakcrest Dr Lafayette, LA | 3.0 | 2.0 | 1695 | $1,700 | $1.00 | 22d | 1 | 1.33mi |
Listing history 21 events
-
2026-06-21days on market $269,000 Active 32 DOM
-
2026-06-18days on market $269,000 Active 29 DOM
-
2026-06-17days on market $269,000 Active 28 DOM
-
2026-06-16days on market $269,000 Active 27 DOM
-
2026-06-15days on market $269,000 Active 26 DOM
-
2026-06-14days on market $269,000 Active 24 DOM
-
2026-06-13days on market $269,000 Active 23 DOM
-
2026-06-10days on market $269,000 Active 21 DOM
-
2026-06-09days on market $269,000 Active 20 DOM
-
2026-06-08days on market $269,000 Active 19 DOM
-
2026-06-07days on market $269,000 Active 18 DOM
-
2026-06-05days on market $269,000 Active 15 DOM
-
2026-06-03days on market $269,000 Active 14 DOM
-
2026-06-02days on market $269,000 Active 13 DOM
-
2026-06-01days on market $269,000 Active 12 DOM
-
2026-05-31days on market $269,000 Active 11 DOM
-
2026-05-30days on market $269,000 Active 10 DOM
-
2005-06-15soldstatus $175,000 350-char remark
Show marketing remark (350 chars)
BRIGHT AND OPEN SAINT STREET HOME LOCATED ON A QUIET STREET. BOASTING UPDATED CERAMIC TILE COUNTERTOPS AND TERRAZO FLOORS IN THE KITCHEN, STAINED CONCRETE IN THE FORMAL DINING, SPACIOUS KEEPING AREA, MODERN UPDATED PAINT COLORS, LARGE BACKYARD AND MORE! THE ROOF IS 2 YEARS OLD; ALL WINDOWS ARE 1 YR OLD; APPLIANCES, 3YRS OLD. MUST SEE TO APPRECIATE.
-
2005-04-12$183,900 350-char remark
Show marketing remark (350 chars)
BRIGHT AND OPEN SAINT STREET HOME LOCATED ON A QUIET STREET. BOASTING UPDATED CERAMIC TILE COUNTERTOPS AND TERRAZO FLOORS IN THE KITCHEN, STAINED CONCRETE IN THE FORMAL DINING, SPACIOUS KEEPING AREA, MODERN UPDATED PAINT COLORS, LARGE BACKYARD AND MORE! THE ROOF IS 2 YEARS OLD; ALL WINDOWS ARE 1 YR OLD; APPLIANCES, 3YRS OLD. MUST SEE TO APPRECIATE.
-
2002-01-25soldstatus $122,500
Show marketing remark (180 chars)
GREAT HOUSE ON LARGE TREED LOT. GREAT CONDITION. NEEDS UPDATING, EXTRA ROOM COULD BE 4TH BEDROOM OR TV/PLAY ROOM. LARGE BEDROOMS, LOTS OF STORAGE COVERED PATIO. TERRAZO FLOOR PLAN.
-
2001-09-12$142,000
Show marketing remark (180 chars)
GREAT HOUSE ON LARGE TREED LOT. GREAT CONDITION. NEEDS UPDATING, EXTRA ROOM COULD BE 4TH BEDROOM OR TV/PLAY ROOM. LARGE BEDROOMS, LOTS OF STORAGE COVERED PATIO. TERRAZO FLOOR PLAN.
ⓘ Source: listings_history table (triggers on properties + properties_extension) + one-shot
backfill from property_details.listing_events for pre-trigger history.
Tax reassessment forecast LA · Resets to sale price
- Current annual tax
- $2,191 · $183/mo
- Projected year-2 tax
- $2,191 · $183/mo
- Expected delta
- $0/yr ($0/mo · 0.0%)
ⓘ Screening estimate from a state-policy table — verify with the county assessor before closing.
Climate risk First Street
- Flood 4/10 Moderate FEMA zone X (shaded) · 22% chance over 30 yrs
- Wildfire 1/10 Low
- Heat 9/10 Extreme 7 d/yr ≥108°F today · 21 d/yr by 30 yrs out
- Wind 9/10 Extreme 99% chance of damaging wind over 30 yrs
- Air quality 2/10 Low 0 unhealthy d/yr today · 1 by 30 yrs out
Nearby sold comps map
Loading sold comps map…
Walkable amenities ~0.75 mi
Loading nearby amenities…
Taxation est. · year 1
- Rental income
- $22,471
- − Mortgage interest
- −$15,068
- − Property taxes
- −$2,191
- − Insurance
- −$1,345
- − Repairs & maintenance
- −$1,798
- − Management
- −$1,798
- − Depreciation
- −$7,825
- Taxable loss
- −$7,554
- Est. tax savings @ 24.0%
- +$1,813
- After-tax cash flow
- $-899/yr
For passive investors: Depreciation is non-cash, so a rental often shows a tax loss while cash-flowing — sheltering income. Rental losses are passive: they offset passive income freely, and up to $25,000/yr can offset ordinary (W-2) income if you actively participate and your MAGI is under $100k (phasing out to $0 by $150k); unused losses carry forward. On sale, claimed depreciation is recaptured at up to 25%, and gains may owe capital-gains tax (a 1031 exchange can defer both). Figures are a year-1 estimate at your 24.0% rate — not tax advice; consult a CPA.
Schools (NCES district)
- District
- Lafayette Parish
- NCES district ID
- 2200870
- Math proficiency
- 38% ▼ -32.00%
- Reading proficiency
- 46% ▼ -24.00%
- Median HH income
- $50,238
- Composite
- 36.15/100
- National rank
- #4741
- State rank
- #19 of 98 in LA
Livability — Lafayette
- Score
- 70/100
- State rank
- #63
- US rank
- #8133
Category grades
Schools grade is shown separately in the Schools card above.
Census & demographics
- Census place
- Lafayette, LA
- County
- Lafayette Parish · 207,544 people
- City population
- 158,114
- Metro
- Lafayette, LA
- Population (ZIP)
- 42,318
- Household income
- $57,379
- Rent vs Own
- Severe rent burden
- 2095.0
Population outlook (Lafayette County) Hauer SSP2
- Today (2025)
- 280,930 people
- By 2030
- 301,092 · +7.2%
- By 2040
- 339,456 · +20.8%
- By 2050
- 375,156 · +33.5%
- By 2075
- 451,672 · +60.8%
- By 2100
- 497,203 · +77.0%
Race, ethnicity, and origin ACS 2023
- Neighborhood character
- Diverse neighborhood (Simpson 0.58)
- Race & ethnicity
- White 60% Black 20% Hispanic / Latino 13% Two or more races 13% Asian 3%
- Hispanic origin (detail)
- Mexican 4%
- Common ancestry
- Lithuanian 18% Armenian 1% Slovak 1%
- Foreign-born
- 12% · Canada, Vietnam
- Languages at home
- 83% English-only · Spanish 9% French/Haitian/Cajun 3% Vietnamese 1%
Political lean MEDSL · Lafayette
- 2024 margin
- Solid R (+31.4) · D 33.5% · R 64.8% · Other 1.7%
- 2008→2024 swing
- -0.1pp no change · 2008: -31.3pp · 2024: -31.4pp
- All cycles
- 2024: R+31.4 2020: R+28.7 2016: R+33.6 2012: R+33.7 2008: R+31.3
Not yet ingested
- Civics
- —
Market trends
- HPI YoY
- ▼ -75.28%
- Current HPI
- 140.8445
- Rent YoY
- ▲ 4.12%
- Metro
- Lafayette, LA
- State GDP YoY
- ▲ 3.29%
- F500 in state
- 10
Industry mix (Fortune 500 HQ in LA)
| Industry | F500 HQs | Revenue |
|---|---|---|
| Telecommunications | 2 | $23B |
|
||
| Utilities | 1 | $12B |
|
||
| Wholesale / Distribution | 1 | $5B |
|
||
| Advertising | 1 | $2B |
|
||
Price history
+89.4% since first listed5 events — show timeline
- 2026-05-20 Listed $269,000 AcadianaMLS
- 2005-06-15 Sold (MLS) $175,000 AcadianaMLS
- 2005-04-12 Listed $183,900 AcadianaMLS
- 2002-01-25 Sold (MLS) $122,500 AcadianaMLS
- 2001-09-12 Listed $142,000 AcadianaMLS
Property tax history
+6.6%/yrLatest (2025): $2,191 · -1.1% YoY. Source: county tax records.
Cash-flow waterfall
monthlySold comps — $/sqft
last 12 mo · ≤1 miLoading sold comps…