 Duplex
51 Pequot Trl · Pawcatuck, CT
Flood risk 1/10 · Minimal
- FEMA flood zone
- X (unshaded)
- Chance of flooding over 30 yrs
- 0.0%
- Est. flood insurance / yr
- $473 – $860
Fire risk 1/10 · Minimal
- Est. fire insurance / yr
- $829 – $1,539
Heat risk 6/10 · Moderate
- Hot days now (above 91°F)
- 7 days/yr
- Hot days in 30 yrs
- 17 days/yr
Wind risk 8/10 · Major
- Chance of severe wind over 30 yrs
- 80.0%
Air-quality risk 3/10 · Minor
- Unhealthy air days now
- 3 days/yr
- Unhealthy air days in 30 yrs
- 4 days/yr
Risk factors via First Street. Map © Google.
Why this score? — see what drove the D grade
The composite is a weighted blend of 9 inputs, each scored 0–100. Each bar is that input's sub-score; the figure is the points it added to the 100-point composite (weight × sub-score).
- Cash flow +13.5/30.0
- ARV discount +7.5/15.0
- Schools +5.5/10.0
- DSCR +4.1/10.0
- Livability +3.6/5.0
- 1% rule +2.9/10.0
- Rent growth +2.5/5.0
- Condition / age +2.5/5.0
- Appreciation +0.0/10.0
$365,000
🖨 Deal sheet 📄 Offer letter ✓ Due diligence
Multi-family units
County records classify this as Multi-Family (2-4 Unit). Listing-text estimate: 2 units. confirmed
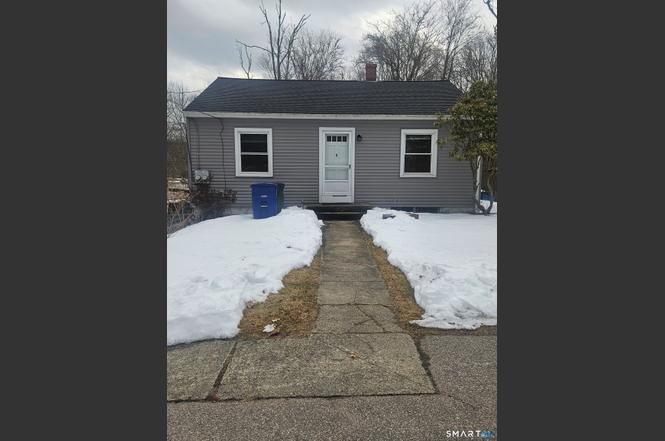
Listing remarks
Move in condition, 2 family featuring 2 bedrooms and one full bath on upper level and 1 bedroom and one full bath on lower level. Opportunity for owner occupied or investors. 50 year life time architectural shingles/windows/doors all type of exterior siding replaced 2024 and . 29 acre lot with nice backyard. Paved driveway with adequate parking spaces for both units. Conveniently located to shopping, restaurants and local entertainment.
Key facts
- Paved driveway
- Conveniently located
- 0.29 acre lot
Tags
Neighborhood map
What this means for you Summary
Snapshot
- This is a 2 × 3-bed/2.0-bath units multifamily listed at $365k.
Deal economics
- At list price, monthly cash flow is $12 ($147/yr) — positive. Per door: $6/mo.
- The deal already cash-flows at list — no discount required.
- To meet the 1% rule (rent ≥ 1% of price), the offer needs to be $288k (21.2% below list).
- Recommended offer: $288k (21.2% below list) — sets the bar for 1% rule.
Location & tenants
- Location reads 72/100 on livability (#81 in CT) — a middle-class / working-renter tenant base. Strengths: housing A+, crime A, health & safety A; Watch: amenities F, commute F.
- Stonington School District (suburban): math 54% / reading 70% proficiency, ranked #43 of 153 in CT (top 28%) — acceptable for families but not a draw, mixed tenant base, ~2y average lease; only 14% free/reduced lunch — higher-income household profile.
- Market conditions: 25 active listings in the ZIP; 4 comparable units currently listed for rent nearby; rentals leasing fast (median 2d on market — plan ~1-2 weeks tenant-placement turnaround); 487 units permitted in Southeastern Connecticut Planning Region in 2024 (244 in 5+ unit buildings).
Forward outlook
- Local home prices are declining (-3.0%/yr); year-one equity from $3k of loan paydown is wiped out by about $11k of value loss. Plan a longer hold.
Negotiation context
- Only 5 days on market — expect competitive offers; lowballing is unlikely to land.
Risks & watch-outs
- Climate carrying-cost: severe wind risk, 80% chance of damaging wind over 30y; extreme-heat days projected 7→17/yr by 2055 (HVAC capex compounding) — expect insurance premiums to compound above CPI over the hold.
Questions for the listing agent
- Can we see the unit-by-unit rent roll, current vacancy, and any below-market leases? What's the average tenancy length?
- What capital expenditures (roof, boiler, parking lot, exteriors) have been made in the last 5 years, and what's planned in the next 2?
- Built in 1960 — when were the roof, HVAC, electrical panel, plumbing, and water heater last replaced?
- Is there a deadline driving the sale (1031 exchange, divorce, estate, relocation)? That informs how much negotiation room exists.
- Schools are B-rated — typically a magnet for longer-tenancy family renters. What's the average tenant stay here, and is there a school-zone premium baked into asking?
- The area grade is low — what's the realistic commute time and amenity access for the typical tenant pool here? Any planned neighborhood developments (good or bad) we should know about?
- What's the average days-on-market for RENTAL listings here right now (not sales)? A rising rental-DOM trend means longer vacancies and softer asking-rent achievability than the comps imply.
- What's the recent tenant-quality profile in this submarket — average credit score on applications, eviction rate, late-payment / NSF rate, and stable-employment percentage? A property-management company in the area should have these aggregated.
- How much new apartment / multifamily construction is in the pipeline within 1–3 miles? Heavy new supply (>2% of stock underway) typically softens rents 12–24 months out; light construction supports rent growth.
Investment metrics
- 1% rule
- 0.79% ✗
- Cap rate
- 6.33%
- Cash-on-cash
- 0.14%
- DSCR
- 1.01
- GRM
- 10.6
CMA / ARV
No comps found within radius.
Projected returns pro-forma
-3.0% appreciation · 3.0% rent growth · sell at horizon
- IRR
- -16.1%
- Equity multiple
- 0.43×
- Total profit
- $-58,482
- Equity at exit
- $54,423
- IRR
- -7.8%
- Equity multiple
- 0.51×
- Total profit
- $-50,398
- Equity at exit
- $31,559
Cash invested: $102,200 (down + closing). Projections, not guarantees.
Landlord ↔ Tenant lean methodology
- Overall (STATE)
- 27 Tenant-Leaning
- State Connecticut
- 27 Tenant-Leaning · D+7
- County
- — inherits STATE
- City
- — inherits STATE
ZIP-level market 06379
- Active inventory
- 25
- Price-to-rent
- 21.2×
Monthly cashflow live
- Estimated rent
- $2,876 medium interval (Pro) →
- Mortgage (P&I)
- −$1,914
- Tax from tax record
- −$194 /mo · $2,323/yr
- Insurance
- −$152
- HOA
- −$0
- Vacancy / Maint / Mgmt
- −$604
- Net cashflow
- $12
Break-even live
2-unit breakdown (identical units grouped — click to expand)
| Units | Beds | Baths | Est. rent |
|---|---|---|---|
| 2× units | 3 | 2 | $2,876 |
| #1 | 3 | 2 | $1,438 |
| #2 | 3 | 2 | $1,438 |
| Total (2 units) | $2,876 | ||
UW: 25.0% down · 7.5% · 30yr · 1.5% tax · 5.0% vac · 8.0% maint · 8.0% mgmt
Financing live
Cash to close
- Down payment
- $91,250
- Closing costs
- $10,950
- Reserves months
- —
- Total cash needed
- —
Loan-product check · same deal, 3 products live
Conventional
25% down · 7.5% · 30yr
- Down + closing
- —
- Monthly P&I
- —
- Monthly cashflow
- —
- DSCR
- —
- Eligible?
- —
Personal DTI + credit; lowest rate.
DSCR
20% down · 8.5% · 30yr
- Down + closing
- —
- Monthly P&I
- —
- Monthly cashflow
- —
- DSCR
- —
- Eligible?
- —
No personal income docs; deal must DSCR.
Hard money
10% down · 12.0% · 12mo
- Down + closing
- —
- Monthly P&I
- —
- Monthly cashflow
- —
- DSCR
- —
- Eligible?
- —
Short-term bridge; refi at stabilization.
Rent comps 4 comps
| Address | Beds | Baths | Sqft | Rent | $/sqft | DOM | Units | Dist |
|---|---|---|---|---|---|---|---|---|
| 143 W Broad St #2 Pawcatuck, CT | 3.0 | 1.0 | 1115 | $2,250 | $2.02 | 1d | 1 | 0.42mi |
| 8 Wells Ave Pawcatuck, CT | 3.0 | 2.5 | 1120 | $2,750 | $2.46 | 1d | 1 | 0.52mi |
| 33 Railroad Ave #2 Westerly, RI | 2.0 | 1.0 | 900 | $2,400 | $2.67 | 1d | 1 | 1.00mi |
| 9 York Ave Westerly, RI | 2.0 | 1.0 | 1072 | $2,100 | $1.96 | 17d | 1 | 1.30mi |
Listing history 2 events
-
2026-03-04status Under Contract
-
2026-02-27$365,000 Active
ⓘ Source: listings_history table (triggers on properties + properties_extension) + one-shot
backfill from property_details.listing_events for pre-trigger history.
Tax reassessment forecast CT · Partial reset (capped growth)
- Current annual tax
- $2,323 · $194/mo
- Projected year-2 tax
- $5,067 · $422/mo
- Expected delta
- +$2,744/yr (+$229/mo · 118.1%)
ⓘ Screening estimate from a state-policy table — verify with the county assessor before closing.
Climate risk First Street
- Flood 1/10 Low FEMA zone X (unshaded) · 0% chance over 30 yrs
- Wildfire 1/10 Low
- Heat 6/10 Major 7 d/yr ≥91°F today · 17 d/yr by 30 yrs out
- Wind 8/10 Severe 80% chance of damaging wind over 30 yrs
- Air quality 3/10 Moderate 3 unhealthy d/yr today · 4 by 30 yrs out
Nearby sold comps map
Loading sold comps map…
Walkable amenities ~0.75 mi
Loading nearby amenities…
Taxation est. · year 1
- Rental income
- $34,512
- − Mortgage interest
- −$20,446
- − Property taxes
- −$2,323
- − Insurance
- −$1,825
- − Repairs & maintenance
- −$2,761
- − Management
- −$2,761
- − Depreciation
- −$10,618
- Taxable loss
- −$6,222
- Est. tax savings @ 24.0%
- +$1,493
- After-tax cash flow
- $1,641/yr
For passive investors: Depreciation is non-cash, so a rental often shows a tax loss while cash-flowing — sheltering income. Rental losses are passive: they offset passive income freely, and up to $25,000/yr can offset ordinary (W-2) income if you actively participate and your MAGI is under $100k (phasing out to $0 by $150k); unused losses carry forward. On sale, claimed depreciation is recaptured at up to 25%, and gains may owe capital-gains tax (a 1031 exchange can defer both). Figures are a year-1 estimate at your 24.0% rate — not tax advice; consult a CPA.
Schools (NCES district)
- District
- Stonington School District
- NCES district ID
- 0904380
- Math proficiency
- 54% ▼ -10.00%
- Reading proficiency
- 70% ▼ -7.00%
- Median HH income
- $75,939
- Composite
- 55.15/100
- National rank
- #1280
- State rank
- #43 of 153 in CT
Livability — Pawcatuck
- Score
- 72/100
- State rank
- #81
- US rank
- #6033
Category grades
Schools grade is shown separately in the Schools card above.
Census & demographics
- Census place
- Pawcatuck, CT
- City population
- 9,003
- Population (ZIP)
- 9,003
Population outlook (Southeastern Connecticut County) Hauer SSP2
- By 2040
- 293,442
Race, ethnicity, and origin ACS 2023
- Neighborhood character
- Predominantly White (84%)
- Race & ethnicity
- White 84% Two or more races 8% Hispanic / Latino 3% Black 3% Asian 2%
- Common ancestry
- Russian 6% Lithuanian 5% Slovak 5%
- Foreign-born
- 5% · Canada
- Languages at home
- 94% English-only · Other Indo-European 3% Spanish 1% French/Haitian/Cajun 0%
Political lean MEDSL · Southeastern Connecticut
- 2024 margin
- D (+13.0) · D 55.6% · R 42.6% · Other 1.8%
- All cycles
- 2024: D+13.0
Not yet ingested
- Civics
- —
Market trends
- HPI YoY
- ▼ -139.18%
- Current HPI
- 187.2421
- Rent YoY
- —
- Metro
- —
- State GDP YoY
- ▲ 1.06%
- F500 in state
- 38
Industry mix (Fortune 500 HQ in CT)
| Industry | F500 HQs | Revenue |
|---|---|---|
| Industrial Machinery | 4 | $38B |
|
||
| Insurance | 3 | $71B |
|
||
| Financial Services | 2 | $25B |
|
||
| Transportation / Logistics | 2 | $18B |
|
||
| Healthcare | 1 | $247B |
|
||
| Telecommunications | 1 | $55B |
|
||
Price history
2 events — show timeline
- 2026-03-04 Pending — Smart MLS
- 2026-02-27 Listed $365,000 Smart MLS
Property tax history
+0.4%/yrLatest (2022): $2,323 · -0.1% YoY. Source: county tax records.
Cash-flow waterfall
monthlySold comps — $/sqft
last 12 mo · ≤1 miLoading sold comps…