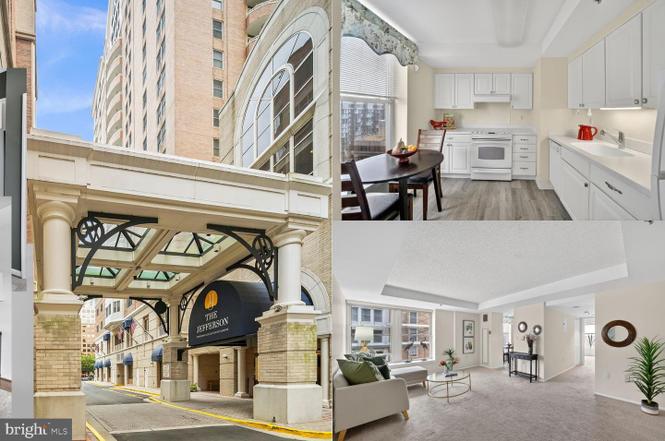
900 N Taylor St #1905 · Arlington, VA
Flood risk No data
- FEMA flood zone
- —
- Chance of flooding over 30 yrs
- —
- Est. flood insurance / yr
- —
Fire risk No data
- Est. fire insurance / yr
- —
Heat risk No data
- Hot days now (above threshold)
- —
- Hot days in 30 yrs
- —
Wind risk No data
- Chance of severe wind over 30 yrs
- —
Air-quality risk No data
- Unhealthy air days now
- —
- Unhealthy air days in 30 yrs
- —
Risk factors via First Street. Map © Google.
Why this score? — see what drove the B grade
The composite is a weighted blend of 9 inputs, each scored 0–100. Each bar is that input's sub-score; the figure is the points it added to the 100-point composite (weight × sub-score).
- Cash flow +30.0/30.0
- 1% rule +10.0/10.0
- DSCR +10.0/10.0
- ARV discount +7.5/15.0
- Schools +6.5/10.0
- Livability +4.3/5.0
- Rent growth +2.6/5.0
- Condition / age +2.5/5.0
- Appreciation +0.0/10.0
$125,000
🖨 Deal sheet (PDF) 📄 Offer letter ✓ Due diligence
Listing remarks MLS
The Jefferson is a full service retirement community for adults 55+. A non-optional monthly service fee of $2,430 covers most of your amenities. Visit The Jefferson today and let us help you find the perfect retirement home. This is a very well maintained Hancock Model immediately ready to move in.
Key facts
- Housekeeping
- In-house dining
- Transportation
Tags
Property features AI
Finance
- HOA & community: Monthly condo fee of $272; HOA covers common area maintenance, exterior building maintenance, reserve funds, snow removal, trash, and water; Community amenities include art studio, beauty salon, common grounds, community center, concierge, dining rooms, elevator, exercise/fitness room, library, meeting room, newspaper service, indoor pool, spa, transportation service, and retirement community features
Exterior
- Parking: Underground parking garage; Approximately 300 garage/parking spaces; Visitor parking available
- Security: Concierge
- Utilities: Public water; Public sewer
- Home design: Condominium unit (Unit/Flat); Hi-rise building (9+ floors); Senior community (55+)
- Construction: Brick construction; Shore year built per assessor
- Exterior features: Indoor community pool; Above grade and below grade structures; Accessible features including 32"+ wide doors, lever door handles, elevator, and grab bars
Interior
- Bedrooms: 1 bedroom on the main level
- Bathrooms: 1 full bathroom on the main level; 1 full bathroom
- Heating & cooling: Heat pump heating; Heat pump cooling; Electric hot water
- Interior features: No basement; Living area per assessor
- Laundry & utility: Washer/dryer hookups in unit
Neighborhood map
What this means for you Summary
Snapshot
- This is a 1-bed/1.0-bath condo listed at $125k.
Deal economics
- At list price, monthly cash flow is $825 ($10k/yr) — positive.
- The deal already cash-flows at list — no discount required.
- Meets the 1% rule at list price ($2k rent vs $125k).
- Recommended offer: $121k (3.0% below list) — sets the bar for market timing.
- Cap rate 14.2% vs local median 1.7% in Arlington — top-decile yield for the area; either an underpriced asset or a hidden risk that comps aren't pricing in. Stress-test before assuming the spread holds.
Location & tenants
- Location reads 86/100 on livability (#14 in VA, #387 nationally) — a professional / high-income tenant draw. Strengths: schools A+, crime A+, amenities A+; Watch: cost of living F.
- Arlington County Public School District (urban): math 65% / reading 77% proficiency, ranked #8 of 131 in VA (top 6%) — strong family-tenant draw, lease renewals of 3-5y typical.
- Market conditions: Rents flat; 59 active listings in the ZIP; 40 comparable units currently listed for rent nearby; rentals at typical pace (median 16d on market — plan ~3-4 weeks tenant-placement turnaround); high-income renter base; 621 units permitted in Arlington County in 2024 (429 in 5+ unit buildings).
Forward outlook
- Local home prices are declining (-3.0%/yr); year-one equity from $864 of loan paydown is wiped out by about $4k of value loss. Plan a longer hold.
- Arlington County population projected at +44% by 2050 — long-run rental-demand tailwind backs the buy-and-hold thesis.
- At projected returns (-3.0% appreciation + 0.6% rent growth), your $35k cash investment doubles in ~5 years — after that, you're playing with house money.
Negotiation context
- It's been on market 60 days — a 3% lower offer ($121k) is reasonable based on typical stale-listing flexibility.
- 6 sale attempts since 22y ago with the ask held roughly flat each time — persistent listings suggest the price (not the market) is what's stuck; bring a comps-based counter.
- Current owner paid $90k; 39% above their basis — modest negotiation headroom, anchor on the comps not their cost.
Questions for the listing agent
- It's been on market 60 days. Have you received any prior offers? Is the seller open to a 3% concession, seller financing, or rate buy-down credit?
- What does the HOA fee cover, when was the last increase, and are there any pending special assessments or reserve-fund shortfalls?
- Any open or pending special assessments — roof, HVAC, plumbing, elevator, façade? What's the per-unit balance and payoff schedule, and is the seller paying it off at close or rolling it to the buyer?
- Is there a deadline driving the sale (1031 exchange, divorce, estate, relocation)? That informs how much negotiation room exists.
- Schools are A-rated — typically a magnet for longer-tenancy family renters. What's the average tenant stay here, and is there a school-zone premium baked into asking?
- What's the average days-on-market for RENTAL listings here right now (not sales)? A rising rental-DOM trend means longer vacancies and softer asking-rent achievability than the comps imply.
- What's the recent tenant-quality profile in this submarket — average credit score on applications, eviction rate, late-payment / NSF rate, and stable-employment percentage? A property-management company in the area should have these aggregated.
- How much new apartment / multifamily construction is in the pipeline within 1–3 miles? Heavy new supply (>2% of stock underway) typically softens rents 12–24 months out; light construction supports rent growth.
Investment metrics
- 1% rule
- 1.91% ✓
- Cap rate
- 14.21%
- Cash-on-cash
- 28.27%
- DSCR
- 2.26
- GRM
- 4.4
CMA / ARV
No comps found within radius.
Projected returns pro-forma
-3.0% appreciation · 0.56% rent growth · sell at horizon
- IRR
- 19.4%
- Equity multiple
- 1.76×
- Total profit
- $26,707
- Equity at exit
- $18,638
- IRR
- 25.8%
- Equity multiple
- 2.98×
- Total profit
- $69,181
- Equity at exit
- $10,808
Cash invested: $35,000 (down + closing). Projections, not guarantees.
Landlord ↔ Tenant lean methodology
- Overall (STATE)
- 55 Moderately Landlord-Leaning
- State Virginia
- 55 Moderately Landlord-Leaning · D+2
- County
- — inherits STATE
- City
- — inherits STATE
ZIP-level market 22203
- Rents YoY
- 0.6%
- Active inventory
- 59
- Price-to-rent
- 4.4×
Monthly cashflow live
- Estimated rent
- $2,386 high interval (Pro) →
- Mortgage (P&I)
- −$656
- Tax from tax record
- −$80 /mo · $966/yr
- Insurance
- −$52
- HOA
- −$272
- Vacancy / Maint / Mgmt
- −$501
- Net cashflow
- $825
Break-even live
Sensitivity live
| Price | -10% $895 | -5% $860 | +0% $825 | +5% $789 | +10% $754 |
|---|---|---|---|---|---|
| Rent | -10% $636 | -5% $730 | +0% $825 | +5% $919 | +10% $1,013 |
| Rate | -1.0pp $888 | -0.5pp $856 | base $825 | +0.5pp $792 | +1.0pp $759 |
UW: 25.0% down · 7.5% · 30yr · 1.5% tax · 5.0% vac · 8.0% maint · 8.0% mgmt
Financing live
Cash to close
- Down payment
- $31,250
- Closing costs
- $3,750
- Reserves months
- —
- Total cash needed
- —
Loan-product check · same deal, 3 products live
Conventional
25% down · 7.5% · 30yr
- Down + closing
- —
- Monthly P&I
- —
- Monthly cashflow
- —
- DSCR
- —
- Eligible?
- —
Personal DTI + credit; lowest rate.
DSCR
20% down · 8.5% · 30yr
- Down + closing
- —
- Monthly P&I
- —
- Monthly cashflow
- —
- DSCR
- —
- Eligible?
- —
No personal income docs; deal must DSCR.
Hard money
10% down · 12.0% · 12mo
- Down + closing
- —
- Monthly P&I
- —
- Monthly cashflow
- —
- DSCR
- —
- Eligible?
- —
Short-term bridge; refi at stabilization.
Rent comps 40 comps
| Address | Beds | Baths | Sqft | Rent | $/sqft | DOM | Units | Dist |
|---|---|---|---|---|---|---|---|---|
| 900 N Taylor St #1510 Arlington, VA | 1.0 | 1.0 | 686 | $5,854 | $8.53 | 44d | 1 | 0.02mi |
| 851 N Glebe Rd #1812 Arlington, VA | — | 1.0 | 550 | $2,000 | $3.64 | 22d | 1 | 0.07mi |
| 850 N Randolph St Arlington, VA | 1.0–2.0 | 1.0–2.0 | 807 | $2,401 | $2.97 | 3d | 1 | 0.15mi |
| 1050 N Stuart St Arlington, VA | 1.0 | 1.0 | 748 | $1,450 | $1.94 | 14d | 1 | 0.18mi |
| 1020 N Stafford St Arlington, VA | 1.0 | 1.0 | 683 | $2,350 | $3.44 | 4d | 1 | 0.18mi |
| 672 N Glebe Rd Arlington, VA | 1.0–2.0 | 1.0–2.0 | 943 | $2,793 | $2.96 | 2d | 7 | 0.18mi |
| 1020 N Stafford St Arlington, VA | 1.0 | 1.0 | 605 | $2,375 | $3.92 | 8d | 2 | 0.19mi |
| 700 N Randolph St Arlington, VA | 2.0 | 1.0–2.0 | 782 | $3,454 | $4.41 | 2d | 23 | 0.22mi |
| 4040 Wilson Blvd Arlington, VA | 2.0 | 1.0–2.0 | 759 | $3,614 | $4.76 | 2d | 15 | 0.25mi |
| 4200 N Carlin Springs Rd Arlington, VA | 2.0 | 1.0–2.0 | 771 | $2,875 | $3.73 | 2d | 20 | 0.25mi |
| 624 N Glebe Rd Arlington, VA | 2.0 | 1.0–2.0 | 888 | $3,656 | $4.11 | 2d | 22 | 0.27mi |
| 888 N Quincy St #908 Arlington, VA | 1.0 | 1.0 | 684 | $2,500 | $3.65 | 22d | 1 | 0.27mi |
| 818 N Quincy St Arlington, VA | 1.0–2.0 | 1.0–2.0 | 938 | $2,629 | $2.80 | 2d | 21 | 0.29mi |
| 4000 Wilson Blvd Arlington, VA | 2.0 | 1.0–2.0 | 874 | $3,495 | $4.00 | 2d | 16 | 0.29mi |
| 4206 Washington Blvd Unit 3 Arlington, VA | 1.0 | 1.0 | 575 | $2,200 | $3.83 | 44d | 1 | 0.31mi |
| 4510 Washington Blvd Unit B1 Arlington, VA | — | 1.0 | 650 | $1,550 | $2.38 | 8d | 1 | 0.33mi |
| 820 N Pollard St Arlington, VA | 1.0 | 1.0 | 724 | $2,575 | $3.55 | 14d | 1 | 0.34mi |
| 4650 Washington Blvd Arlington, VA | 2.0 | 1.0–2.0 | 847 | $2,855 | $3.37 | 3d | 1 | 0.36mi |
| 901 N Pollard St Arlington, VA | 1.0–3.0 | 1.0–2.0 | 1057 | $2,380 | $2.25 | 3d | 17 | 0.37mi |
| 4141 N Henderson Rd Arlington, VA | 1.0 | 1.0 | 734 | $2,175 | $2.96 | 44d | 2 | 0.41mi |
| 4141 N Henderson Rd Arlington, VA | 1.0 | 1.0 | 732 | $3,200 | $4.37 | 15d | 2 | 0.41mi |
| 3800 Fairfax Dr #1801 Arlington, VA | 1.0 | 1.0 | 550 | $2,200 | $4.00 | 44d | 1 | 0.43mi |
| 3601 Fairfax Dr Arlington, VA | 1.0–2.0 | 1.0–2.0 | 857 | $2,471 | $2.88 | 3d | 24 | 0.51mi |
| 726 N Nelson St Arlington, VA | 1.0 | 1.0 | 650 | $2,100 | $3.23 | 25d | 1 | 0.52mi |
| 901 N Nelson St Arlington, VA | 1.0–2.0 | 1.0–2.0 | 953 | $2,637 | $2.77 | 2d | 19 | 0.53mi |
| 3515 Washington Blvd #406 Arlington, VA | — | 1.0 | 400 | $1,750 | $4.38 | 15d | 1 | 0.57mi |
| 712 N Monroe St Apt 4 Arlington, VA | 1.0 | 1.0 | 500 | $1,850 | $3.70 | 44d | 1 | 0.58mi |
| 704 N Monroe St Unit 3 Arlington, VA | 1.0 | 1.0 | 450 | $1,850 | $4.11 | 44d | 1 | 0.58mi |
| 700 N Monroe St Arlington, VA | 1.0 | 1.0 | 450 | $1,850 | $4.11 | 44d | 1 | 0.59mi |
| 235 N George Mason Dr Unit 4 Arlington, VA | 1.0 | 1.0 | 699 | $1,950 | $2.79 | 44d | 1 | 0.71mi |
| 235 N George Mason Dr Unit 235-4 Arlington, VA | 1.0 | 1.0 | 699 | $1,900 | $2.72 | 44d | 1 | 0.71mi |
| 250 N Thomas St Arlington, VA | 1.0 | 1.0 | 666 | $950 | $1.43 | 44d | 1 | 0.71mi |
| 229 N George Mason Dr Arlington, VA | 1.0 | 1.0 | 666 | $1,150 | $1.73 | 44d | 1 | 0.72mi |
| 230 N George Mason Dr Unit 230-4 Arlington, VA | 1.0 | 1.0 | 651 | $1,850 | $2.84 | 44d | 1 | 0.72mi |
| 4378 N Pershing Dr #43784 Arlington, VA | 1.0 | 1.0 | 651 | $1,675 | $2.57 | 44d | 1 | 0.74mi |
| 214 N George Mason Dr Arlington, VA | 1.0 | 1.0 | 651 | $1,550 | $2.38 | 8d | 1 | 0.76mi |
| 201 N Trenton St #1 Arlington, VA | 1.0 | 1.0 | 670 | $2,200 | $3.28 | 8d | 1 | 0.80mi |
| 206 N Trenton St Unit 206-2 Arlington, VA | 1.0 | 1.0 | 699 | $1,750 | $2.50 | 25d | 1 | 0.80mi |
| 104 N George Mason Dr Unit 104-2 Arlington, VA | 1.0 | 1.0 | 651 | $1,750 | $2.69 | 44d | 1 | 0.83mi |
| 4111 18th Rd N #1 Arlington, VA | — | 1.0 | 700 | $2,100 | $3.00 | 8d | 1 | 0.88mi |
HOA detail condo
- Monthly dues
- $272 · $3,264/yr
- Assessments
- None detected in remarks — confirm with the listing agent.
Listing history 23 events
-
2026-05-01status Pending
-
2026-03-02$125,000 Active
-
2016-06-20historical 299-char remark
Show marketing remark (299 chars)
The Jefferson is a full service retirement community for adults 55+. A non-optional monthly service fee of $2,430 covers most of your amenities. Visit The Jefferson today and let us help you find the perfect retirement home. This is a very well maintained Hancock Model immediately ready to move in.
-
2016-06-16soldstatus $90,000
-
2016-06-15soldstatus $90,000 Sold 299-char remark
Show marketing remark (299 chars)
The Jefferson is a full service retirement community for adults 55+. A non-optional monthly service fee of $2,430 covers most of your amenities. Visit The Jefferson today and let us help you find the perfect retirement home. This is a very well maintained Hancock Model immediately ready to move in.
-
2016-06-15soldstatus $90,000 299-char remark
Show marketing remark (299 chars)
The Jefferson is a full service retirement community for adults 55+. A non-optional monthly service fee of $2,430 covers most of your amenities. Visit The Jefferson today and let us help you find the perfect retirement home. This is a very well maintained Hancock Model immediately ready to move in.
-
2016-04-16status Contingent (No Kick Out) 299-char remark
Show marketing remark (299 chars)
The Jefferson is a full service retirement community for adults 55+. A non-optional monthly service fee of $2,430 covers most of your amenities. Visit The Jefferson today and let us help you find the perfect retirement home. This is a very well maintained Hancock Model immediately ready to move in.
-
2016-03-11$100,000 Active 299-char remark
Show marketing remark (299 chars)
The Jefferson is a full service retirement community for adults 55+. A non-optional monthly service fee of $2,430 covers most of your amenities. Visit The Jefferson today and let us help you find the perfect retirement home. This is a very well maintained Hancock Model immediately ready to move in.
-
2014-09-23historical
-
2014-08-04soldstatus $100,000
-
2014-07-31soldstatus $100,000 Sold
-
2014-07-31soldstatus $100,000
-
2014-07-09status Active
-
2014-07-01historical Expired
-
2014-04-15$120,000 Active
-
2007-04-05soldstatus $168,000
-
2007-03-14historical
-
2006-12-13$179,000
-
2004-08-19soldstatus $145,000
-
2004-07-03historical
-
2004-03-10$149,000
-
1995-06-07soldstatus $126,700
-
1995-06-06soldstatus $126,700
ⓘ Source: listings_history table (triggers on properties + properties_extension) + one-shot
backfill from property_details.listing_events for pre-trigger history.
Tax reassessment forecast VA · Resets to sale price
- Current annual tax
- $966 · $80/mo
- Projected year-2 tax
- $1,025 · $85/mo
- Expected delta
- +$59/yr (+$5/mo · 6.1%)
ⓘ Screening estimate from a state-policy table — verify with the county assessor before closing.
Nearby sold comps map
Loading sold comps map…
Walkable amenities ~0.75 mi
Loading nearby amenities…
Taxation est. · year 1
- Rental income
- $28,629
- − Mortgage interest
- −$7,002
- − Property taxes
- −$966
- − Insurance
- −$625
- − Repairs & maintenance
- −$2,290
- − Management
- −$2,290
- − HOA
- −$3,264
- − Depreciation
- −$3,636
- Taxable income
- $8,555
- Est. tax owed @ 24.0%
- −$2,053
- After-tax cash flow
- $7,843/yr
For passive investors: Depreciation is non-cash, so a rental often shows a tax loss while cash-flowing — sheltering income. Rental losses are passive: they offset passive income freely, and up to $25,000/yr can offset ordinary (W-2) income if you actively participate and your MAGI is under $100k (phasing out to $0 by $150k); unused losses carry forward. On sale, claimed depreciation is recaptured at up to 25%, and gains may owe capital-gains tax (a 1031 exchange can defer both). Figures are a year-1 estimate at your 24.0% rate — not tax advice; consult a CPA.
Schools (NCES district)
- District
- Arlington County Public School District
- NCES district ID
- 5100270
- Math proficiency
- 65% ▼ -22.00%
- Reading proficiency
- 77% ▼ -6.00%
- Median HH income
- $103,164
- Composite
- 65.23/100
- National rank
- #492
- State rank
- #8 of 131 in VA
Livability — Arlington
- Score
- 86/100
- State rank
- #14
- US rank
- #387
Category grades
Schools grade is shown separately in the Schools card above.
Census & demographics
- Census place
- Arlington, VA
- County
- Arlington County · 236,086 people
- City population
- 236,086
- Metro
- Washington-Arlington-Alexandria, DC-VA-MD-WV
- Population (ZIP)
- 26,594
- Household income
- $140,135
- Rent vs Own
- Severe rent burden
- 1847.0
Population outlook (Arlington County) Hauer SSP2
- Today (2025)
- 278,021 people
- By 2030
- 301,560 · +8.5%
- By 2040
- 349,063 · +25.6%
- By 2050
- 399,147 · +43.6%
- By 2075
- 505,325 · +81.8%
- By 2100
- 584,095 · +110.1%
Race, ethnicity, and origin ACS 2023
- Neighborhood character
- Diverse neighborhood (Simpson 0.62)
- Race & ethnicity
- White 57% Hispanic / Latino 16% Asian 12% Two or more races 10% Black 8%
- Hispanic origin (detail)
- Mexican 1% Puerto Rican 1%
- Common ancestry
- Romanian 3% Italian 2% Slovak 2%
- Foreign-born
- 23% · Canada, China, South Korea
- Languages at home
- 71% English-only · Spanish 11% Other Indo-European 5% Other Asian/Pacific 3%
Political lean MEDSL · Arlington
- 2024 margin
- Solid D (+58.6) · D 78.2% · R 19.6% · Other 2.1%
- 2008→2024 swing
- +14.0pp toward D · 2008: 44.6pp · 2024: 58.6pp
- All cycles
- 2024: D+58.6 2020: D+63.5 2016: D+60.1 2012: D+39.9 2008: D+44.6
Not yet ingested
- Civics
- —
Market trends
- HPI YoY
- ▼ -474.57%
- Current HPI
- 284.9956
- Rent YoY
- ▲ 0.56%
- Metro
- Washington-Arlington-Alexandria, DC-VA-MD-WV
- State GDP YoY
- ▲ 2.40%
- F500 in state
- 50
Industry mix (Fortune 500 HQ in VA)
| Industry | F500 HQs | Revenue |
|---|---|---|
| Aerospace / Defense | 4 | $236B |
|
||
| Technology / Defense | 3 | $32B |
|
||
| Financial Services | 2 | $176B |
|
||
| Utilities | 2 | $27B |
|
||
| Insurance | 2 | $25B |
|
||
| Technology | 2 | $15B |
|
||
Price history
-1.3% since first listed23 events — show timeline
- 2026-05-01 Pending — BRIGHT MLS
- 2026-03-02 Listed $125,000 BRIGHT MLS
- 2016-06-20 Delisted — MRIS
- 2016-06-16 Sold (Public Records) $90,000 Public Records
- 2016-06-15 Sold (MLS) $90,000 BRIGHT MLS
- 2016-06-15 Sold (MLS) $90,000 MRIS
- 2016-04-16 Pending — MRIS
- 2016-03-11 Listed $100,000 MRIS
- 2014-09-23 Delisted — MRIS
- 2014-08-04 Sold (Public Records) $100,000 Public Records
- 2014-07-31 Sold (MLS) $100,000 BRIGHT MLS
- 2014-07-31 Sold (MLS) $100,000 MRIS
- 2014-07-09 Relisted — MRIS
- 2014-07-01 Delisted — MRIS
- 2014-04-15 Listed $120,000 MRIS
- 2007-04-05 Sold (MLS) $168,000 MRIS
- 2007-03-14 Delisted — MRIS
- 2006-12-13 Listed $179,000 MRIS
- 2004-08-19 Sold (MLS) $145,000 MRIS
- 2004-07-03 Delisted — MRIS
- 2004-03-10 Listed $149,000 MRIS
- 1995-06-07 Sold (Public Records) $126,700 Public Records
- 1995-06-06 Sold (Public Records) $126,700 Public Records
Property tax history
-2.5%/yrLatest (2025): $966 · +1.3% YoY. Source: county tax records.
Cash-flow waterfall
monthlySold comps — $/sqft
last 12 mo · ≤1 miLoading sold comps…