 Multi-family
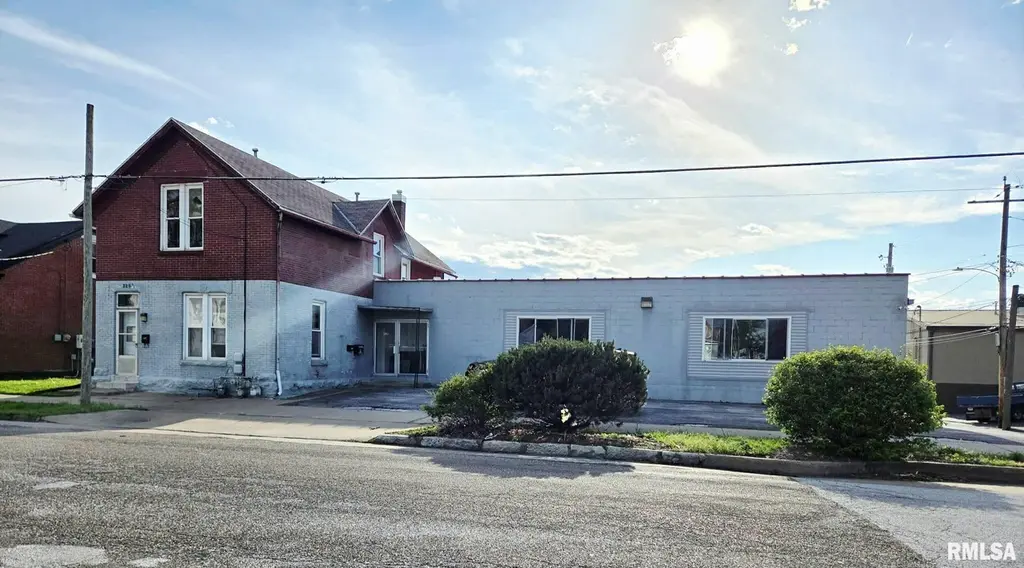
528 S 9th St · Quincy, IL
Flood risk No data
- FEMA flood zone
- —
- Chance of flooding over 30 yrs
- —
- Est. flood insurance / yr
- —
Fire risk No data
- Est. fire insurance / yr
- —
Heat risk No data
- Hot days now (above threshold)
- —
- Hot days in 30 yrs
- —
Wind risk No data
- Chance of severe wind over 30 yrs
- —
Air-quality risk No data
- Unhealthy air days now
- —
- Unhealthy air days in 30 yrs
- —
Risk factors via First Street. Map © Google.
Why this score? — see what drove the B- grade
The composite is a weighted blend of 9 inputs, each scored 0–100. Each bar is that input's sub-score; the figure is the points it added to the 100-point composite (weight × sub-score).
- Cash flow +30.0/30.0
- DSCR +10.0/10.0
- 1% rule +9.0/10.0
- ARV discount +7.5/15.0
- Rent growth +5.0/5.0
- Livability +3.4/5.0
- Schools +2.2/10.0
- Condition / age +1.0/5.0
- Appreciation +0.0/10.0
$172,000
🖨 Deal sheet (PDF) 📄 Offer letter ✓ Due diligence
Multi-family units
County records classify this as Multi-Family (2-4 Unit). Listing-text estimate: 1 unit. estimate disagrees with records
Listing remarks
Incredible Opportunity to Own a Versatile Multi-Use Commercial Property! This unique property offers the perfect blend of income potential and operational flexibility. The main level features approximately 1,400 sq ft of commercial space, ideal for retail, office, or service-based businesses. Above or alongside, you’ll find two 1-bedroom apartments (1 unit rented for $475), providing an excellent opportunity for additional rental income or owner-occupancy. The property also includes a 3,141 sq ft warehouse equipped with three overhead doors and a half bathroom, making it perfect for storage, distribution, or light industrial use. Outside, a large fenced-in equipment yard offers secure
Key facts
- 0.33 acre lot
- 6 parking spots
- Listed 50 days
Property features AI
Finance
- Financial info: Two-unit investment property; Unit 1 currently rented for $475; Unit 2 rent not reported
Exterior
- Parking: Total of 6 parking spaces; On-street parking
- Utilities: Public water; Public sewer
- Home design: Residential income property; Two-or-more-story building; Building area about 1,552 total square feet
- Construction: Not new construction
- Exterior features: Corner lot; Shingle roof; Lot dimensions approximately 144 x 99 x 100 x 142
Interior
- Bedrooms: Two 1-bedroom units
- Bathrooms: Each unit has one full bathroom
- Heating & cooling: Central Air
- Interior features: Full unfinished basement; Central air conditioning
Neighborhood map
What this means for you Summary
Snapshot
- This is a 2-bed/2.0-bath multifamily listed at $172k. Condition is rated poor.
Deal economics
- At list price, monthly cash flow is $718 ($9k/yr) — positive.
- The deal already cash-flows at list — no discount required.
- Meets the 1% rule at list price ($2k rent vs $172k).
- Recommended offer: $167k (3.0% below list) — sets the bar for market timing.
- Cap rate 11.3% vs local median 4.3% in Quincy — top-decile yield for the area; either an underpriced asset or a hidden risk that comps aren't pricing in. Stress-test before assuming the spread holds.
Location & tenants
- Location reads 67/100 on livability (#506 in IL) — a middle-class / working-renter tenant base. Strengths: cost of living A+, housing A+; Watch: crime D, employment D, amenities D-.
- Quincy SD 172 (town): math 24% / reading 27% proficiency, ranked #328 of 620 in IL (top 53%) — low school quality limits family demand, transient renter base, plan for 1-2y turnover.
- Zoned schools: Quincy Sr High School (math 21% / reading 28%, grade F, #256 of 693 statewide, top 44%, 1,924 students, 0% FRL) — zoned schools average 0% FRL vs 48% district-wide (48 pts lower); this property's tenant base skews higher-income than the district average.
- Market conditions: Rents rising fast (+10.8%/yr); 180 active listings in the ZIP; 2 comparable units currently listed for rent nearby; 68 units permitted in Adams County in 2024 (0 in 5+ unit buildings).
- At $2,413/mo this rent would consume 56% of the median local household income ($52k/yr) (locally 1238% of renters already pay >50% of income on rent) — very limited rent-growth headroom before tenants either downsize or default.
Forward outlook
- Local home prices are declining (-3.0%/yr); year-one equity from $1k of loan paydown is wiped out by about $5k of value loss. Plan a longer hold.
- Adams County population projected at -14% by 2050 — secular population decline; favor cash flow + early exit over multi-decade hold.
- At projected returns (-3.0% appreciation + 8.0% rent growth), your $48k cash investment doubles in ~6 years — after that, you're playing with house money.
Negotiation context
- It's been on market 51 days — a 3% lower offer ($167k) is reasonable based on typical stale-listing flexibility.
Questions for the listing agent
- It's been on market 51 days. Have you received any prior offers? Is the seller open to a 3% concession, seller financing, or rate buy-down credit?
- Have any recent inspections been done? Can we get a copy of the seller's disclosures and any deferred-maintenance estimates?
- Is there a deadline driving the sale (1031 exchange, divorce, estate, relocation)? That informs how much negotiation room exists.
- Schools are D-rated, which usually means shorter tenancies and higher turnover. Who's the typical renter profile here, and what's been the actual vacancy rate?
- Crime grade is D in this area — have there been break-ins, vandalism, or insurance claims at this property in the last 3 years? What carrier currently insures it and at what premium?
- What's the average days-on-market for RENTAL listings here right now (not sales)? A rising rental-DOM trend means longer vacancies and softer asking-rent achievability than the comps imply.
- What's the recent tenant-quality profile in this submarket — average credit score on applications, eviction rate, late-payment / NSF rate, and stable-employment percentage? A property-management company in the area should have these aggregated.
- How much new apartment / multifamily construction is in the pipeline within 1–3 miles? Heavy new supply (>2% of stock underway) typically softens rents 12–24 months out; light construction supports rent growth.
Investment metrics
- 1% rule
- 1.40% ✓
- Cap rate
- 11.30%
- Cash-on-cash
- 17.88%
- DSCR
- 1.80
- GRM
- 5.9
CMA / ARV
- ARV (median comp)
- $83,500
- List price
- $172,000
- Delta
- 105.99%
- Verdict
- OVERPRICED
- Comps
- 13 within 1.0 mi
Show comp detail 2 sales within ~0.75 mi
| Address | Dist | Beds/Ba | Sqft | Sold | Price | $/sf | Match |
|---|---|---|---|---|---|---|---|
| 708 Jefferson St | 0.35mi | 2/2.0 | 1,634 (+5%) | 11mo | $27,000 | $17 | 66 |
| 412 S 7th St | 0.21mi | 3/3.0 (+1) | 1,666 (+7%) | 14mo | $15,000 | $9 | 57 |
Match score weights: distance 35% · size 25% · config 20% · recency 20%. Top-matched comps best support the ARV.
Projected returns pro-forma
-3.0% appreciation · 8.0% rent growth · sell at horizon
- IRR
- 14.9%
- Equity multiple
- 1.64×
- Total profit
- $30,623
- Equity at exit
- $25,646
- IRR
- 27.2%
- Equity multiple
- 3.98×
- Total profit
- $143,707
- Equity at exit
- $14,871
Cash invested: $48,160 (down + closing). Projections, not guarantees.
Landlord ↔ Tenant lean methodology
- Overall (STATE)
- 43 Moderately Tenant-Leaning
- State Illinois
- 43 Moderately Tenant-Leaning · D+7
- County
- — inherits STATE
- City
- — inherits STATE
ZIP-level market 62301
- Rents YoY
- 10.8%
- Active inventory
- 180
- Price-to-rent
- 17.6×
Monthly cashflow live
- Estimated rent
- $2,413 medium interval (Pro) →
- Mortgage (P&I)
- −$902
- Tax est. 1.5%
- −$215 /mo · $2,580/yr
- Insurance
- −$72
- HOA
- −$0
- Vacancy / Maint / Mgmt
- −$507
- Net cashflow
- $718
Break-even live
Sensitivity live
| Price | -10% $836 | -5% $777 | +0% $718 | +5% $658 | +10% $599 |
|---|---|---|---|---|---|
| Rent | -10% $527 | -5% $622 | +0% $718 | +5% $813 | +10% $908 |
| Rate | -1.0pp $804 | -0.5pp $761 | base $718 | +0.5pp $673 | +1.0pp $628 |
3-unit breakdown (identical units grouped — click to expand)
| Units | Beds | Baths | Est. rent |
|---|---|---|---|
| 2× units | 1 | 1 | $1,634 |
| #1 | 1 | 1 | $817 |
| #2 | 1 | 1 | $817 |
| 1× unit | 0 | 0 | $779 |
| Total (3 units) | $2,413 | ||
UW: 25.0% down · 7.5% · 30yr · 1.5% tax · 5.0% vac · 8.0% maint · 8.0% mgmt
Financing live
Cash to close
- Down payment
- $43,000
- Closing costs
- $5,160
- Reserves months
- —
- Total cash needed
- —
Loan-product check · same deal, 3 products live
Conventional
25% down · 7.5% · 30yr
- Down + closing
- —
- Monthly P&I
- —
- Monthly cashflow
- —
- DSCR
- —
- Eligible?
- —
Personal DTI + credit; lowest rate.
DSCR
20% down · 8.5% · 30yr
- Down + closing
- —
- Monthly P&I
- —
- Monthly cashflow
- —
- DSCR
- —
- Eligible?
- —
No personal income docs; deal must DSCR.
Hard money
10% down · 12.0% · 12mo
- Down + closing
- —
- Monthly P&I
- —
- Monthly cashflow
- —
- DSCR
- —
- Eligible?
- —
Short-term bridge; refi at stabilization.
Rent comps 2 comps
| Address | Beds | Baths | Sqft | Rent | $/sqft | DOM | Units | Dist |
|---|---|---|---|---|---|---|---|---|
| 201 S 8th St Quincy, IL | 2.0 | 2.5 | 1785 | $1,800 | $1.01 | 44d | 1 | 0.32mi |
| 116 N 3rd St Quincy, IL | 1.0–4.0 | 1.0–2.0 | 1950 | $3,067 | $1.57 | 44d | 12 | 0.68mi |
Listing history 17 events
-
2026-06-19days on market $172,000 Under Contract 51 DOM
-
2026-06-18days on market $172,000 Under Contract 50 DOM
-
2026-06-17days on market $172,000 Under Contract 49 DOM
-
2026-06-16days on market $172,000 Under Contract 48 DOM
-
2026-06-15days on market $172,000 Under Contract 47 DOM
-
2026-06-14days on market $172,000 Under Contract 45 DOM
-
2026-06-12days on market $172,000 Under Contract 44 DOM
-
2026-06-09days on market $172,000 Under Contract 41 DOM
-
2026-06-08days on market $172,000 Under Contract 40 DOM
-
2026-06-07days on market $172,000 Under Contract 39 DOM
-
2026-06-03days on market $172,000 Under Contract 35 DOM
-
2026-06-02days on market $172,000 Under Contract 34 DOM
-
2026-06-01days on market $172,000 Under Contract 33 DOM
-
2026-05-31days on market $172,000 Under Contract 32 DOM
-
2026-05-30days on market $172,000 Under Contract 31 DOM
-
2026-05-11historical Under Contract 1044-char remark
-
2026-04-29$172,000 Active 1044-char remark
ⓘ Source: listings_history table (triggers on properties + properties_extension) + one-shot
backfill from property_details.listing_events for pre-trigger history.
Nearby sold comps map
Loading sold comps map…
Walkable amenities ~0.75 mi
Loading nearby amenities…
Taxation est. · year 1
- Rental income
- $28,956
- − Mortgage interest
- −$9,635
- − Property taxes
- −$2,580
- − Insurance
- −$860
- − Repairs & maintenance
- −$2,316
- − Management
- −$2,316
- − Depreciation
- −$5,004
- Taxable income
- $6,245
- Est. tax owed @ 24.0%
- −$1,499
- After-tax cash flow
- $7,113/yr
For passive investors: Depreciation is non-cash, so a rental often shows a tax loss while cash-flowing — sheltering income. Rental losses are passive: they offset passive income freely, and up to $25,000/yr can offset ordinary (W-2) income if you actively participate and your MAGI is under $100k (phasing out to $0 by $150k); unused losses carry forward. On sale, claimed depreciation is recaptured at up to 25%, and gains may owe capital-gains tax (a 1031 exchange can defer both). Figures are a year-1 estimate at your 24.0% rate — not tax advice; consult a CPA.
Condition & rehab AI · 12 photos
This property requires extensive repairs and updates to improve its condition and value. The main level features approximately 1,400 sq ft of commercial space, ideal for retail, office, or service-based businesses. Above or alongside, you’ll find two 1-bedroom apartments (1 unit rented for $475), providing an excellent opportunity for additional rental income or owner-occupancy.
Repairs flagged
- Major Exposed plumbing in kitchen — Exposed plumbing indicates potential water damage
- Major Exposed plumbing in bathrooms — Exposed plumbing indicates potential water damage
- Major Missing windows — Missing windows compromise structural integrity
- Major Missing cabinets in kitchen — Missing cabinets indicate a lack of storage
- Major Missing fixtures in bathrooms — Missing fixtures indicate a lack of functionality
- Major Missing tiles in bathrooms — Missing tiles indicate a lack of durability
- Major Missing trim on interior walls — Missing trim indicates a lack of aesthetic appeal
- Major Exposed ductwork in HVAC — Exposed ductwork indicates potential air quality issues
Value-add opportunities
- Both Painting and updating interior walls — Painting and updating interior walls can improve both resale and rental value
- Both Rebuilding missing cabinets and fixtures — Rebuilding missing cabinets and fixtures can improve both resale and rental value
- Both Replacing missing windows — Replacing missing windows can improve both resale and rental value
- Both Rebuilding missing flooring — Rebuilding missing flooring can improve both resale and rental value
- Both Rebuilding missing HVAC components — Rebuilding missing HVAC components can improve both resale and rental value
Renovation cost estimate screening
| Repair item | Severity | Est. cost |
|---|---|---|
| Exposed plumbing in kitchen · Exposed plumbing indicates potential water damage | Major | $15,000–50,000 |
| Exposed plumbing in bathrooms · Exposed plumbing indicates potential water damage | Major | $15,000–50,000 |
| Missing windows · Missing windows compromise structural integrity | Major | $15,000–50,000 |
| Missing cabinets in kitchen · Missing cabinets indicate a lack of storage | Major | $15,000–50,000 |
| Missing fixtures in bathrooms · Missing fixtures indicate a lack of functionality | Major | $15,000–50,000 |
| Missing tiles in bathrooms · Missing tiles indicate a lack of durability | Major | $15,000–50,000 |
| Missing trim on interior walls · Missing trim indicates a lack of aesthetic appeal | Major | $15,000–50,000 |
| Exposed ductwork in HVAC · Exposed ductwork indicates potential air quality issues | Major | $15,000–50,000 |
| Total estimated repair cost · 8 items | $120,000–400,000 |
Value-add ROI direction
- Both Painting and updating interior walls — Painting and updating interior walls can improve both resale and rental value ↑
- Both Rebuilding missing cabinets and fixtures — Rebuilding missing cabinets and fixtures can improve both resale and rental value ↑
- Both Replacing missing windows — Replacing missing windows can improve both resale and rental value ↑
- Both Rebuilding missing flooring — Rebuilding missing flooring can improve both resale and rental value ↑
- Both Rebuilding missing HVAC components — Rebuilding missing HVAC components can improve both resale and rental value ↑
ⓘ Cost ranges are severity-bucket heuristics (US national rule-of-thumb). Get contractor quotes + a written scope before underwriting a rehab budget.
Schools (NCES district)
- District
- Quincy SD 172
- NCES district ID
- 1733000
- Math proficiency
- 24% ▬ 0.00%
- Reading proficiency
- 27% ▬ 0.00%
- Median HH income
- $44,132
- Composite
- 21.91/100
- National rank
- #8229
- State rank
- #328 of 620 in IL
Livability — Quincy
- Score
- 67/100
- State rank
- #506
- US rank
- #10458
Category grades
Schools grade is shown separately in the Schools card above.
Census & demographics
- Census place
- Quincy, IL
- County
- Adams County · 30,746 people
- City population
- 30,746
- Metro
- Quincy, IL-MO
- Population (ZIP)
- 30,746
- Household income
- $52,055
- Rent vs Own
- Severe rent burden
- 1238.0
Population outlook (Adams County) Hauer SSP2
- Today (2025)
- 65,795 people
- By 2030
- 64,436 · -2.1%
- By 2040
- 61,007 · -7.3%
- By 2050
- 56,851 · -13.6%
- By 2075
- 46,424 · -29.4%
- By 2100
- 34,305 · -47.9%
Race, ethnicity, and origin ACS 2023
- Neighborhood character
- Predominantly White (84%)
- Race & ethnicity
- White 84% Two or more races 7% Black 6% Hispanic / Latino 3% Asian 1%
- Common ancestry
- Slovak 2% Iranian 1% Lithuanian 1%
- Foreign-born
- 2% · Canada
- Languages at home
- 96% English-only · Spanish 2%
Political lean MEDSL · Adams
- 2024 margin
- Solid R (+47.4) · D 25.6% · R 73.0% · Other 1.5%
- 2008→2024 swing
- -25.0pp toward R · 2008: -22.4pp · 2024: -47.4pp
- All cycles
- 2024: R+47.4 2020: R+46.5 2016: R+47.5 2012: R+35.2 2008: R+22.4
Not yet ingested
- Civics
- —
Market trends
- HPI YoY
- ▼ -121.44%
- Current HPI
- 131.7344
- Rent YoY
- ▲ 10.78%
- Metro
- Quincy, IL-MO
- State GDP YoY
- ▲ 1.59%
- F500 in state
- 60
Industry mix (Fortune 500 HQ in IL)
| Industry | F500 HQs | Revenue |
|---|---|---|
| Insurance | 4 | $201B |
|
||
| Consumer Goods | 4 | $87B |
|
||
| Industrial Machinery | 3 | $64B |
|
||
| Healthcare | 2 | $55B |
|
||
| Retail / Pharmacy | 1 | $148B |
|
||
| Agriculture / Food | 1 | $86B |
|
||
Price history
2 events — show timeline
- 2026-05-11 Contingent — RMLSA as Distributed by MLS Grid
- 2026-04-29 Listed $172,000 RMLSA as Distributed by MLS Grid
Cash-flow waterfall
monthlySold comps — $/sqft
last 12 mo · ≤1 miLoading sold comps…