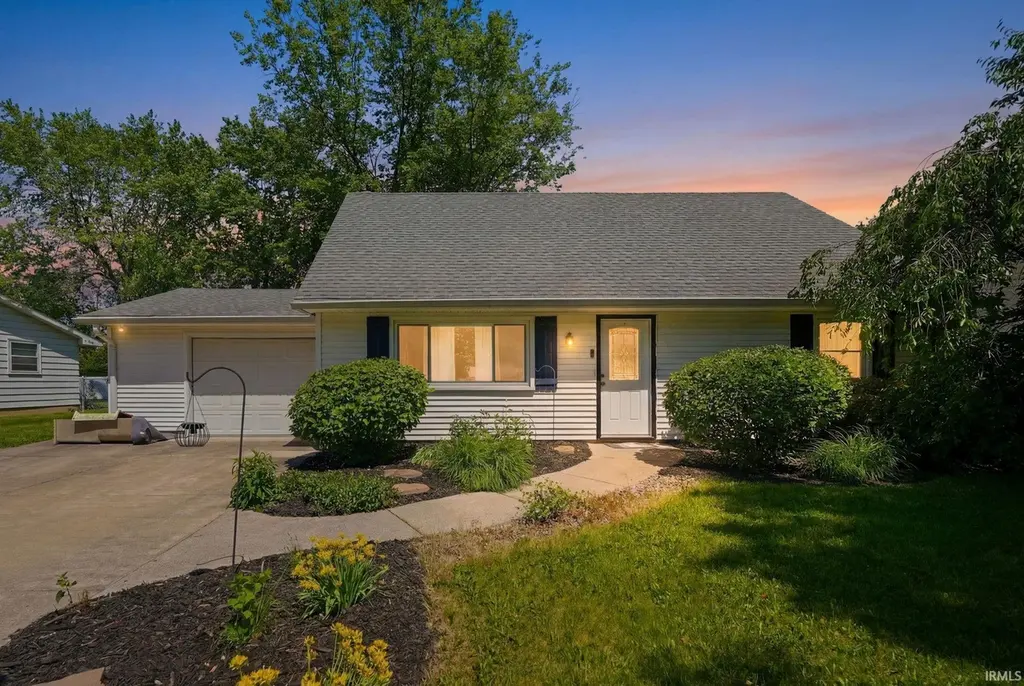
4016 Beaverbrook Dr · Fort Wayne, IN
Flood risk 1/10 · Minimal
- FEMA flood zone
- X (unshaded)
- Chance of flooding over 30 yrs
- 0.0%
- Est. flood insurance / yr
- $507 – $1,088
Fire risk 1/10 · Minimal
- Est. fire insurance / yr
- $717 – $1,331
Heat risk 3/10 · Minor
- Hot days now (above 100°F)
- 7 days/yr
- Hot days in 30 yrs
- 16 days/yr
Wind risk 2/10 · Minimal
- Chance of severe wind over 30 yrs
- —
Air-quality risk 3/10 · Minor
- Unhealthy air days now
- 2 days/yr
- Unhealthy air days in 30 yrs
- 3 days/yr
Risk factors via First Street. Map © Google.
Why this score? — see what drove the D+ grade
The composite is a weighted blend of 9 inputs, each scored 0–100. Each bar is that input's sub-score; the figure is the points it added to the 100-point composite (weight × sub-score).
- Cash flow +15.2/30.0
- ARV discount +10.4/15.0
- DSCR +4.7/10.0
- Livability +4.2/5.0
- 1% rule +3.5/10.0
- Rent growth +2.5/5.0
- Condition / age +2.5/5.0
- Schools +2.2/10.0
- Appreciation +0.0/10.0
$219,900
🖨 Deal sheet (PDF) 📄 Offer letter ✓ Due diligence
Listing remarks MLS
Well maintained, one and a half story home offers 3 bedrooms and 2 full baths, 2 living spaces, a large eat-in kitchen and a split level bedroom plan. Master is on the main level. 2 large bedrooms upstairs with their own bath. 6-panel doors throughout. New roof 2016. New windows in 2008. All electric home with a budget under $200/month! Attic fan is operable and wonderfully cools the home. Large back patio. Vacant lot backs up to the home is not included with this property but it is privately owned and the current owner uses it to throw balls and play with the kids! Appliances stay but not warranted. Generator hook-up in the back of the home. Newer concrete driveway. Nice landscaping with many perennials. Seller says sell!
Key facts
- Open concrete patio
- Firepit
- Landscaped lot
Tags
Property features AI
Finance
- Other: Zoned R1 (residential)
- HOA & community: Homeowners association with an annual fee of $30 (about $2.50/month)
Exterior
- Parking: Attached garage; Garage with garage door opener; Off-street parking; Concrete driveway
- Utilities: Public water; Public sewer
- Home design: Single-family residence; Site-built home; One story
- Construction: Vinyl siding; Asphalt shingle roof; Slab foundation; Concrete perimeter foundation; Built as a residential structure
- Exterior features: Patio; Landscaped lot; Level lot; Wooded lot
Interior
- Kitchen: Microwave; Refrigerator; Electric range
- Bedrooms: Primary bedroom on main level
- Flooring: Carpet; Tile
- Bathrooms: 2 full bathrooms; 1 main-level bathroom
- Heating & cooling: Ceiling heating; Ceiling fans; Attic fan
- Interior features: Ceiling fans; Eat-in kitchen; Primary bedroom on main level; Window treatments; 1 fireplace
- Laundry & utility: Washer hookup (main level); Electric dryer hookup (main level); Washer included; Dryer included
Neighborhood map
What this means for you Summary
Snapshot
- This is a 3-bed/2.0-bath single-family listed at $220k.
Deal economics
- At list price, monthly cash flow is $76 ($915/yr) — positive.
- The deal already cash-flows at list — no discount required.
- To meet the 1% rule (rent ≥ 1% of price), the offer needs to be $186k (15.3% below list).
- Recommended offer: $186k (15.3% below list) — sets the bar for 1% rule.
- Cap rate 6.7% vs local median 4.7% in Fort Wayne — top-decile yield for the area; either an underpriced asset or a hidden risk that comps aren't pricing in. Stress-test before assuming the spread holds.
Location & tenants
- Location reads 84/100 on livability (#6 in IN, #676 nationally) — a professional / high-income tenant draw. Strengths: amenities A+, commute A+, cost of living A+; Watch: crime C-, employment D+.
- Fort Wayne Community Schools (urban): math 22% / reading 29% proficiency, ranked #263 of 301 in IN (top 87%) — low school quality limits family demand, transient renter base, plan for 1-2y turnover; 60% free/reduced lunch — lower-income household profile, screen leases tightly.
- Zoned schools: Glenwood Park Elementary School (math 40% / reading 36%, grade F, #538 of 994 statewide, top 54%, 554 students, 63% FRL); Blackhawk Middle School (math 28% / reading 38%, grade F, #180 of 330 statewide, top 56%, 797 students, 46% FRL); R Nelson Snider High School (math 27% / reading 53%, grade F, #217 of 369 statewide, top 59%, 1,899 students, 50% FRL).
- Market conditions: 104 active listings in the ZIP; 10 comparable units currently listed for rent nearby; rentals lingering (median 46d on market — plan ~5-8 weeks vacancy on turnover, expect pricing pressure); 50% of comp listings sitting > 30 days — soft ceiling on asking rent; 1,861 units permitted in Allen County in 2024 (576 in 5+ unit buildings).
- This rent runs 31% of the median local income ($73k/yr) — at the standard rent-burdened threshold; future hikes will face affordability resistance.
Forward outlook
- Local home prices are declining (-3.0%/yr); year-one equity from $2k of loan paydown is wiped out by about $7k of value loss. Plan a longer hold.
- Allen County population projected at +10% by 2050 — modest demand growth; plan on rents tracking national, not racing it.
Negotiation context
- Only 6 days on market — expect competitive offers; lowballing is unlikely to land.
- 3 sale attempts since 10y ago with the ask held roughly flat each time — persistent listings suggest the price (not the market) is what's stuck; bring a comps-based counter.
- Current owner paid $128k; list at $220k implies a 72% gain — meaningful room to come down on a strong offer.
Questions for the listing agent
- Built in 1968 — when were the roof, HVAC, electrical panel, plumbing, and water heater last replaced?
- What does the HOA fee cover, when was the last increase, and are there any pending special assessments or reserve-fund shortfalls?
- Is there a deadline driving the sale (1031 exchange, divorce, estate, relocation)? That informs how much negotiation room exists.
- Schools are D-rated, which usually means shorter tenancies and higher turnover. Who's the typical renter profile here, and what's been the actual vacancy rate?
- The area grade is low — what's the realistic commute time and amenity access for the typical tenant pool here? Any planned neighborhood developments (good or bad) we should know about?
- What's the average days-on-market for RENTAL listings here right now (not sales)? A rising rental-DOM trend means longer vacancies and softer asking-rent achievability than the comps imply.
- What's the recent tenant-quality profile in this submarket — average credit score on applications, eviction rate, late-payment / NSF rate, and stable-employment percentage? A property-management company in the area should have these aggregated.
- How much new for-sale + rental construction is in the pipeline within 1–3 miles? Heavy new supply typically softens prices + rents 12–24 months out; constrained supply supports both.
Investment metrics
- 1% rule
- 0.85% ✗
- Cap rate
- 6.71%
- Cash-on-cash
- 1.49%
- DSCR
- 1.07
- GRM
- 9.8
CMA / ARV
- ARV (on-the-fly)
- $235,296
- Comps found
- 12
Show comp detail 12 sales within ~0.75 mi
| Address | Dist | Beds/Ba | Sqft | Sold | Price | $/sf | Match |
|---|---|---|---|---|---|---|---|
| 3711 Bobolink Crossover Dr | 0.25mi | 3/2.0 | 1,529 (-1%) | 1mo | $221,750 | $145 | 86 |
| 6508 Birchdale Dr | 0.36mi | 3/1.5 | 1,508 (-3%) | 2mo | $220,000 | $146 | 75 |
| 4619 Rose Hill Ln | 0.50mi | 3/2.0 | 1,582 (+2%) | 1mo | $239,750 | $152 | 72 |
| 6830 Elmbrook Dr | 0.56mi | 3/2.5 | 1,564 (+1%) | 2mo | $230,000 | $147 | 68 |
| 4111 Sandhurst Dr | 0.38mi | 3/2.0 | 1,438 (-7%) | 3mo | $210,000 | $146 | 68 |
| 7101 Piegan Pl | 0.57mi | 3/2.5 | 1,647 (+6%) | 5mo | $224,900 | $137 | 57 |
| 4102 Glenview Ct | 0.58mi | 3/1.5 | 1,444 (-7%) | 5mo | $222,900 | $154 | 56 |
| 4722 Belvidere Dr | 0.62mi | 4/1.5 (+1) | 1,488 (-4%) | 4mo | $225,900 | $152 | 55 |
| 7728 Wishingwell Ct | 0.71mi | 4/1.5 (+1) | 1,584 (+2%) | 2mo | $275,000 | $174 | 54 |
| 4837 Belvidere Dr | 0.67mi | 3/1.5 | 1,462 (-6%) | 6mo | $230,000 | $157 | 52 |
| 4616 Larkspur Dr | 0.51mi | 3/2.0 | 1,320 (-15%) | 1mo | $219,900 | $167 | 51 |
| 3111 Marias Dr | 0.67mi | 3/2.0 | 1,682 (+9%) | 4mo | $240,000 | $143 | 51 |
Match score weights: distance 35% · size 25% · config 20% · recency 20%. Top-matched comps best support the ARV.
Projected returns pro-forma
-3.0% appreciation · 3.0% rent growth · sell at horizon
- IRR
- -14.0%
- Equity multiple
- 0.50×
- Total profit
- $-30,825
- Equity at exit
- $32,788
- IRR
- -5.2%
- Equity multiple
- 0.66×
- Total profit
- $-20,786
- Equity at exit
- $19,013
Cash invested: $61,572 (down + closing). Projections, not guarantees.
Landlord ↔ Tenant lean methodology
- Overall (STATE)
- 90 Strongly Landlord-Friendly
- State Indiana
- 90 Strongly Landlord-Friendly · R+11
- County
- — inherits STATE
- City
- — inherits STATE
ZIP-level market 46815
- Active inventory
- 104
- Price-to-rent
- 9.8×
Monthly cashflow live
- Estimated rent
- $1,862 high interval (Pro) →
- Mortgage (P&I)
- −$1,153
- Tax from tax record
- −$147 /mo · $1,763/yr
- Insurance
- −$92
- HOA
- −$3
- Vacancy / Maint / Mgmt
- −$391
- Net cashflow
- $76
Break-even live
Sensitivity live
| Price | -10% $201 | -5% $138 | +0% $76 | +5% $14 | +10% $-48 |
|---|---|---|---|---|---|
| Rent | -10% $-71 | -5% $3 | +0% $76 | +5% $150 | +10% $223 |
| Rate | -1.0pp $187 | -0.5pp $132 | base $76 | +0.5pp $19 | +1.0pp $-39 |
UW: 25.0% down · 7.5% · 30yr · 1.5% tax · 5.0% vac · 8.0% maint · 8.0% mgmt
Financing live
Cash to close
- Down payment
- $54,975
- Closing costs
- $6,597
- Reserves months
- —
- Total cash needed
- —
Loan-product check · same deal, 3 products live
Conventional
25% down · 7.5% · 30yr
- Down + closing
- —
- Monthly P&I
- —
- Monthly cashflow
- —
- DSCR
- —
- Eligible?
- —
Personal DTI + credit; lowest rate.
DSCR
20% down · 8.5% · 30yr
- Down + closing
- —
- Monthly P&I
- —
- Monthly cashflow
- —
- DSCR
- —
- Eligible?
- —
No personal income docs; deal must DSCR.
Hard money
10% down · 12.0% · 12mo
- Down + closing
- —
- Monthly P&I
- —
- Monthly cashflow
- —
- DSCR
- —
- Eligible?
- —
Short-term bridge; refi at stabilization.
Rent comps 10 comps
| Address | Beds | Baths | Sqft | Rent | $/sqft | DOM | Units | Dist |
|---|---|---|---|---|---|---|---|---|
| 3226 Arrowwood Dr Fort Wayne, IN | 4.0 | 2.0 | 2096 | $1,949 | $0.93 | 45d | 1 | 0.55mi |
| 4725 Maple Terrace Pkwy Fort Wayne, IN | 4.0 | 2.0 | 2068 | $2,200 | $1.06 | 15d | 1 | 0.58mi |
| 3010 Simcoe Dr Fort Wayne, IN | 1.0–3.0 | 1.0–2.5 | 940 | $1,609 | $1.71 | 15d | 10 | 0.82mi |
| 5450 Kinzie Ct Fort Wayne, IN | 2.0 | 2.0 | 1294 | $1,992 | $1.54 | 15d | 2 | 1.21mi |
| 1919 Bear Paw Dr Fort Wayne, IN | 4.0 | 3.0 | 1792 | $1,950 | $1.09 | 15d | 1 | 1.26mi |
| 3212 W Bartlett Dr Fort Wayne, IN | 2.0 | 2.0 | 1289 | $2,250 | $1.75 | 45d | 1 | 1.38mi |
| 3215 W Bartlett Dr Fort Wayne, IN | 2.0 | 2.0 | 1464 | $2,380 | $1.63 | 45d | 1 | 1.40mi |
| 3213 W Bartlett Dr Fort Wayne, IN | 2.0 | 2.0 | 1445 | $2,250 | $1.56 | 45d | 1 | 1.41mi |
| 5271 Eastwick Dr Fort Wayne, IN | 2.0 | 2.0 | 1050 | $900 | $0.86 | 45d | 1 | 1.50mi |
| 5271 Eastwick Dr Fort Wayne, IN | 2.0 | 1.0–2.0 | 925 | $875 | $0.95 | 15d | 4 | 1.50mi |
HOA detail
- Monthly dues
- $3 · $36/yr
- Likely covers
- electriclandscaping
Listing history 5 events
-
2026-06-10status $219,900 Pending 6 DOM
-
2026-06-09days on market $219,900 Active 6 DOM
-
2026-06-08days on market $219,900 Active 5 DOM
-
2026-06-07remarks 699-char remark
-
2026-06-07$219,900 Active 4 DOM
ⓘ Source: listings_history table (triggers on properties + properties_extension) + one-shot
backfill from property_details.listing_events for pre-trigger history.
Tax reassessment forecast IN · Partial reset (capped growth)
- Current annual tax
- $1,763 · $147/mo
- Projected year-2 tax
- $1,816 · $151/mo
- Expected delta
- +$53/yr (+$4/mo · 3.0%)
ⓘ Screening estimate from a state-policy table — verify with the county assessor before closing.
Climate risk First Street
- Flood 1/10 Low FEMA zone X (unshaded) · 0% chance over 30 yrs
- Wildfire 1/10 Low
- Heat 3/10 Moderate 7 d/yr ≥100°F today · 16 d/yr by 30 yrs out
- Wind 2/10 Low
- Air quality 3/10 Moderate 2 unhealthy d/yr today · 3 by 30 yrs out
Nearby sold comps map
Loading sold comps map…
Walkable amenities ~0.75 mi
Loading nearby amenities…
Taxation est. · year 1
- Rental income
- $22,344
- − Mortgage interest
- −$12,318
- − Property taxes
- −$1,763
- − Insurance
- −$1,100
- − Repairs & maintenance
- −$1,788
- − Management
- −$1,788
- − HOA
- −$36
- − Depreciation
- −$6,397
- Taxable loss
- −$2,844
- Est. tax savings @ 24.0%
- +$683
- After-tax cash flow
- $1,598/yr
For passive investors: Depreciation is non-cash, so a rental often shows a tax loss while cash-flowing — sheltering income. Rental losses are passive: they offset passive income freely, and up to $25,000/yr can offset ordinary (W-2) income if you actively participate and your MAGI is under $100k (phasing out to $0 by $150k); unused losses carry forward. On sale, claimed depreciation is recaptured at up to 25%, and gains may owe capital-gains tax (a 1031 exchange can defer both). Figures are a year-1 estimate at your 24.0% rate — not tax advice; consult a CPA.
Schools (NCES district)
- District
- Fort Wayne Community Schools
- NCES district ID
- 1803630
- Math proficiency
- 22% ▼ -11.00%
- Reading proficiency
- 29% ▼ -7.00%
- Median HH income
- $41,951
- Composite
- 21.68/100
- National rank
- #8275
- State rank
- #263 of 301 in IN
Livability — Fort Wayne
- Score
- 84/100
- State rank
- #6
- US rank
- #676
Category grades
Schools grade is shown separately in the Schools card above.
Census & demographics
- Census place
- Fort Wayne, IN
- County
- Allen County · 326,813 people
- City population
- 326,813
- Metro
- Fort Wayne, IN
- Population (ZIP)
- 27,238
- Household income
- $73,239
- Rent vs Own
- Severe rent burden
- 604.0
Population outlook (Allen County) Hauer SSP2
- Today (2025)
- 394,020 people
- By 2030
- 405,128 · +2.8%
- By 2040
- 423,476 · +7.5%
- By 2050
- 435,137 · +10.4%
- By 2075
- 450,293 · +14.3%
- By 2100
- 424,101 · +7.6%
Race, ethnicity, and origin ACS 2023
- Neighborhood character
- Predominantly White (78%)
- Race & ethnicity
- White 78% Black 9% Two or more races 7% Asian 5% Hispanic / Latino 4%
- Common ancestry
- Italian 2% Lithuanian 2% Romanian 2%
- Foreign-born
- 4% · Philippines, Canada
- Languages at home
- 93% English-only · Other Asian/Pacific 4% Spanish 1% Other Indo-European 1%
Political lean MEDSL · Allen
- 2024 margin
- R (+12.5) · D 42.9% · R 55.4% · Other 1.7%
- 2008→2024 swing
- -8.1pp toward R · 2008: -4.3pp · 2024: -12.5pp
- All cycles
- 2024: R+12.5 2020: R+11.2 2016: R+19.6 2012: R+16.8 2008: R+4.3
Not yet ingested
- Civics
- —
Market trends
- HPI YoY
- ▼ -219.81%
- Current HPI
- 245.2095
- Rent YoY
- —
- Metro
- Fort Wayne, IN
- State GDP YoY
- ▲ 2.90%
- F500 in state
- 18
Industry mix (Fortune 500 HQ in IN)
| Industry | F500 HQs | Revenue |
|---|---|---|
| Industrial Machinery | 2 | $37B |
|
||
| Healthcare | 1 | $177B |
|
||
| Pharmaceuticals | 1 | $45B |
|
||
| Metals / Steel | 1 | $18B |
|
||
| Agriculture | 1 | $17B |
|
||
| Packaging | 1 | $12B |
|
||
Price history
+124.6% since first listed5 events — show timeline
- 2026-06-04 Listed $219,900 IRMLS
- 2019-11-12 Sold (MLS) $127,900 IRMLS
- 2019-08-21 Listed $124,900 IRMLS
- 2016-05-09 Sold (MLS) $95,000 IRMLS
- 2016-04-04 Listed $97,900 IRMLS
Property tax history
+7.0%/yrLatest (2024): $1,763 · +11.2% YoY. Source: county tax records.
Cash-flow waterfall
monthlySold comps — $/sqft
last 12 mo · ≤1 miLoading sold comps…