 🏗️ New Construction
3411 Stonewall St · Houston, TX
Flood risk No data
- FEMA flood zone
- —
- Chance of flooding over 30 yrs
- —
- Est. flood insurance / yr
- —
Fire risk No data
- Est. fire insurance / yr
- —
Heat risk No data
- Hot days now (above threshold)
- —
- Hot days in 30 yrs
- —
Wind risk No data
- Chance of severe wind over 30 yrs
- —
Air-quality risk No data
- Unhealthy air days now
- —
- Unhealthy air days in 30 yrs
- —
Risk factors via First Street. Map © Google.
Why this score? — see what drove the D+ grade
The composite is a weighted blend of 9 inputs, each scored 0–100. Each bar is that input's sub-score; the figure is the points it added to the 100-point composite (weight × sub-score).
- Appreciation +10.0/10.0
- Cash flow +9.4/30.0
- ARV discount +7.5/15.0
- Condition / age +4.8/5.0
- Livability +3.7/5.0
- Rent growth +3.6/5.0
- 1% rule +3.1/10.0
- Schools +2.7/10.0
- DSCR +2.6/10.0
$359,000
🖨 Deal sheet (PDF) 📄 Offer letter ✓ Due diligence
Listing remarks
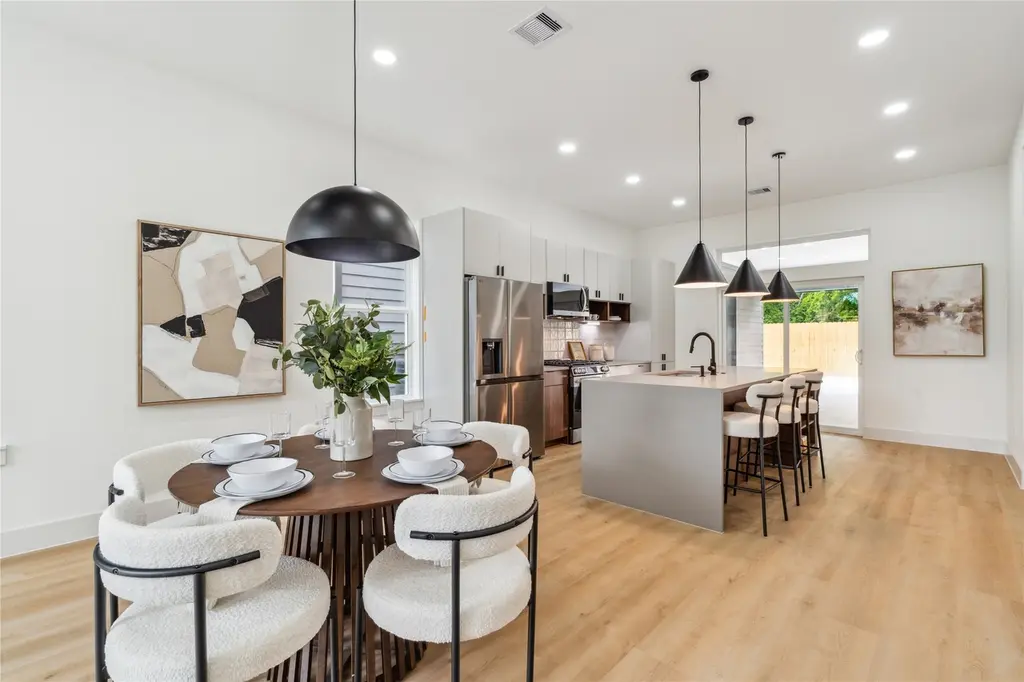
Vecino Homes presents a unique, privately gated community in Fifth Ward featuring 6 homes with only 1 remaining, designed by Viarq Designers just a stone’s throw from East River and all that Downtown has to offer. 1ST living with a 2 story foyer entry and an open layout with chefs kitchen with state-of-the-art stainless appliances, a large island, and new two-tone soft-close cabinetry. Sliding glass doors lead to an oversized fully enclosed garage with brand new garage doors designed with flexibility to double as outdoor space. Upstairs, all bedrooms offer privacy and comfort, spacious primary suite with dual sinks, European bath with standalone tub, oversized shower, extended shampoo
Key facts
- Large island
- Outdoor space
- Chefs kitchen
Tags
Property features AI
Finance
- HOA & community: Homeowners association with a monthly fee of $75 (association name TBD)
Exterior
- Parking: Attached oversized garage with 2 spaces
- Security: Prewired for security; Smoke detectors
- Utilities: Public water; Public sewer
- Home design: Residential property; New construction; Built in 2025; Slab foundation; Composition roof
- Construction: Cement siding; Vecino Homes builder
- Exterior features: Covered patio; Covered porch; Patio; Deck; Partial fencing; Located in a subdivision; Concrete road surface
Interior
- Kitchen: Dishwasher; Electric cooktop; Electric oven; Microwave; Garbage disposal; Kitchen island; Quartz counters; Walk-in pantry
- Bedrooms: Primary bedroom on second floor; Second-floor bedrooms (2 additional bedrooms)
- Flooring: Plank flooring; Tile; Vinyl
- Bathrooms: 2 full bathrooms; 1 half bathroom; Primary bathroom on second floor
- Heating & cooling: Central heating (electric); Central air (electric)
- Interior features: Entrance foyer; High ceilings; Kitchen island; Quartz countertops; Self-closing cabinet doors; Soaking tub; Walk-in pantry; Ceiling fans; Low emissivity windows
- Laundry & utility: Washer hookup; Electric dryer hookup; Second-floor utility room
Neighborhood map
What this means for you Summary
Snapshot
- This is a 3-bed/2.5-bath single-family listed at $359k. Condition is rated excellent.
Deal economics
- At list price, monthly cash flow is $-247 ($-3k/yr) — negative.
- To cash-flow at today's rent, offer at most $300k (16.4% below list).
- To meet the 1% rule (rent ≥ 1% of price), the offer needs to be $278k (22.5% below list).
- Recommended offer: $278k (22.5% below list) — sets the bar for 1% rule.
- Cap rate 5.4% vs local median 3.2% in Houston — top-decile yield for the area; either an underpriced asset or a hidden risk that comps aren't pricing in. Stress-test before assuming the spread holds.
Location & tenants
- Location reads 74/100 on livability (#184 in TX, #4,771 nationally) — a middle-class / working-renter tenant base. Strengths: amenities A+, cost of living A+, housing A+; Watch: crime F.
- Houston ISD (urban): math 27% / reading 35% proficiency, ranked #593 of 826 in TX (top 72%) — families likely to look elsewhere, expect single-tenant / working-renter base with shorter leases; 71% free/reduced lunch — lower-income household profile, screen leases tightly.
- Zoned schools: Atherton El (math 8% / reading 22%, grade F, #4,021 of 4,322 statewide, top 94%, 433 students, 96% FRL); Fleming Middle (math 10% / reading 15%, grade F, #1,616 of 1,662 statewide, top 97%, 384 students, 97% FRL); Wheatley H S (math 17% / reading 19%, grade F, #1,445 of 1,632 statewide, top 89%, 643 students, 95% FRL) — zoned schools average 96% FRL vs 71% district-wide (25 pts higher); higher-poverty schools than district average — tighter screening recommended.
- Zoned-school proficiency averages 15% at this address vs 31% district-wide (-16 pts) — the specific schools serving this property underperform the Houston ISD average; the district grade overstates school quality for this exact location.
- Market conditions: Rents rising fast (+4.3%/yr); 339 active listings in the ZIP; 18 comparable units currently listed for rent nearby; rentals at typical pace (median 14d on market — plan ~3-4 weeks tenant-placement turnaround); 44% of comp listings sitting > 30 days — soft ceiling on asking rent; 29,883 units permitted in Harris County in 2024 (8,621 in 5+ unit buildings).
- At $2,782/mo this rent would consume 67% of the median local household income ($50k/yr) (locally 969% of renters already pay >50% of income on rent) — very limited rent-growth headroom before tenants either downsize or default.
Forward outlook
- In year one you build about $37k of equity ($2k loan paydown + $34k appreciation (10.0% local appreciation)).
- Harris County population projected at +47% by 2050 — long-run rental-demand tailwind backs the buy-and-hold thesis.
- By year 2, paydown + projected appreciation supports a ~$59k cash-out refi (75% LTV) — recoverable capital for the next deal without selling this one.
Negotiation context
- It's been on market 45 days — a 3% lower offer ($348k) is reasonable based on typical stale-listing flexibility.
Questions for the listing agent
- What do current leases actually rent for vs. the listed asking? Can we see a recent rent roll and the last 12 months of T-12 income?
- It's been on market 45 days. Have you received any prior offers? Is the seller open to a 23% concession, seller financing, or rate buy-down credit?
- What does the HOA fee cover, when was the last increase, and are there any pending special assessments or reserve-fund shortfalls?
- Is there a deadline driving the sale (1031 exchange, divorce, estate, relocation)? That informs how much negotiation room exists.
- Schools are D-rated, which usually means shorter tenancies and higher turnover. Who's the typical renter profile here, and what's been the actual vacancy rate?
- Crime grade is F in this area — have there been break-ins, vandalism, or insurance claims at this property in the last 3 years? What carrier currently insures it and at what premium?
- The area grade is low — what's the realistic commute time and amenity access for the typical tenant pool here? Any planned neighborhood developments (good or bad) we should know about?
- What's the average days-on-market for RENTAL listings here right now (not sales)? A rising rental-DOM trend means longer vacancies and softer asking-rent achievability than the comps imply.
- What's the recent tenant-quality profile in this submarket — average credit score on applications, eviction rate, late-payment / NSF rate, and stable-employment percentage? A property-management company in the area should have these aggregated.
- How much new for-sale + rental construction is in the pipeline within 1–3 miles? Heavy new supply typically softens prices + rents 12–24 months out; constrained supply supports both.
Investment metrics
- 1% rule
- 0.81% ✗
- Cap rate
- 5.43%
- Cash-on-cash
- -3.08%
- DSCR
- 0.86
- GRM
- 10.3
CMA / ARV
- ARV (median comp)
- $343,861
- List price
- $359,000
- Delta
- 4.40%
- Verdict
- FAIR
- Comps
- 20 within 1.0 mi
Show comp detail 12 sales within ~0.75 mi
| Address | Dist | Beds/Ba | Sqft | Sold | Price | $/sf | Match |
|---|---|---|---|---|---|---|---|
| 3415 Stonewall St | 0.01mi | 3/2.5 | 1,969 (-12%) | 1mo | $369,000 | $187 | 78 |
| 3409 Stonewall St | 0.00mi | 3/2.5 | 1,969 (-12%) | 1mo | $349,900 | $178 | 78 |
| 3306 Cline St | 0.48mi | 3/3.5 | 2,154 (-4%) | 1mo | $390,000 | $181 | 66 |
| 3209 Baer St Unit B | 0.38mi | 3/3.5 | 1,996 (-11%) | 1mo | $464,900 | $233 | 58 |
| 3209 Baer St Unit A | 0.38mi | 3/3.5 | 1,990 (-12%) | 1mo | $464,900 | $234 | 58 |
| 2808 Mills St | 0.47mi | 3/3.5 | 2,039 (-9%) | 1mo | $359,000 | $176 | 58 |
| 2804 Mills St | 0.47mi | 3/3.5 | 2,039 (-9%) | 1mo | $379,000 | $186 | 58 |
| 2814 Mills St | 0.47mi | 3/3.5 | 1,972 (-12%) | 1mo | $389,900 | $198 | 53 |
| 2812 Mills St | 0.46mi | 3/3.5 | 1,972 (-12%) | 1mo | $369,900 | $188 | 53 |
| 4439 Gunter St | 0.68mi | 3/2.5 | 2,027 (-10%) | 2mo | $325,000 | $160 | 50 |
| 4441 Gunter St | 0.68mi | 3/2.5 | 2,027 (-10%) | 2mo | $329,000 | $162 | 50 |
| 4430 Edmund St | 0.74mi | 3/3.5 | 2,023 (-10%) | 2mo | $394,990 | $195 | 43 |
Match score weights: distance 35% · size 25% · config 20% · recency 20%. Top-matched comps best support the ARV.
Projected returns pro-forma
10.0% appreciation · 4.27% rent growth · sell at horizon
- IRR
- 22.5%
- Equity multiple
- 2.82×
- Total profit
- $175,220
- Equity at exit
- $309,777
- IRR
- 20.5%
- Equity multiple
- 6.57×
- Total profit
- $536,231
- Equity at exit
- $668,047
Cash invested: $96,281 (down + closing). Projections, not guarantees.
Landlord ↔ Tenant lean methodology
- Overall (STATE)
- 87 Strongly Landlord-Friendly
- State Texas
- 87 Strongly Landlord-Friendly · R+5
- County
- — inherits STATE
- City
- — inherits STATE
ZIP-level market 77020
- Home prices YoY
- 29.1%
- Rents YoY
- 4.3%
- Active inventory
- 339
- Price-to-rent
- 10.8×
Monthly cashflow live
- Estimated rent
- $2,782 high interval (Pro) →
- Mortgage (P&I)
- −$1,803
- Tax from tax record
- −$423 /mo · $5,081/yr
- Insurance
- −$143
- HOA
- −$75
- Vacancy / Maint / Mgmt
- −$584
- Net cashflow
- $-247
Break-even live
Sensitivity live
| Price | -10% $-52 | -5% $-150 | +0% $-247 | +5% $-344 | +10% $-442 |
|---|---|---|---|---|---|
| Rent | -10% $-467 | -5% $-357 | +0% $-247 | +5% $-137 | +10% $-27 |
| Rate | -1.0pp $-74 | -0.5pp $-160 | base $-247 | +0.5pp $-336 | +1.0pp $-427 |
UW: 25.0% down · 7.5% · 30yr · 1.5% tax · 5.0% vac · 8.0% maint · 8.0% mgmt
Financing live
Cash to close
- Down payment
- $85,965
- Closing costs
- $10,316
- Reserves months
- —
- Total cash needed
- —
Loan-product check · same deal, 3 products live
Conventional
25% down · 7.5% · 30yr
- Down + closing
- —
- Monthly P&I
- —
- Monthly cashflow
- —
- DSCR
- —
- Eligible?
- —
Personal DTI + credit; lowest rate.
DSCR
20% down · 8.5% · 30yr
- Down + closing
- —
- Monthly P&I
- —
- Monthly cashflow
- —
- DSCR
- —
- Eligible?
- —
No personal income docs; deal must DSCR.
Hard money
10% down · 12.0% · 12mo
- Down + closing
- —
- Monthly P&I
- —
- Monthly cashflow
- —
- DSCR
- —
- Eligible?
- —
Short-term bridge; refi at stabilization.
Rent comps 18 comps
| Address | Beds | Baths | Sqft | Rent | $/sqft | DOM | Units | Dist |
|---|---|---|---|---|---|---|---|---|
| 1303 Bayou St Unit C Houston, TX | 3.0 | 3.0 | 1869 | $3,200 | $1.71 | 45d | 1 | 0.17mi |
| 1307 Bayou St Unit B Houston, TX | 3.0 | 3.0 | 1814 | $2,400 | $1.32 | 9d | 1 | 0.18mi |
| 3410 Baer St Houston, TX | 3.0 | 4.0 | 2040 | $3,500 | $1.72 | 45d | 1 | 0.36mi |
| 3419 Gillespie St Houston, TX | 3.0 | 3.5 | 2168 | $2,300 | $1.06 | 45d | 1 | 0.38mi |
| 4109 Hare St Unit 1019559P Houston, TX | 4.0 | 2.5 | 1905 | $6,852 | $3.60 | 9d | 1 | 0.39mi |
| 4109 Hare St Unit A Houston, TX | 4.0 | 2.5 | 1913 | $6,950 | $3.63 | 45d | 1 | 0.39mi |
| 611 Sydnor St Houston, TX | 3.0 | 4.0 | 2157 | $2,400 | $1.11 | 45d | 1 | 0.43mi |
| 2905 Baer St Unit 1047953P Houston, TX | 3.0 | 2.5 | 1991 | $2,922 | $1.47 | 0d | 1 | 0.47mi |
| 308 Grove St Houston, TX | 3.0 | 3.0 | 1701 | $2,350 | $1.38 | 9d | 1 | 0.50mi |
| 1222 Upton St Houston, TX | 3.0 | 4.0 | 2055 | $2,600 | $1.27 | 45d | 1 | 0.61mi |
| 4706 Hershe St Houston, TX | 3.0 | 2.5 | 2283 | $3,300 | $1.45 | 45d | 1 | 0.81mi |
| 2115 Runnels St Unit 3187 Houston, TX | 3.0 | 2.0 | 1839 | $3,005 | $1.63 | 0d | 1 | 1.10mi |
| 2115 Runnels St Unit 3174 Houston, TX | 3.0 | 2.0 | 1839 | $3,056 | $1.66 | 0d | 1 | 1.10mi |
| 2115 Runnels St Unit 3174 Houston, TX | 3.0 | 2.0 | 1839 | $3,056 | $1.66 | 14d | 1 | 1.10mi |
| 2115 Runnels St Unit 2148 Houston, TX | 3.0 | 2.0 | 1839 | $3,045 | $1.66 | 13d | 1 | 1.10mi |
| 5217 Noble St Houston, TX | 3.0 | 2.5 | 1897 | $2,750 | $1.45 | 45d | 1 | 1.16mi |
| 2414 East Dr Unit Canal St unit Houston, TX | 3.0 | 3.5 | 2063 | $2,950 | $1.43 | 9d | 1 | 1.27mi |
| 15 N Chenevert St Houston, TX | 2.0 | 1.0–2.0 | 1351 | $4,000 | $2.96 | 0d | 16 | 1.36mi |
HOA detail
- Monthly dues
- $75 · $900/yr
- Likely covers
- security
Listing history 13 events
-
2026-06-21days on market $359,000 Active 45 DOM
-
2026-06-18days on market $359,000 Active 42 DOM
-
2026-06-17days on market $359,000 Active 41 DOM
-
2026-06-16days on market $359,000 Active 40 DOM
-
2026-06-15days on market $359,000 Active 39 DOM
-
2026-06-13days on market $359,000 Active 37 DOM
-
2026-06-10days on market $359,000 Active 33 DOM
-
2026-06-08days on market $359,000 Active 32 DOM
-
2026-06-07days on market $359,000 Active 31 DOM
-
2026-06-04days on market $359,000 Active 28 DOM
-
2026-06-01days on market $359,000 Active 25 DOM
-
2026-05-31days on market $359,000 Active 24 DOM
-
2026-05-07$359,000 Active 871-char remark
ⓘ Source: listings_history table (triggers on properties + properties_extension) + one-shot
backfill from property_details.listing_events for pre-trigger history.
Tax reassessment forecast TX · Resets to sale price
- Current annual tax
- $5,081 · $423/mo
- Projected year-2 tax
- $6,570 · $547/mo
- Expected delta
- +$1,489/yr (+$124/mo · 29.3%)
ⓘ Screening estimate from a state-policy table — verify with the county assessor before closing.
Nearby sold comps map
Loading sold comps map…
Walkable amenities ~0.75 mi
Loading nearby amenities…
Taxation est. · year 1
- Rental income
- $33,384
- − Mortgage interest
- −$19,262
- − Property taxes
- −$5,081
- − Insurance
- −$1,719
- − Repairs & maintenance
- −$2,671
- − Management
- −$2,671
- − HOA
- −$900
- − Depreciation
- −$10,003
- Taxable loss
- −$8,922
- Est. tax savings @ 24.0%
- +$2,141
- After-tax cash flow
- $-824/yr
For passive investors: Depreciation is non-cash, so a rental often shows a tax loss while cash-flowing — sheltering income. Rental losses are passive: they offset passive income freely, and up to $25,000/yr can offset ordinary (W-2) income if you actively participate and your MAGI is under $100k (phasing out to $0 by $150k); unused losses carry forward. On sale, claimed depreciation is recaptured at up to 25%, and gains may owe capital-gains tax (a 1031 exchange can defer both). Figures are a year-1 estimate at your 24.0% rate — not tax advice; consult a CPA.
Condition & rehab AI · 6 photos
This property is in excellent condition with a modern design and well-maintained features. It offers a great opportunity for investors looking to purchase a move-in-ready home in a desirable location.
Value-add opportunities
- Both Landscaping improvements — Enhances curb appeal and adds value to the property.
- Both Painting exterior — Fresh paint can make the home look more appealing and increase its value.
- Both Landscaping and curb appeal — Improves the overall aesthetic and can attract more potential buyers or renters.
Renovation cost estimate screening
Value-add ROI direction
- Both Landscaping improvements — Enhances curb appeal and adds value to the property. ↑
- Both Painting exterior — Fresh paint can make the home look more appealing and increase its value. ↑
- Both Landscaping and curb appeal — Improves the overall aesthetic and can attract more potential buyers or renters. ↑
ⓘ Cost ranges are severity-bucket heuristics (US national rule-of-thumb). Get contractor quotes + a written scope before underwriting a rehab budget.
Schools (NCES district)
- District
- Houston ISD
- NCES district ID
- 4823640
- Math proficiency
- 27% ▼ -18.00%
- Reading proficiency
- 35% ▼ -6.00%
- Median HH income
- $46,054
- Composite
- 26.63/100
- National rank
- #7173
- State rank
- #593 of 826 in TX
Livability — Houston
- Score
- 74/100
- State rank
- #184
- US rank
- #4771
Category grades
Schools grade is shown separately in the Schools card above.
Census & demographics
- Census place
- Houston, TX
- County
- Harris County · 4,702,590 people
- City population
- 3,226,434
- Metro
- Houston-The Woodlands-Sugar Land, TX
- Population (ZIP)
- 23,686
- Household income
- $50,119
- Rent vs Own
- Severe rent burden
- 969.0
Population outlook (Harris County) Hauer SSP2
- Today (2025)
- 5,571,493 people
- By 2030
- 6,089,821 · +9.3%
- By 2040
- 7,142,806 · +28.2%
- By 2050
- 8,185,864 · +46.9%
- By 2075
- 10,574,329 · +89.8%
- By 2100
- 12,109,958 · +117.4%
Race, ethnicity, and origin ACS 2023
- Neighborhood character
- Predominantly Hispanic (69%)
- Race & ethnicity
- Hispanic / Latino 69% Black 24% Two or more races 22% White 5% Asian 1%
- Hispanic origin (detail)
- Mexican 60%
- Common ancestry
- Swiss 1%
- Foreign-born
- 23% · Canada
- Languages at home
- 39% English-only · Spanish 59% Other Indo-European 1%
Political lean MEDSL · Harris
- 2024 margin
- Lean D (+5.5) · D 52.0% · R 46.4% · Other 1.6%
- 2008→2024 swing
- +3.9pp toward D · 2008: 1.6pp · 2024: 5.5pp
- All cycles
- 2024: D+5.5 2020: D+13.3 2016: D+12.4 2012: D+0.1 2008: D+1.6
Not yet ingested
- Civics
- —
Market trends
- HPI YoY
- ▲ 55.64%
- Current HPI
- 246.5578
- Rent YoY
- ▲ 4.27%
- Metro
- Houston-The Woodlands-Sugar Land, TX
- State GDP YoY
- ▲ 3.95%
- F500 in state
- 110
Industry mix (Fortune 500 HQ in TX)
| Industry | F500 HQs | Revenue |
|---|---|---|
| Energy | 16 | $1,198B |
|
||
| Technology | 5 | $198B |
|
||
| Engineering / Construction | 4 | $72B |
|
||
| Energy Services | 3 | $60B |
|
||
| Utilities | 3 | $41B |
|
||
| Healthcare | 2 | $330B |
|
||
Price history
1 event — show timeline
- 2026-05-07 Listed $359,000 HARMLS
Cash-flow waterfall
monthlySold comps — $/sqft
last 12 mo · ≤1 miLoading sold comps…