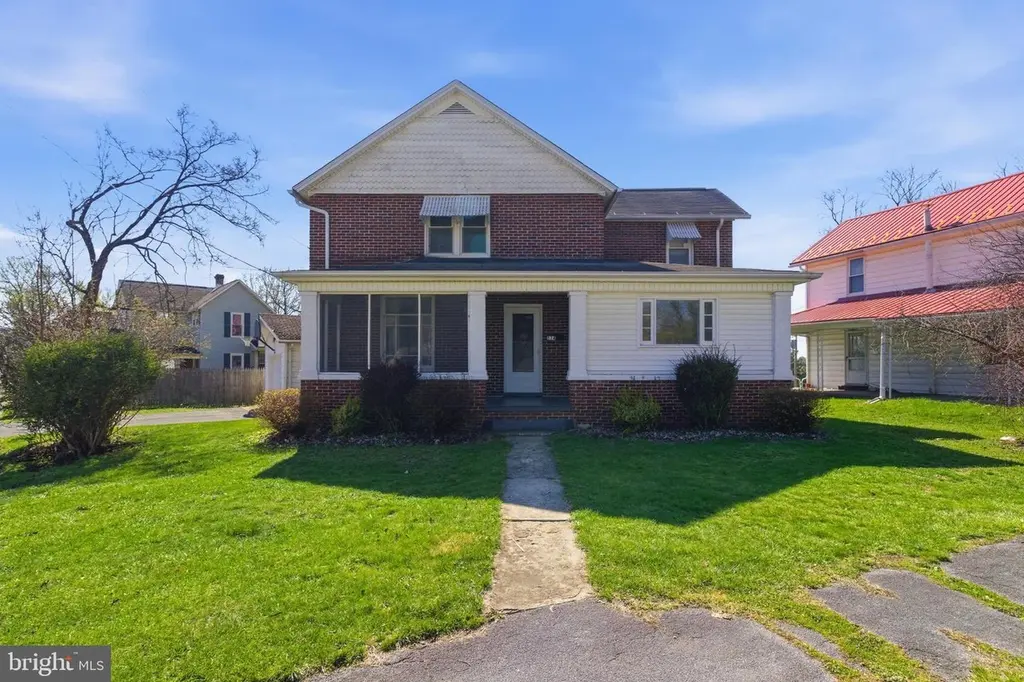
224 E Weber Ave · DuBois, PA
Flood risk 1/10 · Minimal
- FEMA flood zone
- X (unshaded)
- Chance of flooding over 30 yrs
- 0.0%
- Est. flood insurance / yr
- $473 – $860
Fire risk 1/10 · Minimal
- Est. fire insurance / yr
- $511 – $949
Heat risk 3/10 · Minor
- Hot days now (above 93°F)
- 7 days/yr
- Hot days in 30 yrs
- 18 days/yr
Wind risk 2/10 · Minimal
- Chance of severe wind over 30 yrs
- —
Air-quality risk 2/10 · Minimal
- Unhealthy air days now
- 1 days/yr
- Unhealthy air days in 30 yrs
- 2 days/yr
Risk factors via First Street. Map © Google.
Why this score? — see what drove the D grade
The composite is a weighted blend of 9 inputs, each scored 0–100. Each bar is that input's sub-score; the figure is the points it added to the 100-point composite (weight × sub-score).
- Appreciation +10.0/10.0
- Cash flow +7.9/30.0
- ARV discount +7.5/15.0
- Livability +4.0/5.0
- Schools +3.9/10.0
- Rent growth +2.5/5.0
- Condition / age +2.5/5.0
- DSCR +1.9/10.0
- 1% rule +1.7/10.0
$175,000
🖨 Deal sheet 📄 Offer letter ✓ Due diligence
Listing remarks
This spacious 4 bedroom, 1 ½ bath home offers 2,208 ft² of comfortable living on a desirable corner lot in DuBois! Featuring large living, dining, and family room areas, there’s plenty of space to relax or entertain. The beautiful kitchen with tile flooring and granite countertops are a nice bonus. Enjoy the finished basement for added versatility, along with fresh updates throughout and major mechanical upgrades completed in recent years for peace of mind. Stay comfortable year-round with central air and efficient natural gas heat. Outside, the easily maintainable yard includes an above-ground pool and a large deck, perfect for summer gatherings, plus the convenience of a
Key facts
- 8,276 sq ft lot
- Garage
- Pool
Property features AI
Exterior
- Parking: Detached front-entry garage (1 garage space); Asphalt driveway with 1 driveway space; Total of 2 parking spaces
- Utilities: Public water; Public sewer; Electric cooling; Natural gas for heating and hot water
- Home design: Detached property; Shingle roof; Brick and stick-built construction
- Construction: Block foundation; Built with brick and stick framing
- Exterior features: Chain link fencing; Above-ground personal pool
Interior
- Kitchen: Single oven; Microwave
- Bedrooms: Four bedrooms on the upper level
- Bathrooms: One full bathroom (upper level); One half bathroom (main level)
- Heating & cooling: Forced air heating; Natural gas heating and hot water; Central air conditioning (electric)
- Interior features: Oven - Single; Microwave; Full basement, partially finished; Estimated living area
- Laundry & utility: Main floor laundry
Neighborhood map
What this means for you Summary
Snapshot
- This is a 4-bed/1.5-bath other listed at $175k.
Deal economics
- At list price, monthly cash flow is $-190 ($-2k/yr) — negative.
- To cash-flow at today's rent, offer at most $141k (19.2% below list).
- To meet the 1% rule (rent ≥ 1% of price), the offer needs to be $118k (32.5% below list).
- Recommended offer: $118k (32.5% below list) — sets the bar for 1% rule.
Location & tenants
- Location reads 81/100 on livability (#165 in PA, #1,370 nationally) — a professional / high-income tenant draw. Strengths: amenities A+, cost of living A+, housing A+; Watch: employment D+, commute F.
- Dubois Area SD (town): math 38% / reading 55% proficiency, ranked #262 of 539 in PA (top 49%) — families likely to look elsewhere, expect single-tenant / working-renter base with shorter leases.
- Market conditions: 41 active listings in the ZIP; 99 units permitted in Clearfield County in 2024 (10 in 5+ unit buildings).
Forward outlook
- In year one you build about $19k of equity ($1k loan paydown + $18k appreciation (10.0% local appreciation)).
- Clearfield County population projected at -12% by 2050 — secular population decline; favor cash flow + early exit over multi-decade hold.
- By year 2, paydown + projected appreciation supports a ~$30k cash-out refi (75% LTV) — recoverable capital for the next deal without selling this one.
Negotiation context
- It's been on market 16 days — a 2% lower offer ($172k) is reasonable based on typical stale-listing flexibility.
- Current owner paid $120k; 46% above their basis — modest negotiation headroom, anchor on the comps not their cost.
Risks & watch-outs
- Watch-outs: built in 1925 — expect roof / HVAC / electrical / plumbing capex.
Questions for the listing agent
- What do current leases actually rent for vs. the listed asking? Can we see a recent rent roll and the last 12 months of T-12 income?
- Built in 1925 — when were the roof, HVAC, electrical panel, plumbing, and water heater last replaced?
- Is there a deadline driving the sale (1031 exchange, divorce, estate, relocation)? That informs how much negotiation room exists.
- Schools are A-rated — typically a magnet for longer-tenancy family renters. What's the average tenant stay here, and is there a school-zone premium baked into asking?
- The area grade is low — what's the realistic commute time and amenity access for the typical tenant pool here? Any planned neighborhood developments (good or bad) we should know about?
- What's the average days-on-market for RENTAL listings here right now (not sales)? A rising rental-DOM trend means longer vacancies and softer asking-rent achievability than the comps imply.
- What's the recent tenant-quality profile in this submarket — average credit score on applications, eviction rate, late-payment / NSF rate, and stable-employment percentage? A property-management company in the area should have these aggregated.
- How much new for-sale + rental construction is in the pipeline within 1–3 miles? Heavy new supply typically softens prices + rents 12–24 months out; constrained supply supports both.
Investment metrics
- 1% rule
- 0.67% ✗
- Cap rate
- 4.99%
- Cash-on-cash
- -4.66%
- DSCR
- 0.79
- GRM
- 12.4
CMA / ARV
No comps found within radius.
Projected returns pro-forma
10.0% appreciation · 3.0% rent growth · sell at horizon
- IRR
- 21.0%
- Equity multiple
- 2.70×
- Total profit
- $83,143
- Equity at exit
- $157,654
- IRR
- 19.0%
- Equity multiple
- 6.19×
- Total profit
- $254,312
- Equity at exit
- $339,987
Cash invested: $49,000 (down + closing). Projections, not guarantees.
Landlord ↔ Tenant lean methodology
- Overall (STATE)
- 62 Landlord-Friendly
- State Pennsylvania
- 62 Landlord-Friendly · EVEN
- County
- — inherits STATE
- City
- — inherits STATE
ZIP-level market 15801
- Home prices YoY
- 6.3%
- Active inventory
- 41
- Price-to-rent
- 12.4×
Monthly cashflow live
- Estimated rent
- $1,181 medium interval (Pro) →
- Mortgage (P&I)
- −$918
- Tax from tax record
- −$133 /mo · $1,592/yr
- Insurance
- −$73
- HOA
- −$0
- Vacancy / Maint / Mgmt
- −$248
- Net cashflow
- $-190
Break-even live
UW: 25.0% down · 7.5% · 30yr · 1.5% tax · 5.0% vac · 8.0% maint · 8.0% mgmt
Financing live
Cash to close
- Down payment
- $43,750
- Closing costs
- $5,250
- Reserves months
- —
- Total cash needed
- —
Loan-product check · same deal, 3 products live
Conventional
25% down · 7.5% · 30yr
- Down + closing
- —
- Monthly P&I
- —
- Monthly cashflow
- —
- DSCR
- —
- Eligible?
- —
Personal DTI + credit; lowest rate.
DSCR
20% down · 8.5% · 30yr
- Down + closing
- —
- Monthly P&I
- —
- Monthly cashflow
- —
- DSCR
- —
- Eligible?
- —
No personal income docs; deal must DSCR.
Hard money
10% down · 12.0% · 12mo
- Down + closing
- —
- Monthly P&I
- —
- Monthly cashflow
- —
- DSCR
- —
- Eligible?
- —
Short-term bridge; refi at stabilization.
Listing history 4 events
-
2026-04-25status Pending
-
2026-04-10$175,000 Active
-
2026-04-03historical $175,000
-
2020-08-26soldstatus $119,900
ⓘ Source: listings_history table (triggers on properties + properties_extension) + one-shot
backfill from property_details.listing_events for pre-trigger history.
Tax reassessment forecast PA · Partial reset (capped growth)
- Current annual tax
- $1,592 · $133/mo
- Projected year-2 tax
- $2,178 · $182/mo
- Expected delta
- +$587/yr (+$49/mo · 36.9%)
ⓘ Screening estimate from a state-policy table — verify with the county assessor before closing.
Climate risk First Street
- Flood 1/10 Low FEMA zone X (unshaded) · 0% chance over 30 yrs
- Wildfire 1/10 Low
- Heat 3/10 Moderate 7 d/yr ≥93°F today · 18 d/yr by 30 yrs out
- Wind 2/10 Low
- Air quality 2/10 Low 1 unhealthy d/yr today · 2 by 30 yrs out
Nearby sold comps map
Loading sold comps map…
Walkable amenities ~0.75 mi
Loading nearby amenities…
Taxation est. · year 1
- Rental income
- $14,169
- − Mortgage interest
- −$9,803
- − Property taxes
- −$1,592
- − Insurance
- −$875
- − Repairs & maintenance
- −$1,134
- − Management
- −$1,134
- − Depreciation
- −$5,091
- Taxable loss
- −$5,458
- Est. tax savings @ 24.0%
- +$1,310
- After-tax cash flow
- $-976/yr
For passive investors: Depreciation is non-cash, so a rental often shows a tax loss while cash-flowing — sheltering income. Rental losses are passive: they offset passive income freely, and up to $25,000/yr can offset ordinary (W-2) income if you actively participate and your MAGI is under $100k (phasing out to $0 by $150k); unused losses carry forward. On sale, claimed depreciation is recaptured at up to 25%, and gains may owe capital-gains tax (a 1031 exchange can defer both). Figures are a year-1 estimate at your 24.0% rate — not tax advice; consult a CPA.
Schools (NCES district)
- District
- Dubois Area SD
- NCES district ID
- 4207830
- Math proficiency
- 38% ▼ -7.00%
- Reading proficiency
- 55% ▼ -10.00%
- Median HH income
- $42,951
- Composite
- 39.15/100
- National rank
- #4031
- State rank
- #262 of 539 in PA
Livability — DuBois
- Score
- 81/100
- State rank
- #165
- US rank
- #1370
Category grades
Schools grade is shown separately in the Schools card above.
Census & demographics
- Census place
- DuBois, PA
- Population (ZIP)
- 20,251
Population outlook (Clearfield County) Hauer SSP2
- Today (2025)
- 79,658 people
- By 2030
- 78,358 · -1.6%
- By 2040
- 74,670 · -6.3%
- By 2050
- 70,186 · -11.9%
- By 2075
- 60,391 · -24.2%
- By 2100
- 46,886 · -41.1%
Race, ethnicity, and origin ACS 2023
- Neighborhood character
- Predominantly White (95%)
- Race & ethnicity
- White 95% Hispanic / Latino 3% Two or more races 2%
- Common ancestry
- Romanian 8% Slovak 2% Italian 2%
- Foreign-born
- 1%
- Languages at home
- 98% English-only · Spanish 1%
Political lean MEDSL · Clearfield
- 2024 margin
- Solid R (+51.5) · D 23.9% · R 75.4%
- 2008→2024 swing
- -39.4pp toward R · 2008: -12.1pp · 2024: -51.5pp
- All cycles
- 2024: R+51.5 2020: R+49.5 2016: R+49.6 2012: R+28.9 2008: R+12.1
Not yet ingested
- Civics
- —
Market trends
- HPI YoY
- ▲ 16.17%
- Current HPI
- 273.6078
- Rent YoY
- —
- Metro
- —
- State GDP YoY
- ▲ 1.68%
- F500 in state
- 34
Industry mix (Fortune 500 HQ in PA)
| Industry | F500 HQs | Revenue |
|---|---|---|
| Healthcare | 2 | $309B |
|
||
| Insurance | 2 | $27B |
|
||
| Telecommunications / Media | 1 | $124B |
|
||
| Industrial Distribution | 1 | $22B |
|
||
| Financial Services | 1 | $20B |
|
||
| Chemicals / Materials | 1 | $18B |
|
||
Price history
+46.0% since first listed4 events — show timeline
- 2026-04-25 Pending — BRIGHT MLS
- 2026-04-10 Listed $175,000 BRIGHT MLS
- 2026-04-03 Coming Soon $175,000 BRIGHT MLS
- 2020-08-26 Sold (Public Records) $119,900 Public Records
Property tax history
+3.2%/yrLatest (2026): $1,592 · +3.5% YoY. Source: county tax records.
Cash-flow waterfall
monthlySold comps — $/sqft
last 12 mo · ≤1 miLoading sold comps…