238 Hamlin Hwy · Mount Cobb, PA
Flood risk 1/10 · Minimal
- FEMA flood zone
- X (unshaded)
- Chance of flooding over 30 yrs
- 0.0%
- Est. flood insurance / yr
- $507 – $1,088
Fire risk 1/10 · Minimal
- Est. fire insurance / yr
- $511 – $949
Heat risk 2/10 · Minimal
- Hot days now (above 90°F)
- 7 days/yr
- Hot days in 30 yrs
- 16 days/yr
Wind risk 2/10 · Minimal
- Chance of severe wind over 30 yrs
- 3.0%
Air-quality risk 2/10 · Minimal
- Unhealthy air days now
- 1 days/yr
- Unhealthy air days in 30 yrs
- 2 days/yr
Risk factors via First Street. Map © Google.
Why this score? — see what drove the C grade
The composite is a weighted blend of 9 inputs, each scored 0–100. Each bar is that input's sub-score; the figure is the points it added to the 100-point composite (weight × sub-score).
- Cash flow +16.9/30.0
- Appreciation +10.0/10.0
- ARV discount +7.5/15.0
- DSCR +5.3/10.0
- Schools +4.4/10.0
- 1% rule +4.3/10.0
- Livability +3.6/5.0
- Rent growth +2.5/5.0
- Condition / age +2.5/5.0
$204,500
🖨 Deal sheet (PDF) 📄 Offer letter ✓ Due diligence
Listing remarks
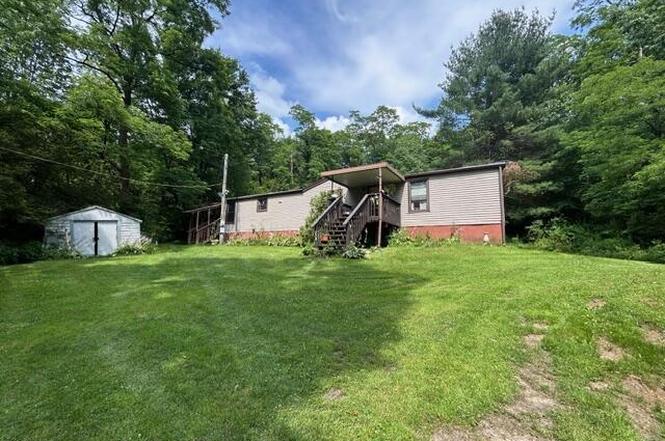
Welcome to peaceful country living at its finest! Nestled on 2.4 beautifully maintained acres, this charming ranch-style home offers the perfect blend of privacy, nature, and convenience. Set back from the road with a long, secluded driveway, the property is heavily wooded for exceptional privacy and a true retreat-like setting. Wildlife is abundant, creating a serene atmosphere where you can enjoy quiet mornings and relaxing evenings surrounded by nature. The land itself is a dream for anyone who loves the outdoors. Multiple mature fruit trees--including peach, apple, and cherry--are scattered throughout the property, along with blackberry and blueberry bushes lining the grounds. Raised ga
Key facts
- Blueberry bushes
- Mature fruit trees
- Raised garden beds
Tags
Neighborhood map
What this means for you Summary
Snapshot
- This is a 3-bed/2.0-bath single-family listed at $204k.
Deal economics
- At list price, monthly cash flow is $136 ($2k/yr) — positive.
- The deal already cash-flows at list — no discount required.
- To meet the 1% rule (rent ≥ 1% of price), the offer needs to be $189k (7.4% below list).
- Recommended offer: $189k (7.4% below list) — sets the bar for 1% rule.
Location & tenants
- Location reads 72/100 on livability (#642 in PA) — a middle-class / working-renter tenant base. Strengths: crime A+, employment A+, housing A+; Watch: amenities F, commute F, health & safety F.
- Western Wayne SD (rural): math 39% / reading 63% proficiency, ranked #165 of 539 in PA (top 31%) — acceptable for families but not a draw, mixed tenant base, ~2y average lease.
- Market conditions: 95 active listings in the ZIP; 177 units permitted in Wayne County in 2024 (0 in 5+ unit buildings).
Forward outlook
- In year one you build about $22k of equity ($1k loan paydown + $20k appreciation (10.0% local appreciation)).
- Wayne County population projected at -17% by 2050 — secular population decline; favor cash flow + early exit over multi-decade hold.
- At projected returns (10.0% appreciation + 3.0% rent growth), your $57k cash investment doubles in ~3 years — after that, you're playing with house money.
- By year 2, paydown + projected appreciation supports a ~$35k cash-out refi (75% LTV) — recoverable capital for the next deal without selling this one.
Negotiation context
- Only 8 days on market — expect competitive offers; lowballing is unlikely to land.
- 8 sale attempts since 18y ago with the ask held roughly flat each time — persistent listings suggest the price (not the market) is what's stuck; bring a comps-based counter.
- Current owner paid $128k; list at $204k implies a 60% gain — meaningful room to come down on a strong offer.
Questions for the listing agent
- Is there a deadline driving the sale (1031 exchange, divorce, estate, relocation)? That informs how much negotiation room exists.
- Schools are B-rated — typically a magnet for longer-tenancy family renters. What's the average tenant stay here, and is there a school-zone premium baked into asking?
- What's the average days-on-market for RENTAL listings here right now (not sales)? A rising rental-DOM trend means longer vacancies and softer asking-rent achievability than the comps imply.
- What's the recent tenant-quality profile in this submarket — average credit score on applications, eviction rate, late-payment / NSF rate, and stable-employment percentage? A property-management company in the area should have these aggregated.
- How much new for-sale + rental construction is in the pipeline within 1–3 miles? Heavy new supply typically softens prices + rents 12–24 months out; constrained supply supports both.
Investment metrics
- 1% rule
- 0.93% ✗
- Cap rate
- 7.09%
- Cash-on-cash
- 2.85%
- DSCR
- 1.13
- GRM
- 9.0
CMA / ARV
No comps found within radius.
Projected returns pro-forma
10.0% appreciation · 3.0% rent growth · sell at horizon
- IRR
- 26.3%
- Equity multiple
- 3.10×
- Total profit
- $120,044
- Equity at exit
- $184,230
- IRR
- 23.1%
- Equity multiple
- 7.05×
- Total profit
- $346,681
- Equity at exit
- $397,299
Cash invested: $57,260 (down + closing). Projections, not guarantees.
Landlord ↔ Tenant lean methodology
- Overall (STATE)
- 62 Landlord-Friendly
- State Pennsylvania
- 62 Landlord-Friendly · EVEN
- County
- — inherits STATE
- City
- — inherits STATE
ZIP-level market 18444
- Home prices YoY
- 24.9%
- Active inventory
- 95
- Price-to-rent
- 9.0×
Monthly cashflow live
- Estimated rent
- $1,893 medium interval (Pro) →
- Mortgage (P&I)
- −$1,072
- Tax from tax record
- −$202 /mo · $2,418/yr
- Insurance
- −$85
- HOA
- −$0
- Vacancy / Maint / Mgmt
- −$397
- Net cashflow
- $136
Break-even live
Sensitivity live
| Price | -10% $252 | -5% $194 | +0% $136 | +5% $78 | +10% $20 |
|---|---|---|---|---|---|
| Rent | -10% $-13 | -5% $61 | +0% $136 | +5% $211 | +10% $286 |
| Rate | -1.0pp $239 | -0.5pp $188 | base $136 | +0.5pp $83 | +1.0pp $29 |
UW: 25.0% down · 7.5% · 30yr · 1.5% tax · 5.0% vac · 8.0% maint · 8.0% mgmt
Financing live
Cash to close
- Down payment
- $51,125
- Closing costs
- $6,135
- Reserves months
- —
- Total cash needed
- —
Loan-product check · same deal, 3 products live
Conventional
25% down · 7.5% · 30yr
- Down + closing
- —
- Monthly P&I
- —
- Monthly cashflow
- —
- DSCR
- —
- Eligible?
- —
Personal DTI + credit; lowest rate.
DSCR
20% down · 8.5% · 30yr
- Down + closing
- —
- Monthly P&I
- —
- Monthly cashflow
- —
- DSCR
- —
- Eligible?
- —
No personal income docs; deal must DSCR.
Hard money
10% down · 12.0% · 12mo
- Down + closing
- —
- Monthly P&I
- —
- Monthly cashflow
- —
- DSCR
- —
- Eligible?
- —
Short-term bridge; refi at stabilization.
Listing history 20 events
-
2026-03-13status Pending
-
2026-03-13status Active
-
2026-03-02status Pending
-
2026-02-23$204,500 Active
-
2025-10-08historical $1,800
-
2025-09-16$1,800
-
2025-09-11historical $1,800
-
2025-08-20price $1,800
-
2025-07-16$2,200
-
2020-09-04soldstatus $127,720
-
2020-08-31soldstatus $127,720
-
2020-08-31soldstatus $127,720
-
2020-08-31soldstatus
-
2020-01-21$124,000
-
2020-01-21$124,000
-
2014-03-04$127,888
-
2012-01-10soldstatus $122,000
-
2008-06-23$127,000
-
1999-05-24soldstatus $15,000
-
1986-08-27soldstatus $9,000
ⓘ Source: listings_history table (triggers on properties + properties_extension) + one-shot
backfill from property_details.listing_events for pre-trigger history.
Tax reassessment forecast PA · Partial reset (capped growth)
- Current annual tax
- $2,418 · $202/mo
- Projected year-2 tax
- $2,825 · $235/mo
- Expected delta
- +$406/yr (+$34/mo · 16.8%)
ⓘ Screening estimate from a state-policy table — verify with the county assessor before closing.
Climate risk First Street
- Flood 1/10 Low FEMA zone X (unshaded) · 0% chance over 30 yrs
- Wildfire 1/10 Low
- Heat 2/10 Low 7 d/yr ≥90°F today · 16 d/yr by 30 yrs out
- Wind 2/10 Low 3% chance of damaging wind over 30 yrs
- Air quality 2/10 Low 1 unhealthy d/yr today · 2 by 30 yrs out
Nearby sold comps map
Loading sold comps map…
Walkable amenities ~0.75 mi
Loading nearby amenities…
Taxation est. · year 1
- Rental income
- $22,714
- − Mortgage interest
- −$11,455
- − Property taxes
- −$2,418
- − Insurance
- −$1,022
- − Repairs & maintenance
- −$1,817
- − Management
- −$1,817
- − Depreciation
- −$5,949
- Taxable loss
- −$1,765
- Est. tax savings @ 24.0%
- +$424
- After-tax cash flow
- $2,058/yr
For passive investors: Depreciation is non-cash, so a rental often shows a tax loss while cash-flowing — sheltering income. Rental losses are passive: they offset passive income freely, and up to $25,000/yr can offset ordinary (W-2) income if you actively participate and your MAGI is under $100k (phasing out to $0 by $150k); unused losses carry forward. On sale, claimed depreciation is recaptured at up to 25%, and gains may owe capital-gains tax (a 1031 exchange can defer both). Figures are a year-1 estimate at your 24.0% rate — not tax advice; consult a CPA.
Schools (NCES district)
- District
- Western Wayne SD
- NCES district ID
- 4226070
- Math proficiency
- 39% ▼ -12.00%
- Reading proficiency
- 63% ▼ -6.00%
- Median HH income
- $51,358
- Composite
- 43.65/100
- National rank
- #2964
- State rank
- #165 of 539 in PA
Livability — Mount Cobb
- Score
- 72/100
- State rank
- #642
- US rank
- #6245
Category grades
Schools grade is shown separately in the Schools card above.
Census & demographics
- Population (ZIP)
- 13,681
Population outlook (Wayne County) Hauer SSP2
- Today (2025)
- 47,924 people
- By 2030
- 46,191 · -3.6%
- By 2040
- 42,815 · -10.7%
- By 2050
- 39,873 · -16.8%
- By 2075
- 34,556 · -27.9%
- By 2100
- 28,358 · -40.8%
Race, ethnicity, and origin ACS 2023
- Neighborhood character
- Predominantly White (91%)
- Race & ethnicity
- White 91% Two or more races 6% Hispanic / Latino 3%
- Common ancestry
- Romanian 16% Scotch-Irish 4% Slovak 2%
- Foreign-born
- 1% · Canada, South Korea
- Languages at home
- 97% English-only · Spanish 2% Russian/Polish/Slavic 1%
Political lean MEDSL · Wayne
- 2024 margin
- Solid R (+37.1) · D 31.1% · R 68.2%
- 2008→2024 swing
- -24.8pp toward R · 2008: -12.3pp · 2024: -37.1pp
- All cycles
- 2024: R+37.1 2020: R+33.6 2016: R+39.7 2012: R+20.9 2008: R+12.3
Not yet ingested
- Civics
- —
Market trends
- HPI YoY
- ▲ 85.51%
- Current HPI
- 428.8661
- Rent YoY
- —
- Metro
- —
- State GDP YoY
- ▲ 1.68%
- F500 in state
- 34
Industry mix (Fortune 500 HQ in PA)
| Industry | F500 HQs | Revenue |
|---|---|---|
| Healthcare | 2 | $309B |
|
||
| Insurance | 2 | $27B |
|
||
| Telecommunications / Media | 1 | $124B |
|
||
| Industrial Distribution | 1 | $22B |
|
||
| Financial Services | 1 | $20B |
|
||
| Chemicals / Materials | 1 | $18B |
|
||
Price history
+2172.2% since first listed20 events — show timeline
- 2026-03-13 Pending — GSBR as distributed by MLS GRID
- 2026-03-13 Relisted — GSBR as distributed by MLS GRID
- 2026-03-02 Pending — GSBR as distributed by MLS GRID
- 2026-02-23 Listed $204,500 GSBR as distributed by MLS GRID
- 2025-10-08 Rental Removed $1,800 GSBR
- 2025-09-16 Listed for Rent $1,800 GSBR
- 2025-09-11 Rental Removed $1,800 GSBR
- 2025-08-20 Price Changed $1,800 GSBR
- 2025-07-16 Listed for Rent $2,200 GSBR
- 2020-09-04 Sold (Public Records) $127,720 Public Records
- 2020-08-31 Sold (MLS) — PWMLS
- 2020-08-31 Sold (MLS) $127,720 PWMLS
- 2020-08-31 Sold (MLS) $127,720 GSBR as distributed by MLS GRID
- 2020-01-21 Listed $124,000 PWMLS
- 2020-01-21 Listed $124,000 PWMLS
- 2014-03-04 Listed $127,888 PMAR
- 2012-01-10 Sold (Public Records) $122,000 Public Records
- 2008-06-23 Listed $127,000 GSBR as distributed by MLS GRID
- 1999-05-24 Sold (Public Records) $15,000 Public Records
- 1986-08-27 Sold (Public Records) $9,000 Public Records
Property tax history
+3.6%/yrLatest (2026): $2,418 · +3.1% YoY. Source: county tax records.
Cash-flow waterfall
monthlySold comps — $/sqft
last 12 mo · ≤1 miLoading sold comps…