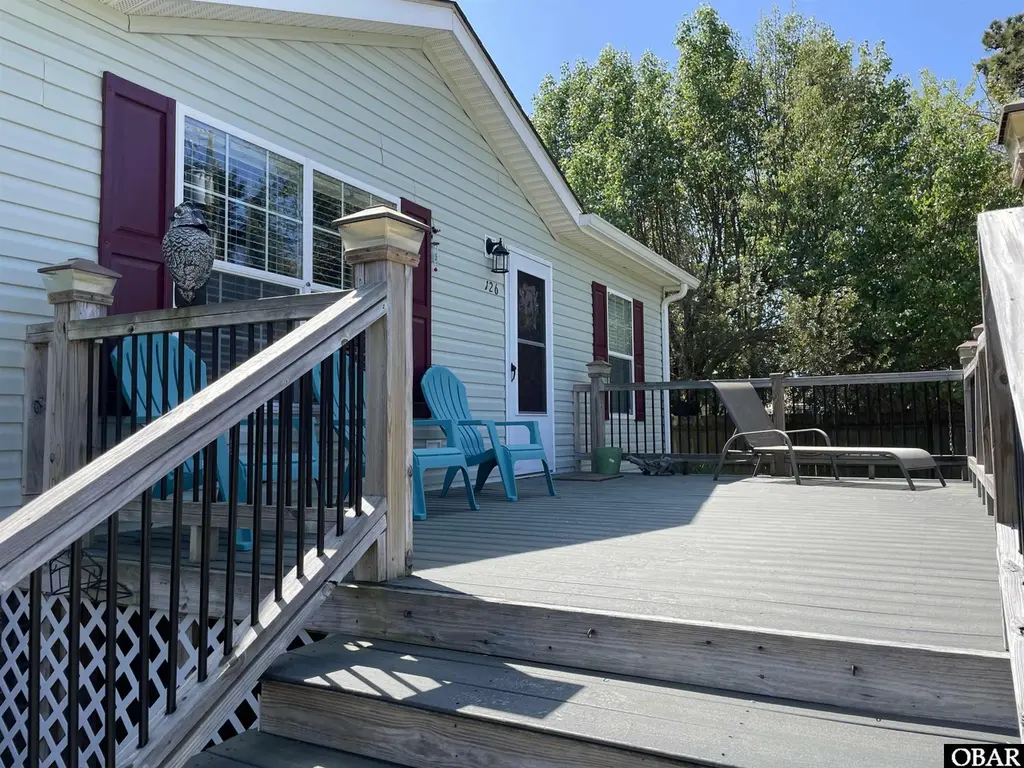
126 Mallard St Lot 140 · Grandy, NC
Flood risk 8/10 · Major
- FEMA flood zone
- X (unshaded)
- Chance of flooding over 30 yrs
- 0.97%
- Est. flood insurance / yr
- $507 – $1,088
Fire risk 3/10 · Minor
- Est. fire insurance / yr
- $906 – $1,684
Heat risk 9/10 · Severe
- Hot days now (above 101°F)
- 7 days/yr
- Hot days in 30 yrs
- 20 days/yr
Wind risk 9/10 · Severe
- Chance of severe wind over 30 yrs
- 99.0%
Air-quality risk 2/10 · Minimal
- Unhealthy air days now
- 0 days/yr
- Unhealthy air days in 30 yrs
- 1 days/yr
Risk factors via First Street. Map © Google.
Why this score? — see what drove the D- grade
The composite is a weighted blend of 9 inputs, each scored 0–100. Each bar is that input's sub-score; the figure is the points it added to the 100-point composite (weight × sub-score).
- Appreciation +10.0/10.0
- Cash flow +7.5/30.0
- ARV discount +7.0/15.0
- Schools +4.2/10.0
- Rent growth +2.5/5.0
- Livability +2.5/5.0
- Condition / age +2.5/5.0
- 1% rule +2.2/10.0
- DSCR +1.6/10.0
$279,000
🖨 Deal sheet 📄 Offer letter ✓ Due diligence
Listing remarks MLS
This 3 bedroom 2 bath home is right in the heart of Grandy. Walking distance to stores and restaurants. This is an affordable home that won't be around long!
Key facts
- Whole home generator
- Boat access
- Built 2009
Tags
Property features AI
Finance
- Financial info: Annual tax amount: $1,109.29
Exterior
- Home design: Mobile home (residential property type)
- Exterior features: Residential zoning
Interior
- Bathrooms: 2 full bathrooms
- Interior features: Located in the Walnut Isle Est subdivision; Directions: From 158 turn into neighborhood, take the first road to the right, approximately 1/3 mile down on the right
Neighborhood map
What this means for you Summary
Snapshot
- This is a 3-bed/2.0-bath manufactured listed at $279k.
Deal economics
- At list price, monthly cash flow is $-415 ($-5k/yr) — negative.
- To cash-flow at today's rent, offer at most $219k (21.5% below list).
- To meet the 1% rule (rent ≥ 1% of price), the offer needs to be $200k (28.3% below list).
- Recommended offer: $200k (28.3% below list) — sets the bar for 1% rule.
- Cap rate 4.8% vs local median 0.6% in Grandy — top-decile yield for the area; either an underpriced asset or a hidden risk that comps aren't pricing in. Stress-test before assuming the spread holds.
Location & tenants
- Location reads: area grade D — affects rentability + tenant quality, not the cash-flow math above.
- Currituck County Schools (rural): math 45% / reading 51% proficiency, ranked #67 of 178 in NC (top 38%) — families likely to look elsewhere, expect single-tenant / working-renter base with shorter leases.
- Market conditions: 63 active listings in the ZIP; 1 comparable units currently listed for rent nearby; 429 units permitted in Currituck County in 2024 (0 in 5+ unit buildings).
Forward outlook
- In year one you build about $30k of equity ($2k loan paydown + $28k appreciation (10.0% local appreciation)).
- Currituck County population projected at +23% by 2050 — long-run rental-demand tailwind backs the buy-and-hold thesis.
- By year 2, paydown + projected appreciation supports a ~$48k cash-out refi (75% LTV) — recoverable capital for the next deal without selling this one.
Negotiation context
- It's been on market 73 days — a 6% lower offer ($262k) is reasonable based on typical stale-listing flexibility.
- 2 sale attempts since 6y ago; this cycle's ask has dropped $278.72M (100%) from the opening price — seller is motivated, your offer sets the floor, not the list.
- Current owner paid $126k; list at $279k implies a 121% gain — meaningful room to come down on a strong offer.
Risks & watch-outs
- Watch-outs: flood insurance adds $66/mo.
- Climate carrying-cost: severe flood risk; severe wind risk, 99% chance of damaging wind over 30y; extreme-heat days projected 7→20/yr by 2055 (HVAC capex compounding) — expect insurance premiums to compound above CPI over the hold.
Questions for the listing agent
- What do current leases actually rent for vs. the listed asking? Can we see a recent rent roll and the last 12 months of T-12 income?
- It's been on market 73 days. Have you received any prior offers? Is the seller open to a 28% concession, seller financing, or rate buy-down credit?
- What's the actual annual flood-insurance premium (NFIP or private), and is the property in a SFHA with mandatory coverage?
- Why hasn't it sold? Are there any deal-killer items the seller is aware of (foundation, flood, title, zoning, code violations)?
- Is there a deadline driving the sale (1031 exchange, divorce, estate, relocation)? That informs how much negotiation room exists.
- The area grade is low — what's the realistic commute time and amenity access for the typical tenant pool here? Any planned neighborhood developments (good or bad) we should know about?
- What's the average days-on-market for RENTAL listings here right now (not sales)? A rising rental-DOM trend means longer vacancies and softer asking-rent achievability than the comps imply.
- What's the recent tenant-quality profile in this submarket — average credit score on applications, eviction rate, late-payment / NSF rate, and stable-employment percentage? A property-management company in the area should have these aggregated.
- How much new for-sale + rental construction is in the pipeline within 1–3 miles? Heavy new supply typically softens prices + rents 12–24 months out; constrained supply supports both.
Investment metrics
- 1% rule
- 0.72% ✗
- Cap rate
- 4.80%
- Cash-on-cash
- -5.35%
- DSCR
- 0.76
- GRM
- 11.6
CMA / ARV
- ARV (on-the-fly)
- $276,048
- Comps found
- 7
Show comp detail 7 sales within ~0.75 mi
| Address | Dist | Beds/Ba | Sqft | Sold | Price | $/sf | Match |
|---|---|---|---|---|---|---|---|
| 109 Evans St Lot 72 | 0.08mi | 3/2.0 | 1,288 (-1%) | 11mo | $295,000 | $229 | 86 |
| 131 Edgewater Dr | 0.23mi | 3/2.0 | 1,344 (+4%) | 1mo | $286,500 | $213 | 82 |
| 131 Edgewater Dr Lot 16 | 0.23mi | 3/2.0 | 1,344 (+4%) | 1mo | $286,500 | $213 | 82 |
| 114 Evans St | 0.18mi | 3/2.0 | 1,248 (-4%) | 11mo | $225,000 | $180 | 77 |
| 114 Evans St Lot 14 | 0.18mi | 3/2.0 | 1,248 (-4%) | 11mo | $225,000 | $180 | 77 |
| 116 Mallard Ln | 0.15mi | 3/2.0 | 1,120 (-14%) | 12mo | $277,000 | $247 | 60 |
| 136 Inlet Ln | 0.35mi | 3/2.0 | 1,115 (-14%) | 19mo | $270,000 | $242 | 45 |
Match score weights: distance 35% · size 25% · config 20% · recency 20%. Top-matched comps best support the ARV.
Projected returns pro-forma
10.0% appreciation · 3.0% rent growth · sell at horizon
- IRR
- 19.8%
- Equity multiple
- 2.61×
- Total profit
- $125,618
- Equity at exit
- $251,345
- IRR
- 18.1%
- Equity multiple
- 6.00×
- Total profit
- $390,829
- Equity at exit
- $542,036
Cash invested: $78,120 (down + closing). Projections, not guarantees.
Landlord ↔ Tenant lean methodology
- Overall (STATE)
- 85 Strongly Landlord-Friendly
- State North Carolina
- 85 Strongly Landlord-Friendly · R+3
- County
- — inherits STATE
- City
- — inherits STATE
ZIP-level market 27939
- Home prices YoY
- 24.0%
- Active inventory
- 63
- Price-to-rent
- 11.6×
Monthly cashflow live
- Estimated rent
- $2,000 medium interval (Pro) →
- Mortgage (P&I)
- −$1,463
- Tax est. 1.5%
- −$349 /mo · $4,185/yr
- Insurance
- −$116
- Flood insurance flood zone
- −$66 /mo · $798/yr
- HOA
- −$0
- Vacancy / Maint / Mgmt
- −$420
- Net cashflow
- $-415
Break-even live
UW: 25.0% down · 7.5% · 30yr · 1.5% tax · 5.0% vac · 8.0% maint · 8.0% mgmt
Financing live
Cash to close
- Down payment
- $69,750
- Closing costs
- $8,370
- Reserves months
- —
- Total cash needed
- —
Loan-product check · same deal, 3 products live
Conventional
25% down · 7.5% · 30yr
- Down + closing
- —
- Monthly P&I
- —
- Monthly cashflow
- —
- DSCR
- —
- Eligible?
- —
Personal DTI + credit; lowest rate.
DSCR
20% down · 8.5% · 30yr
- Down + closing
- —
- Monthly P&I
- —
- Monthly cashflow
- —
- DSCR
- —
- Eligible?
- —
No personal income docs; deal must DSCR.
Hard money
10% down · 12.0% · 12mo
- Down + closing
- —
- Monthly P&I
- —
- Monthly cashflow
- —
- DSCR
- —
- Eligible?
- —
Short-term bridge; refi at stabilization.
Rent comps 1 comps
| Address | Beds | Baths | Sqft | Rent | $/sqft | DOM | Units | Dist |
|---|---|---|---|---|---|---|---|---|
| 6673 Caratoke Hwy Grandy, NC | 2.0 | 2.0 | 1152 | $2,000 | $1.74 | 3d | 1 | 0.76mi |
Listing history 16 events
-
2026-06-18days on market $279,000 Active 73 DOM
-
2026-06-17days on market $279,000 Active 72 DOM
-
2026-06-16days on market $279,000 Active 71 DOM
-
2026-06-15days on market $279,000 Active 70 DOM
-
2026-06-13days on market $279,000 Active 68 DOM
-
2026-06-09days on market $279,000 Active 64 DOM
-
2026-06-08days on market $279,000 Active 63 DOM
-
2026-06-07days on market $279,000 Active 62 DOM
-
2026-06-03days on market $279,000 Active 58 DOM
-
2026-06-02days on market $279,000 Active 57 DOM
-
2026-06-01days on market $279,000 Active 56 DOM
-
2026-05-31days on market $279,000 Active 55 DOM
-
2026-04-06price $279,000
-
2026-04-06$279,000,000 Active
-
2020-08-26soldstatus $126,000 157-char remark
Show marketing remark (157 chars)
This 3 bedroom 2 bath home is right in the heart of Grandy. Walking distance to stores and restaurants. This is an affordable home that won't be around long!
-
2020-05-06$139,900 157-char remark
Show marketing remark (157 chars)
This 3 bedroom 2 bath home is right in the heart of Grandy. Walking distance to stores and restaurants. This is an affordable home that won't be around long!
ⓘ Source: listings_history table (triggers on properties + properties_extension) + one-shot
backfill from property_details.listing_events for pre-trigger history.
Climate risk First Street
- Flood 8/10 Severe FEMA zone X (unshaded) · 97% chance over 30 yrs
- Wildfire 3/10 Moderate
- Heat 9/10 Extreme 7 d/yr ≥101°F today · 20 d/yr by 30 yrs out
- Wind 9/10 Extreme 99% chance of damaging wind over 30 yrs
- Air quality 2/10 Low 0 unhealthy d/yr today · 1 by 30 yrs out
Nearby sold comps map
Loading sold comps map…
Walkable amenities ~0.75 mi
Loading nearby amenities…
Taxation est. · year 1
- Rental income
- $24,000
- − Mortgage interest
- −$15,628
- − Property taxes
- −$4,185
- − Insurance
- −$2,192
- − Repairs & maintenance
- −$1,920
- − Management
- −$1,920
- − Depreciation
- −$8,116
- Taxable loss
- −$9,962
- Est. tax savings @ 24.0%
- +$2,391
- After-tax cash flow
- $-2,584/yr
For passive investors: Depreciation is non-cash, so a rental often shows a tax loss while cash-flowing — sheltering income. Rental losses are passive: they offset passive income freely, and up to $25,000/yr can offset ordinary (W-2) income if you actively participate and your MAGI is under $100k (phasing out to $0 by $150k); unused losses carry forward. On sale, claimed depreciation is recaptured at up to 25%, and gains may owe capital-gains tax (a 1031 exchange can defer both). Figures are a year-1 estimate at your 24.0% rate — not tax advice; consult a CPA.
Schools (NCES district)
- District
- Currituck County Schools
- NCES district ID
- 3701080
- Math proficiency
- 45% ▲ 2.00%
- Reading proficiency
- 51% ▲ 5.00%
- Median HH income
- $58,898
- Composite
- 41.96/100
- National rank
- #3348
- State rank
- #67 of 178 in NC
Livability — Grandy
No livability data for this city. (Only ~50 U.S. cities are tracked.)
Census & demographics
- Census place
- Grandy, NC
- City population
- 3,412
- Population (ZIP)
- 2,422
Population outlook (Currituck County) Hauer SSP2
- Today (2025)
- 28,690 people
- By 2030
- 30,311 · +5.7%
- By 2040
- 33,220 · +15.8%
- By 2050
- 35,405 · +23.4%
- By 2075
- 40,998 · +42.9%
- By 2100
- 44,117 · +53.8%
Race, ethnicity, and origin ACS 2023
- Neighborhood character
- Predominantly White (87%)
- Race & ethnicity
- White 87% Hispanic / Latino 5% Black 4% Two or more races 1%
- Hispanic origin (detail)
- Mexican 4%
- Common ancestry
- Lithuanian 5% German 3% Romanian 3%
- Foreign-born
- 3% · Canada
- Languages at home
- 96% English-only · Spanish 3%
Political lean MEDSL · Currituck
- 2024 margin
- Solid R (+47.9) · D 25.6% · R 73.5%
- 2008→2024 swing
- -16.4pp toward R · 2008: -31.5pp · 2024: -47.9pp
- All cycles
- 2024: R+47.9 2020: R+46.2 2016: R+49.8 2012: R+35.1 2008: R+31.5
Not yet ingested
- Civics
- —
Market trends
- HPI YoY
- ▲ 48.97%
- Current HPI
- 252.96
- Rent YoY
- —
- Metro
- —
- State GDP YoY
- ▲ 3.28%
- F500 in state
- 26
Industry mix (Fortune 500 HQ in NC)
| Industry | F500 HQs | Revenue |
|---|---|---|
| Financial Services | 2 | $213B |
|
||
| Retail | 2 | $95B |
|
||
| Industrial Conglomerate | 1 | $38B |
|
||
| Metals / Steel | 1 | $35B |
|
||
| Utilities | 1 | $30B |
|
||
| Industrial Machinery | 1 | $19B |
|
||
Price history
+99.4% since first listed4 events — show timeline
- 2026-04-06 Price Changed $279,000 OBMLS
- 2026-04-06 Listed $279,000,000 OBMLS
- 2020-08-26 Sold (MLS) $126,000 OBMLS
- 2020-05-06 Listed $139,900 OBMLS
Cash-flow waterfall
monthlySold comps — $/sqft
last 12 mo · ≤1 miLoading sold comps…