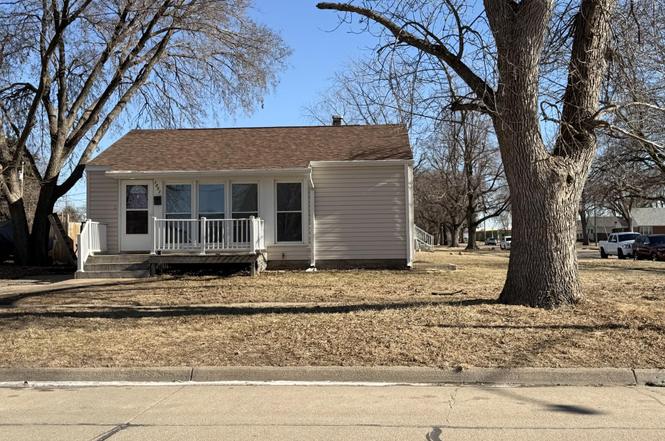
1053 14th Ave · Columbus, NE
Flood risk 1/10 · Minimal
- FEMA flood zone
- X
- Chance of flooding over 30 yrs
- 0.0%
- Est. flood insurance / yr
- $473 – $860
Fire risk 1/10 · Minimal
- Est. fire insurance / yr
- $1,161 – $2,155
Heat risk 3/10 · Minor
- Hot days now (above 104°F)
- 7 days/yr
- Hot days in 30 yrs
- 16 days/yr
Wind risk 2/10 · Minimal
- Chance of severe wind over 30 yrs
- —
Air-quality risk 1/10 · Minimal
- Unhealthy air days now
- 0 days/yr
- Unhealthy air days in 30 yrs
- 0 days/yr
Risk factors via First Street. Map © Google.
Why this score? — see what drove the B grade
The composite is a weighted blend of 9 inputs, each scored 0–100. Each bar is that input's sub-score; the figure is the points it added to the 100-point composite (weight × sub-score).
- Cash flow +27.8/30.0
- ARV discount +14.7/15.0
- DSCR +9.8/10.0
- 1% rule +6.9/10.0
- Livability +4.0/5.0
- Schools +3.5/10.0
- Rent growth +2.5/5.0
- Condition / age +2.5/5.0
- Appreciation +0.0/10.0
$179,900
🖨 Deal sheet (PDF) 📄 Offer letter ✓ Due diligence
Listing remarks MLS
GREAT STARTER HOME OR INVESTMENT OPPORTUNITY. THE HOUSE HAS A 3RD BEDROOM LOCATED IN THE BASEMENT THAT HAS AN EGRESS WINDOW. LOCATED ON A CORNER LOT WITH OFF-STREET PARKING AND A STORAGE SHED. DON'T WAIT, THIS HOUSE IS PRICED TO SELL. .. SEE YOU SOON!
Key facts
- Built 1950
- Listed 38 days
Neighborhood map
What this means for you Summary
Snapshot
- This is a 3-bed/1.0-bath single-family listed at $180k.
Deal economics
- At list price, monthly cash flow is $547 ($7k/yr) — positive.
- The deal already cash-flows at list — no discount required.
- Meets the 1% rule at list price ($2k rent vs $180k).
- Recommended offer: $175k (3.0% below list) — sets the bar for market timing.
- Cap rate 9.9% vs local median 3.3% in Columbus — top-decile yield for the area; either an underpriced asset or a hidden risk that comps aren't pricing in. Stress-test before assuming the spread holds.
Location & tenants
- Location reads 80/100 on livability (#20 in NE, #1,633 nationally) — a professional / high-income tenant draw. Strengths: crime A+, cost of living A+, housing A+; Watch: amenities D-, commute F.
- Columbus Public Schools (town): math 39% / reading 43% proficiency, ranked #93 of 111 in NE (top 84%) — families likely to look elsewhere, expect single-tenant / working-renter base with shorter leases.
- Market conditions: 300 active listings in the ZIP; 1 comparable units currently listed for rent nearby; 98 units permitted in Platte County in 2024 (17 in 5+ unit buildings).
Forward outlook
- Local home prices are declining (-3.0%/yr); year-one equity from $1k of loan paydown is wiped out by about $5k of value loss. Plan a longer hold.
- Platte County population projected at +13% by 2050 — modest demand growth; plan on rents tracking national, not racing it.
- At projected returns (-3.0% appreciation + 3.0% rent growth), your $50k cash investment doubles in ~9 years — after that, you're playing with house money.
Negotiation context
- It's been on market 38 days — a 3% lower offer ($175k) is reasonable based on typical stale-listing flexibility.
- 2 sale attempts since 6y ago with the ask held roughly flat each time — persistent listings suggest the price (not the market) is what's stuck; bring a comps-based counter.
Risks & watch-outs
- Watch-outs: built in 1950 — expect roof / HVAC / electrical / plumbing capex.
Questions for the listing agent
- It's been on market 38 days. Have you received any prior offers? Is the seller open to a 3% concession, seller financing, or rate buy-down credit?
- Built in 1950 — when were the roof, HVAC, electrical panel, plumbing, and water heater last replaced?
- Is there a deadline driving the sale (1031 exchange, divorce, estate, relocation)? That informs how much negotiation room exists.
- What's the average days-on-market for RENTAL listings here right now (not sales)? A rising rental-DOM trend means longer vacancies and softer asking-rent achievability than the comps imply.
- What's the recent tenant-quality profile in this submarket — average credit score on applications, eviction rate, late-payment / NSF rate, and stable-employment percentage? A property-management company in the area should have these aggregated.
- How much new for-sale + rental construction is in the pipeline within 1–3 miles? Heavy new supply typically softens prices + rents 12–24 months out; constrained supply supports both.
Investment metrics
- 1% rule
- 1.19% ✓
- Cap rate
- 9.94%
- Cash-on-cash
- 13.03%
- DSCR
- 1.58
- GRM
- 7.0
CMA / ARV
- ARV (on-the-fly)
- $214,200
- Comps found
- 12
Show comp detail 12 sales within ~0.75 mi
| Address | Dist | Beds/Ba | Sqft | Sold | Price | $/sf | Match |
|---|---|---|---|---|---|---|---|
| 1307 1st St | 0.65mi | 3/1.0 | 1,040 (-1%) | 2mo | $220,000 | $212 | 66 |
| 861 19th Ave | 0.35mi | 3/2.0 | 971 (-8%) | 3mo | $180,000 | $185 | 64 |
| 1168 19th Ave | 0.37mi | 2/1.0 (-1) | 1,100 (+5%) | 7mo | $165,000 | $150 | 64 |
| 916 6th St | 0.37mi | 4/2.0 (+1) | 1,008 (-4%) | 14mo | $255,000 | $253 | 55 |
| 1318 4th St | 0.42mi | 2/1.0 (-1) | 924 (-12%) | 2mo | $163,000 | $176 | 54 |
| 554 22nd Ave | 0.65mi | 2/1.0 (-1) | 1,080 (+3%) | 13mo | $160,000 | $148 | 49 |
| 2203 7th St | 0.60mi | 3/1.0 | 1,110 (+6%) | 24mo | $135,000 | $122 | 42 |
| 580 5th Ave | 0.65mi | 3/1.5 | 1,200 (+14%) | 6mo | $170,000 | $142 | 39 |
| 1714 3rd St | 0.54mi | 3/2.0 | 914 (-13%) | 13mo | $245,000 | $268 | 39 |
| 2114 8th St | 0.53mi | 2/1.0 (-1) | 909 (-13%) | 14mo | $185,000 | $204 | 36 |
| 2018 3rd St | 0.66mi | 2/1.0 (-1) | 912 (-13%) | 8mo | $225,000 | $247 | 36 |
| 817 3rd St | 0.67mi | 4/2.0 (+1) | 912 (-13%) | 23mo | $237,000 | $260 | 19 |
Match score weights: distance 35% · size 25% · config 20% · recency 20%. Top-matched comps best support the ARV.
Projected returns pro-forma
-3.0% appreciation · 3.0% rent growth · sell at horizon
- IRR
- 2.9%
- Equity multiple
- 1.11×
- Total profit
- $5,650
- Equity at exit
- $26,824
- IRR
- 12.5%
- Equity multiple
- 1.99×
- Total profit
- $49,644
- Equity at exit
- $15,554
Cash invested: $50,372 (down + closing). Projections, not guarantees.
Landlord ↔ Tenant lean methodology
- Overall (STATE)
- 83 Strongly Landlord-Friendly
- State Nebraska
- 83 Strongly Landlord-Friendly · R+13
- County
- — inherits STATE
- City
- — inherits STATE
ZIP-level market 68601
- Home prices YoY
- -22.4%
- Active inventory
- 300
- Price-to-rent
- 7.0×
Monthly cashflow live
- Estimated rent
- $2,135 medium interval (Pro) →
- Mortgage (P&I)
- −$943
- Tax from tax record
- −$121 /mo · $1,456/yr
- Insurance
- −$75
- HOA
- −$0
- Vacancy / Maint / Mgmt
- −$448
- Net cashflow
- $547
Break-even live
Sensitivity live
| Price | -10% $649 | -5% $598 | +0% $547 | +5% $496 | +10% $445 |
|---|---|---|---|---|---|
| Rent | -10% $378 | -5% $463 | +0% $547 | +5% $631 | +10% $716 |
| Rate | -1.0pp $637 | -0.5pp $593 | base $547 | +0.5pp $500 | +1.0pp $453 |
UW: 25.0% down · 7.5% · 30yr · 1.5% tax · 5.0% vac · 8.0% maint · 8.0% mgmt
Financing live
Cash to close
- Down payment
- $44,975
- Closing costs
- $5,397
- Reserves months
- —
- Total cash needed
- —
Loan-product check · same deal, 3 products live
Conventional
25% down · 7.5% · 30yr
- Down + closing
- —
- Monthly P&I
- —
- Monthly cashflow
- —
- DSCR
- —
- Eligible?
- —
Personal DTI + credit; lowest rate.
DSCR
20% down · 8.5% · 30yr
- Down + closing
- —
- Monthly P&I
- —
- Monthly cashflow
- —
- DSCR
- —
- Eligible?
- —
No personal income docs; deal must DSCR.
Hard money
10% down · 12.0% · 12mo
- Down + closing
- —
- Monthly P&I
- —
- Monthly cashflow
- —
- DSCR
- —
- Eligible?
- —
Short-term bridge; refi at stabilization.
Rent comps 1 comps
| Address | Beds | Baths | Sqft | Rent | $/sqft | DOM | Units | Dist |
|---|---|---|---|---|---|---|---|---|
| 602 8th St Columbus, NE | 3.0 | 1.0–2.0 | 820 | $2,135 | $2.60 | 45d | 22 | 0.54mi |
Listing history 10 events
-
2026-04-03soldstatus $187,662
-
2026-02-26status Pending
-
2026-02-26price $179,900
-
2026-01-19$185,000 Active
-
2020-06-11soldstatus $128,000
-
2020-03-16soldstatus $116,000
-
2020-03-13soldstatus $114,900 251-char remark
Show marketing remark (251 chars)
GREAT STARTER HOME OR INVESTMENT OPPORTUNITY. THE HOUSE HAS A 3RD BEDROOM LOCATED IN THE BASEMENT THAT HAS AN EGRESS WINDOW. LOCATED ON A CORNER LOT WITH OFF-STREET PARKING AND A STORAGE SHED. DON'T WAIT, THIS HOUSE IS PRICED TO SELL. .. SEE YOU SOON!
-
2020-01-27$114,900 251-char remark
Show marketing remark (251 chars)
GREAT STARTER HOME OR INVESTMENT OPPORTUNITY. THE HOUSE HAS A 3RD BEDROOM LOCATED IN THE BASEMENT THAT HAS AN EGRESS WINDOW. LOCATED ON A CORNER LOT WITH OFF-STREET PARKING AND A STORAGE SHED. DON'T WAIT, THIS HOUSE IS PRICED TO SELL. .. SEE YOU SOON!
-
2013-12-06soldstatus $79,900
-
2003-04-14soldstatus $57,500
ⓘ Source: listings_history table (triggers on properties + properties_extension) + one-shot
backfill from property_details.listing_events for pre-trigger history.
Tax reassessment forecast NE · Resets to sale price
- Current annual tax
- $1,456 · $121/mo
- Projected year-2 tax
- $3,112 · $259/mo
- Expected delta
- +$1,656/yr (+$138/mo · 113.7%)
ⓘ Screening estimate from a state-policy table — verify with the county assessor before closing.
Climate risk First Street
- Flood 1/10 Low FEMA zone X · 0% chance over 30 yrs
- Wildfire 1/10 Low
- Heat 3/10 Moderate 7 d/yr ≥104°F today · 16 d/yr by 30 yrs out
- Wind 2/10 Low
- Air quality 1/10 Low 0 unhealthy d/yr today · 0 by 30 yrs out
Nearby sold comps map
Loading sold comps map…
Walkable amenities ~0.75 mi
Loading nearby amenities…
Taxation est. · year 1
- Rental income
- $25,620
- − Mortgage interest
- −$10,077
- − Property taxes
- −$1,456
- − Insurance
- −$900
- − Repairs & maintenance
- −$2,050
- − Management
- −$2,050
- − Depreciation
- −$5,233
- Taxable income
- $3,854
- Est. tax owed @ 24.0%
- −$925
- After-tax cash flow
- $5,638/yr
For passive investors: Depreciation is non-cash, so a rental often shows a tax loss while cash-flowing — sheltering income. Rental losses are passive: they offset passive income freely, and up to $25,000/yr can offset ordinary (W-2) income if you actively participate and your MAGI is under $100k (phasing out to $0 by $150k); unused losses carry forward. On sale, claimed depreciation is recaptured at up to 25%, and gains may owe capital-gains tax (a 1031 exchange can defer both). Figures are a year-1 estimate at your 24.0% rate — not tax advice; consult a CPA.
Schools (NCES district)
- District
- Columbus Public Schools
- NCES district ID
- 3105340
- Math proficiency
- 39% ▼ -10.00%
- Reading proficiency
- 43% ▼ -3.00%
- Median HH income
- $51,074
- Composite
- 35.41/100
- National rank
- #4942
- State rank
- #93 of 111 in NE
Livability — Columbus
- Score
- 80/100
- State rank
- #20
- US rank
- #1633
Category grades
Schools grade is shown separately in the Schools card above.
Census & demographics
- Census place
- Columbus, NE
- City population
- 30,619
- Population (ZIP)
- 30,619
Population outlook (Platte County) Hauer SSP2
- Today (2025)
- 34,130 people
- By 2030
- 34,778 · +1.9%
- By 2040
- 36,436 · +6.8%
- By 2050
- 38,648 · +13.2%
- By 2075
- 47,293 · +38.6%
- By 2100
- 57,020 · +67.1%
Race, ethnicity, and origin ACS 2023
- Neighborhood character
- Predominantly White (71%)
- Race & ethnicity
- White 71% Hispanic / Latino 25% Two or more races 14%
- Hispanic origin (detail)
- Mexican 14% Cuban 2%
- Common ancestry
- Romanian 7% Portuguese 2% Lithuanian 1%
- Foreign-born
- 14% · Canada
- Languages at home
- 79% English-only · Spanish 20%
Political lean MEDSL · Platte
- 2024 margin
- Solid R (+58.3) · D 20.4% · R 78.7%
- 2008→2024 swing
- -16.8pp toward R · 2008: -41.5pp · 2024: -58.3pp
- All cycles
- 2024: R+58.3 2020: R+56.8 2016: R+58.8 2012: R+51.8 2008: R+41.5
Not yet ingested
- Civics
- —
Market trends
- HPI YoY
- ▼ -100.37%
- Current HPI
- 347.5063
- Rent YoY
- —
- Metro
- —
- State GDP YoY
- ▲ 0.68%
- F500 in state
- 2
Industry mix (Fortune 500 HQ in NE)
| Industry | F500 HQs | Revenue |
|---|---|---|
| Conglomerate | 1 | $371B |
|
||
Price history
+226.4% since first listed10 events — show timeline
- 2026-04-03 Sold (Public Records) $187,662 Public Records
- 2026-02-26 Pending — CBOR
- 2026-02-26 Price Changed $179,900 CBOR
- 2026-01-19 Listed $185,000 CBOR
- 2020-06-11 Sold (Public Records) $128,000 Public Records
- 2020-03-16 Sold (Public Records) $116,000 Public Records
- 2020-03-13 Sold (MLS) $114,900 CBOR
- 2020-01-27 Listed $114,900 CBOR
- 2013-12-06 Sold (Public Records) $79,900 Public Records
- 2003-04-14 Sold (Public Records) $57,500 Public Records
Property tax history
+2.8%/yrLatest (2025): $1,456 · +6.8% YoY. Source: county tax records.
Cash-flow waterfall
monthlySold comps — $/sqft
last 12 mo · ≤1 miLoading sold comps…